Electrical resistivity and spatial variation in
agriculture terraces: statistical correlation
between ERT and flow...
Article · June 2017 DOI: 10.1515/opag-2017-0037 CITATIONS0
READS108
5 authors, including: Some of the authors of this publication are also working on these related projects: CloudMapper - Plataforma de processamento e disseminação de dados georreferenciados com base na CloudView project Mapeamento de Perigo a Corridas de Detritos: Proposta Metodológica para Previsão de Impactos. View project Carlos Bateira University of Porto 55 PUBLICATIONS 153 CITATIONS SEE PROFILE António Costa University of Porto 32 PUBLICATIONS 3 CITATIONS SEE PROFILE Bruno Fonseca University of Porto 6 PUBLICATIONS 0 CITATIONS SEE PROFILE Rui Moura University of Porto 62 PUBLICATIONS 105 CITATIONS SEE PROFILE
1 Introduction
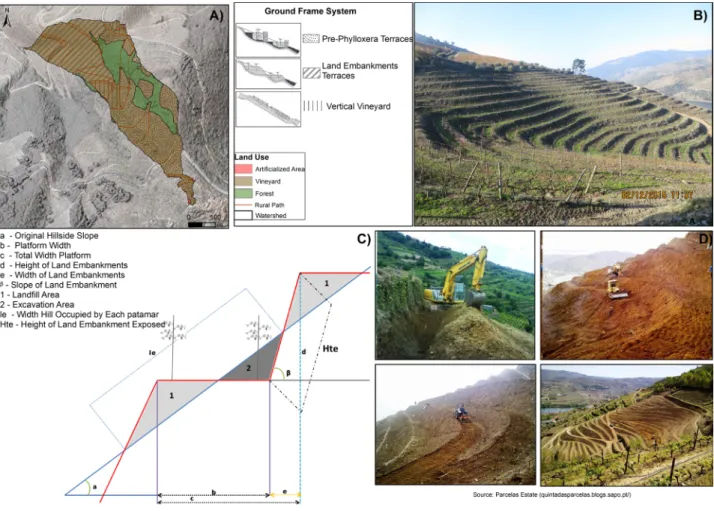
Wine production in the Alto Douro Wine Region is based on agricultural terraces once supported exclusively by dry stone vertical walls, which have been replaced by earthen embankments with an inclination of 100% to 175%. This change is justified by the easy access to equipment and technological improvements related to automation in vineyard work (Figure 1 - D).
Because of these changes, the platform of the terrace has two sections: one excavated, (Figure 1 - C, point 2), and another filled by the materials removed from the excavated section (Figure 1 – C, point 1). The filled section represents topsoil materials (re)moved from the upstream slope. That section represent friable materials derived from weathered metasedimentary rocks (Lesschen et al. 2008) (Figure 1 – B and C). This non-resistant material constitutes part of the platform and part of the earthen embankment. As a result, this morphological change raises a group of problems related to the structural variation of soil and internal water circulation. With electrical resistivity tomography (ERT) techniques, we analysed the spatial variation of the electrical resistivity, because lower values of electrical resistivity are related to soil moisture.
ERT tests represent a non-invasive method to identify the physical properties of the soil (Samouelian et al. 2005). Several authors used this Geophysical method to obtain an image of the spatial variation soil profile related to soil hydrological processes. Brunet et al. (2010) used ERT to assess the soil water deficit. This technique compares the relationships between the root zone of plants and the water content to inform the management of irrigation practices (Michot et al. 2003; Werban et al. 2008). Other authors, such as Schwartz et al. (2008) and Calamita et al. (2012), used ERT for the analysis of the spatial distribution of soil moisture. Landslide susceptibility analyses use ERT to obtain a detailed image of the subsurface in order to apply geophysical methods in the back analysis of soil
DOI 10.1515/opag-2017-0037
Received January 31, 2017; accepted May 30, 2017
Abstract: The construction of earthen embankment
terraces in the Douro Region raises a set of problems related to hydrological processes. The main objective of this study is the evaluation of the spatial variation of electrical resistivity in agriculture terraces at Douro valley (Portugal). To achieve this objective, two variables are analysed, the soil electrical resistivity and the flow direction algorithm. In a field survey we recorded 13 electrical resistivity profiles. The contributing area was calculated with the algorithms D∞ (Deterministic Infinity Flow) and MFD (Multiple Flow Direction) and the results are the base of the internal runoff modelling, both supported by the digital elevation model with a spatial resolution of 1m2. A correlation between the spatial variation of the soil electrical resistivity represented by the standard deviation of the electrical resistivity for each profile and the average value of the contributing area coincident with each profile was established. The electrical resistivity standard deviation seems to be moderately well correlated according to the D∞ algorithm at about 1m of depth, and it has a good correlation at 1,5m to 2m of depth with the MFD algorithm. Taken together, the results show a significant positive statistical correlation between the electrical resistivity standard deviation and the contributing areas (MFD and D∞) depending on the soil depth.
Keywords: electrical resistivity tomography; multiple flow
direction; D-infinity; electrical resistivity spatial variation; agricultural terraces
Research Article
Open Access
J. Fernandes*, C. Bateira, A. Costa, B. Fonseca, R. Moura
Electrical resistivity and spatial variation in
agriculture terraces: statistical correlation
between ert and flow direction algorithms
*Corresponding author: J. Fernandes, FLUP – Faculty of Arts of the
University of Porto, Portugal, E-mail: [email protected]
C. Bateira, Riskam, CEG, IGOT/FLUP, UP
A. Costa, B. Fonseca, FLUP – Faculty of Arts of the University of
Porto, Portugal
parameters such as cohesion (Friedel et al. 2006). On the other hand, Piegari et al. (2009) use the electrical resistivity to model landslide susceptibility together with the safety factor index and the slope angle. Other authors used the ERT method in vineyards for estimating the soil water content (Dafonte et al. 2013), to access spatial variability of vegetative growth and yield (R. Rossi et al. 2013), to determinate the soil water available to plants (Brillante et al. 2015) and to estimate soil compaction (García-Tomillo et al. 2015). These authors concluded that ERT adequately describes the water content in the soil and the relationships between the plants and soil. For these reasons, it appears to be a very effective method in soil water content assessment in agriculture management.
The contributing area, estimated from digital elevation models (DEMs), represents the area that can potentially produce runoff along the watershed to each grid cell (Erskine et al. 2006). Depending on the selected algorithm, the internal runoff modelling can have different configurations. Contribution areas, modelled from digital elevation models, have been widely applied to distributed
hydrological models (Erskine et al. 2006). The first of the main methods was presented by O’Callaghan and Mark (1984) and assigns the flow direction of each pixel to the eight adjacent or diagonal neighbour cells to the areas with the highest downward slope (Tarboton 1997). Quinn et al. (1991) suggested a Multiple Flow Direction (MFD) model that distributes the flow to all cells in three main directions. Lea (1992) developed an algorithm that uses the aspect of each pixel to define the directions of the flow (Tarboton 1997). Costa-Cabral and Burges (1994) presented the Digital Elevation Models Network (DEMON) model, which is based on the theory that the flux generated in a pixel is projected for the downslope in a two-dimensional way, based on the aspect angle directions. Tarboton (1997) created a new algorithm, Deterministic Infinity Flow (D∞), based on flow direction to a single angle taken to the steepest downward slope in eight directions centred at each pixel. A new triangular multiple flow direction method (MD∞) was suggested by Seibert and McGlynn (2007). The MD∞ method intends to combine the advantages of MDF and D∞ algorithms.
Figure 1: Agriculture Terraces at Douro valley. A - Ground frame system in S. Luis estate. B – Earthen embankment terraces. C – Terrace
Basically, this method determines that, for each grid cell, the accumulated area is distributed to neighbouring cells.
The MFD algorithm is used in the modelling of landslide susceptibility on the application of the mathematical physically based Shalstab model (i.e. Sarkar et al. 2016; Aristizábal et al. 2015; Teixeira et al. 2015). The D∞ algorithm has been used as an input for the calculation of landslide susceptibility via the application of the SINMAP model (i. e. Arkgun and Erkan 2016; Rabonza et al. 2016; Nery and Vieira 2015).
López-Vicente and Navas (2010) used the algorithms D8, MFD and combined flow MDD to calculate the flow accumulation in a study of hydric soil erosion in mountain agriculture landscapes. The authors concluded that the MDD algorithm promotes a more realistic approximation of the internal flow paths. On the other hand, the MFD is effective in the definition of concentrated flow but overestimates the erosion rates. In D8 and MDD algorithms the soil erosion rate is similar.
Faria et al. (2016) used the MDF and D∞ models for the evaluation of landslide susceptibility in agricultural terraces at the Douro Demarcated Region. The authors state that MDF represents the internal flow based on main paths. The D∞ suggests an influence of the morphology of the terraces, because the model shows a diffuse internal flow, dominant at the upper and medium part of the slopes.
The main objective of the present paper is to identify the relationship between electrical resistivity and Multiple Flow Direction and the Deterministic Infinity Flow algorithms. The construction of soil saturation cartography using the correlation of the algorithms of the contributing area MFD and D∞ with the electrical resistivity standard deviation along the S. Luis watershed is a major objective. We propose to use the results of this analysis in future works related to the analysis of embankment instability along the agricultural terraces in the Douro valley using the SHALSTAB and SINMAP models.
2 The Electrical Resistivity of Soils
The electrical resistivity is a non-invasive method that can help study the spatial and temporal variability of soils. Following the considerations of Friedman (2005), there are three principal categories that explain electrical variability: the bulk soil that defines the structural composition of soil (porosity, water content and structure); the soil particle quantifiers that are related to the particle size, distribution and exchange capacity; and attributes of the soil solutions
According the studies of Pozdnyakov et al. (2006) and McCarter (1984), when the soil water content increases from air-dry to water-saturated soil, a double electric layer forms and the macro pores become saturated. Water is therefore retained by capillary forces relative to soil particles, and the mobility of electrical charges are increased with increasing soil water content. According to this model, resistivity decreases rapidly with increasing soil water content and the pore geometry influences the variation in electrical resistivity. In the micro aggregates the voids contain air, which increases the electrical resistivity. In the mesopores, there is the possibility of mineral sediment aggregates, which retain water, leading to lower air volume as well as lower electrical resistivity. In macropores the larger space between broken rocks allows higher air retention and thus higher electrical resistivity (Robain et al. 1996).
3 Material and Methods
The study was performed on a watershed with 61.26 ha (Figure 2), located at Quinta de S. Luiz in the Alto Douro Wine Region. The lithology of the study area is the metamorphic formation of Bateiras, mainly corresponding to phyllites and metagraywackes (Sousa and Sequeira 1989). Originally the soils were defined as leptosols (FAO 2006), but due to the process leading to the construction of the terraces and the long and intensive agricultural use of the area, the soils became anthrosols (Figure 2 - C). The anthrosols are anthropogenic soils modified by the construction of terraces and the cultivation and mechanization activity of vineyards; however, the horizontal differentiation of soil remains intact at a depth of 1.5m or deeper (FAO 2006). These soils reveal a relatively recent (20 to 30 year) ongoing important structural modification. The process of terrace building mobilizes the soil up to a depth of 1.5 m, which represents an important influence on hydrologic processes.
3.1 Multiple Flow Direction and D-Infinity
Algorithm – Modelling Process
In order to define the best algorithm to represent the internal runoff along a river basin we tested the Multiple Flow Direction (Quinn et al. 1991) and the Deterministic Infinity Flow (Tarboton 1997), since they define the internal runoff process on the slope instability models of SHALSTAB (Dietrich and Montgomery 1998) and SINMAP (Pack et al. 1998).
The Multiple Flow Direction (MFD) algorithm allows the calculation of contributing areas by means of a multi-directionally distributed flow from one cell to the adjacent pixels, following three main directions (Figure 3 and eq. 1). This means that each cell can receive a percentage of flow from several cells along all parts of the slope. This configuration leads to a downslope concentration of the flow along main paths well scattered all over the basin.
(Eq. 1) (Eq. 1)
Where:
n is the total number of downhill directions; ΔA is the amount passed onto the ith downhill cell; A is the total upslope area accumulated in the current cell; tan βi is the gradient (difference in elevation/distance
between the elevation values) in the ith downhill directions;
Li is the contour length of the ith direction either cardinal (Ll) or diagonal (L2).
The Deterministic Infinity Flow (D ∞) from Tarboton (1997) represents the flow into two directions based on
a single angle taken as the steepest downward slope on the eight triangular facets centred at each pixel (Figure 4). This method promotes the reception of the main part of the flow by very few cells on the upper part of a basin, keeping very low flow accumulation values on the major part of the slope upstream areas. This way, the internal flow modelling on a huge part of a basin is representative of a diffuse flow.
The MFD and D∞ algorithms were performed using the “Extended Neighbourhood – Catchment Areas (parallel)” tool within SAGA GIS 2.1.2 software. The input data is a DEM created from aerial photographs, acquired by a digital camera. A stereo pair of photos was obtained, having a pixel size of 50 cm, a longitudinal overlap of 60%, and a lateral overlap of 30%. The photos were orthorectified using 6 ground control points surveyed with a dual frequency GPS receiver in real time kinematic mode. A stereomatching procedure was used to obtain a dense point cloud, and finally, a regular grid DEM, with a grid spacing of 1 meter. The Agisoft PhotoScan software was used to execute the photogrammetric process.
Figure 2: Study area framework. A. Location of Quinta de S. Luiz, in the spatial perimeter of the DDR ; B. Study watershed field monitoring;
According to Zhang and Montgomery (1994) the DEM pixel size affects the spatial distribution of runoff processes. Claessens et al. (2005) consider that the topographic and hydrologic characteristics diverge between landscapes and, therefore, the DEM resolution to use must be adapted to each working area. In this sense, Habtezion et al. (2016) compared nine modelling scenarios with different DEM resolutions and considered that coarser DEM resolutions tended to eliminate topographic features, reduce surface
depression storage, and strengthen hydrologic connectivity and surface runoff. In the study watershed, mostly occupied by vineyards, a coarser DEM resolution was used in order to minimize the influence of the vineyards and vegetation that may cause a barrier to the runoff. For this reason a DEM of 1m resolution was used in order to guarantee the internal hydrological connectivity of the contributory areas, but also to provide enough resolution to represent the morphology of the main agricultural terraces.
Figure 3: Flow partitioning using a multiple flow direction algorithm (Quinn et al. 1991)
3.2 Electrical Resistivity Tomography – Field
Methods
We made 13 transects in the study area for the ERT profiles. The measurements were performed after rainfall episodes, in convex and concave areas within the the platform of agricultural terraces. Each transect has 60 meters, following the Wenner array for 1, 2, 3, 4, and 5 meters of electrode distance reaching depths of 0.5, 1, 1,5, 2 and 2.5 respectively. We used the Wenner array because is a method that is sensitive to vertical changes in electrical resistivity below the centre of the array. In the Wenner array, the median depth of investigation is approximately 0.5 times the electrode “a” spacing used (Lock 1999).
The ERT measurements were processed by injecting current into the soil through two current electrodes (C1 and C2), and measuring the resulting voltage difference at two potential electrodes (P1 and P2) (Loke 1999) with an ABEM SAS 300C resistivimeter. ZondRes2d software was used to process and represent field survey electrical resistivity data. The parameters chosen to produce electrical resistivity inversion models are 10 centimetres of spatial resolution, 20 layers and a vertical factor of 1. The models were processed with the Marquardt algorithm that uses the least-squares method with regularization by a damping parameter (Zond geophysical software 2016), with 10 interactions and a 0.3 RMS error value as stop criteria.
3.3 Electrical Resistivity Tomography –
Acquiring Data
From field monitoring and observations, we obtained the information that, in general, the first 10 to 30 cm of the soil profile registered a gravel value of 24.6% (Fernandes et al. 2017). That is the result of the schist disaggregation during the terrace building, but, in some cases, it is a consequence of the collapse of the stone walls. Beneath this layer, up to 1 meter of depth, the gravel scatters in a soil matrix with 64.5 % silt and clay (Fernandes et al. 2017) and with thin vineyard roots as well. This structure influences the soil porosity leading to a high value of saturated hydraulic conductivity, with an average value of 0.041 m/min (Fernandes et al. 2017). The reason for this is related to the construction process of the terrace platform. The machinery mobilizes all the materials to 1m of depth in order to create voids in the upper part of the terrace and promote the internal runoff and soil air circulation.
From 1.5m to 2m there is a great variability in the soil profile. There are segments of soil profile that retain
significant water parallel to others without water, showing a great variability of the soil saturation. Originally subtract, (rigid schist), generally appears at a depth of 2m and in the lowest layers.
In general, all resistivity profiles show higher values of electrical resistivity near the surface. In most profiles (3, 4, 5, 6, 7, 8 and 12) at the surface (above 0.5m), the electrical resistivity values are greater than 100 Ω.m, which shows the presence of rock disaggregation (figure 6). However, the values are not consistent with Samouelian et al. (2005), because miscellaneous soil reveals the presence of gravel mixed with clay.
The next soil layer, up to 1.5 meters deep, reveals a range of values between 2 Ω.m and 80 Ω.m, approximately, in all profiles (Figure 5). This layer porosity, which allows water circulation, also similarly proven by Dafonte et al. (2013), is consistent with the values presented by Samouelian et al. (2005) that reveal the presence of fresh water. Furthermore, with this range of values, Braga et al. (2006) advocates the presence of saturated sediments, namely clays and sands. Profiles 1, 2, 7, 9, 10 and 11 denote a greater soil moisture, highlighting the profiles 9, 10 and 11 in which the values in that layer do not exceed 10 Ω.m. These values are consistent with the range of values for clays (Samouelian et al. 2005), similar to Gunn et al. (2015, 2011) in areas of high moisture and low electrical resistivity, and are also consistent with values reported for saturated clays presented by Braga et al. (2006) (Figure 5).
At 2 meters of depth or greater, all profiles show lower values of electrical resistivity. Excluding profiles 3, 4 and 7 (where values range up to 200 Ω.m), the resistivity values do not exceed 60 Ω.m. The results obtained in these profiles are in agreement with the range of electrical resistivity exposed by Samouelian et al. (2005) that consider the presence of shale, justifying lower soil heterogeneity. Consequently, the less weathered shale substrate impedes the movement of the internal flow resulting in water accumulation in the soil layers above (Figure 5).
The soil electrical resistivity survey revealed a great variation in soils (Figure 5). We can find great horizontal variability of soil along a series of profiles (3, 4, 7, 8, 11, 12, and 13) and, at same time, an important number of profiles (1, 2, 5, 6, and 9) show horizontal homogeneity. On the other hand, the vertical variability of the soil is always present in all profiles, although with different degrees of variation.
The profiles with a significant horizontal variation show resistivity values consistent with the presence of saturated soils, since the soil survey was performed after rainy periods. That is consistent with the existence of main paths for internal flow circulation at those areas of the soil
represented on the electrical resistivity profiles (Figure 5), as stated by Erskestine et al. (2006). In the middle and top sections of the slope, the D∞ algorithm models the internal flow mainly along the first order streams maintaining large areas with low values of contributing areas.
We verify that the correlation between the average values of flow accumulation and standard deviation values of electrical resistivity depends on the soil depth. The correlation is positive and grows with the higher depths. Thus, the highest values of electrical resistivity standard deviation are coincident with higher values of flow accumulation. The correlation at 1m of depth is R2 = 0.6229 for MFD (Figure 6), and R2 = 0.6955 for D∞
algorithm (Figure 6) In this layer, the soil disaggregation due to the construction of the terraces and the elevated amount of gravel explains the weak variation of soil electrical resistivity at higher values (Figure 5). At this depth the infiltration proceeding through the macro pores is significant. That infiltration is an important contribution to the moisture content in the lower layers. The higher correlation given by the D∞ algorithm means that this algorithm is more efficient to represent the internal flow at the upper part of watershed (Tarboton 1997). The larger areas of the watershed, with low values of contributing areas and the homogeneity of the soil, make the D∞ algorithm show better correlation with the soil moisture variation at 1m of depth. In contrast, the MFD simulates a flow with more connectivity (Quinn et al. 1991) and wider flow paths (Erskine et al. 2006), mainly along the middle sections of the slope. This connectivity relates to the main water paths observed along the deepest layers, (1.5 and 2 m depth). That connection is shown by the correlation with the MFD contributing area at 1.5 and 2m of R2 = 0.7269 and R2 = 0.7555, respectively
(Figures 7 and 8). On the other hand, at these depths, the correlation shown by the D∞ algorithm is lower, with R2 = 0.6477 at 1.5 m and R2 = 0.5314 at 1.5 to 2 m depths
(Figures 7 and 8). These results show that MFD is more effective in modelling the subsurface flow at the lower soil layers.
In short, we can say that: (1) The D∞ algorithm has the better direct correlation with the soil moisture variation within the first 1m of the soil layers. This soil layer supports an intense modification during the terrace construction process giving to the soil a desegregated but uniform structure. (2) The MFD model has the better direct correlation with the soil moisture variation at the 1.5 and 2m depths. In these soil layers the main paths of water flow are the principal characteristics of the internal runoff as demonstrated by the electrical resistivity profiles. profile (Chambers et al. 2008). In opposition, the profiles
with low horizontal variation do not reveal a frequently saturated soil and seem to be less prone to developing significant internal flow.
3.4 The Spatial Variation of Electrical
Resis-tivity – Statistical Correlation
The statistical correlation between the flow direction algorithms and electrical resistivity cannot be made in a linear way. This relationship can be made by comparing field resistivity measurements and the flow accumulation values in the same location. Thus, in a GIS environment, the values of three depths of the electrical resistivity profiles were overlaid with flow accumulation of both flow direction algorithms. We analysed the electrical resistivity of the inversion model for all profiles, along the transect, at 1, 1.5 and 2 meters of depth, but only in areas where the contributing areas values were below 400 m2. Values from
areas higher than 400 m2 do not represent the internal
flow of the slope but the superficial flow along the main water lines.
For each electrical resistivity profile, the standard deviations of the resistivity inversion model and the average of the flow accumulation values were calculated. We subsequently adjusted a trend line based on a second order power regression equation and identified the coefficient of multiple determination (R2). Using this equation and, based on the two contributing area models, in GIS environment we mapped the soil electrical resistivity standard deviation.
4 Results and Discussion
Our main hypothesis states that the soil electrical variation constitutes a tool for interpreting soil moisture and can be directly related to the contributing areas of the MFD model.
The electrical resistivity spatial variation can be interpreted as soil moisture variation. As Holmgren (1994) considers, the distributed hydrological methods describe spatial soil moisture variation. Through the modelling of MFD and D∞ flow direction algorithms, (Figures 6, 7 and 8), we observe that the highest values of flow accumulation were concentrated in the water lines at the lower part of the hillslope. However, at the middle and top sections of the slope, the MFD algorithm models the internal flow more representative of the main water paths along the soil, consistent with field observations
Figure 7: Soil electrical spatial variation at 1.5 meter of depth Figure 6: Soil electrical resistivity spatial variation at 1 meter of depth
5 Conclusion
The present study suggests that ERT is very useful when applied to the characterization of the agricultural terraces, it provides accurate information to terrace characterization, and it can support the representation of the variation of soil moisture. The information on the variation of soil electrical resistivity is essential for the identification of the flow direction algorithms to use in the hydro-geomorphologic analysis and modelling, namely with the riser instability analysis.
The results of our methodology show a strong and positive correlation between the electrical resistivity standard deviation and the average of flow accumulation for the Douro terraced vineyards area. This correlation varies in depth and depends on the flow direction algorithm. Above 1m depth, where the soil is a mobilized due the terraces construction, the D∞ algorithm provides a better correlation. However, in the deepest layers, the performance of the D∞ algorithm decreases relative to MFD, which reveals higher values of correlation.
The identified correlation between contributing areas and electrical resistivity standard deviation demonstrates that the contributing areas algorithms is an important base tool to use on the cartography of soil moisture. We showed that for each soil structure we need to develop a
previous field analysis in order to identify the hydrologic model that better fits for the cartographic representation.
Further data comparing soil electrical resistivity to soil moisture from field monitoring could reduce the uncertainty in the proposed analysis. This methodology is acceptable to the terraced area of the Douro valley region but needs confirmation in other regions with different hydro-geomorphological characteristics.
Acknowledgments: This study was developed under
the I&DT n.º 03495 project – CLOUDMAPPER and was co-financed by the European Regional Development Fund of the European Union (ERDF) through Portugal 2020 (P2020) under the Operational Competitiveness and Internationalization program (COMPETE 2020).
References
Akgun A., Erkan O., Landslide susceptibility mapping by
geographical information system-based multivariate statistical and deterministic models: in an artificial reservoir area at Northern Turkey. Arabian Journal of Geosciences, 2016, 9(2), 1-15, DOI: 10.1007/s12517-015-2142-7
Aristizábal E., García E., Martínez C., Susceptibility assessment of shallow landslides triggered by rainfall in tropical basins and
mountainous terrains. Natural Hazards, 2015, 78(1), 621-634, DOI: 10.1007/s11069-015-1736-4
Braga A.C.D.O., Malagutti Filho W., Dourado J.C., Resistity (DC) method applied to aquifer protection studies. Revista Brasileira de Geofísica, 2006, 24(4), 573-581
Brillante L., Mathieu O., Bois B., van Leeuwen C., Lévêque J., The use of soil electrical resistivity to monitor plant and soil water relationships in vineyards. Soil, 2015, 1, 273-286, DOI: 10.5194/soil-1-273-2015
Brunet P., Clément R., Bouvier C., Monitoring soil water content and deficit using Electrical Resistivity Tomography (ERT) – A case study in the Cevennes area, France. Journal of Hydrology, 2010, 380, 146–153, DOI: 10.1016/j.jhydrol.2009.10.032
Calamita G., Brocca L., Perrone L., Piscitelli S., Lapenna V., Melone F., Moramarco T., Electrical resistivity and TDR methods for soil moisture estimation in Italy test-sites. Journal of Hydrology, 2012, 454–455, 101–112, DOI: 10.1016/j.jhydrol.2012.06.001 Chambers J.E., Gunn D.A., Wilkinson P.B., Ogilvy R.D., Ghataora
G.S., Burrow M.P.N., Tilden Smith R., Non-invasive time-lapse imaging of moisture content changes in earth embankments using electrical resistivity tomography (ERT). In Ed. Ellis E, Yu HS, McDowell G, Dawson A., Thom N, editors. Advances in Transportation Geotechnics. Proc. 1st int. conf. transportation geotechnics, Nottingham, 2008, 475-480
Chen L., Yin Z., Zhang P., Relationship of resistivity with water content and fissures of unsaturated expansive soils. Journal of China University of Mining and Technology, 2007, 17(4), 537–540, DOI: http://dx.doi.org/10.1016/ S1006-1266(07)60141-2
Claessens L., Heuvelink G.B.M., Schoorl J.M., Veldkamp A., DEM resolution effects on shallow landslide hazard and soil redistribution modelling. Earth Surface Processes and Landforms, 2005, 30, 461-477, DOI: 10.1002/esp.1155 Costa‐Cabral M.C., Burges S.J., Digital elevation model networks
(DEMON): A model of flow over hillslopes for computation of contributing and dispersal areas. Water resources research, 1994, 30(6), 1681-1692, DOI: 10.1029/93WR03512 Dafonte J.D., Raposo J.R., Valcárcel M., Fandiño M., Martínez E.M.,
Rey B.J., Cancela J.J., Utilización de la tomografía eléctrica resistiva para estimar el contenido de agua en el suelo en viña bajo diferentes sistemas de riego. Estudios en la Zona No Saturada del Suelo, Vol. XI - ZNS’13. Universidade de Santiago de Compostela, 2013, 55-67
Dietrich W., Montgomery D., SHALSTAB: a digital terrain model for mapping shallow landslide potential. National Council of the Paper Industry for Air and Stream Improvement (NCASI) Technical Report, 1998, 26 p
Erskine R.H., Green T.R., Ramirez J.A., MacDonald L.H., Comparison of grid-based algorithms for computing upslope contributing area. Water Resources Research, 2006, 34, WR09416, DOI: 10.1029/2005WR004648
FAO-ISSS-ISRIC, World reference base for soil resources. A framework for international classification correlation and communication. Roma, 2006, 71-72
Faria A., Bateira C., Soares L., Fernandes J., Gonçalves J., Marques F., Landslide susceptibility evaluation on agricultural terraces of Douro Valley (Portugal), using physically based mathematical models. European General Assembly, Geophysical Research Abstracts, 2016, 18, DOI: EGU2016-17801
Fernandes J., Bateira C., Soares L., Faria A., Oliveira A, Hermenegildo C., Moura C., Gonçalves J., SIMWE model application on susceptbility anlysis to bank gully erosion in Alto Douro Wine Region agriculture terraces. Catena, 2017, 153, 39-49, DOI: https://doi.org/10.1016/j.catena.2017.01.034
Friedel S., Thielen A., Springman S.M., Investigation of a slope endangered by rainfall-induced landslides using 3D resistivity tomography and geotechnical testing. Journal of Apllied Geophysics, 2006, 60, 100-114, DOI: http://dx.doi. org/10.1016/j.jappgeo.2006.01.001
Friedman S.P., Soil properties influencing apparent electrical conductivity: A review. Comput. Electron. Agr., 2005, 46, 45-70, DOI: http://dx.doi.org/10.1016/j.compag.2004.11.001
García-Tomillo A., Figueiredo T., Dafonte J.D., Almeida.A., Paz-González A., Estudio com tomografía de resistividad elétrica del efecto del tráfico de maquinaria en un suelo agrícola. Estudios en la Zona No Saturada del Suelo, 2015, XII, 1-5, ISBN: 978-84-16133-91-8
Gunn D.A., Chambers J.E., Uhlemann S., Wilkinson P.B., Meldrum P.I., Dijkstra T. A., Hughes P.N., Moisture monitoring in clay embankments using electrical resistivity tomography. Construction and Building
Materials, 2015, 92, 82-94, DOI: http://dx.doi.org/10.1016/j. conbuildmat.2014.06.007
Gunn D.A,, Raines M.G., Chambers J.E., Haslam E., Meldrum P.I., Holyoake S., Kirkham M., Williams G., Ghataora G.S., Burrow M.P.N., Embankment stiffness characterisation using MASW and continuous surface wave methods. In: Proc. 11th int. conf. railway engineering, London, 2011
Habtezion N., Tahmasebi Nasab M., Chu X., How does DEM resolution affect microtopographic characteristics, hydrologic connectivity, and modelling of hydrologic processes? Hydrological Processes, 2016, 30(25), 4870-4892, DOI: 10.1002/hyp.10967
Holmgren P., Multiple flow direction algorithms for runoff modelling in grid based elevation models: an empirical evaluation. Hydrological processes, 1994, 8(4), 327-334 Koch K., Wenninger J., Uhlenbrook S., Bonnel M., Joint interpretation
of hydrological and geophysical data: Electrical resistivity tomography results from a process hydrological research site in the Black Forest Mountains, Germany. Hydrological Processes, 2009, 23, 1501-1513, DOI: 10.1002/hyp.7275
Lea N.L., An aspect driven kinematic routing algorithm, in Overland Flow: Hydraulics and Erosion Mechanics, edited by A. J. Parsons and A.D. Abrahams, Chapman & Hall, New York, 1992
Lesschen J.P., Cammeraat L.H., Nieman T., Erosion and terrace failure due to agricultural land abandonment in a semi-arid environment. Earth Surface Processes and Landforms, 2008, 33, 1574-1584, DOI: 10.1002/esp.1676
Loke M.H., Electrical imaging surveys for environmental and engineering studies. A practical guide to 2-D and 3-D surveys, 1999, pp. 1-2
López‐Vicente M., Navas A., Routing runoff and soil particles in a distributed model with GIS: implications for soil protection in mountain agricultural landscapes. Land Degradation & Development, 2010, 21(2), 100-109, DOI: 10.1002/ldr.901 McCarter W.J., The electrical resistivity characteristics of compacted
clays. Géotechnique, 1984, 34(2), 263-267, DOI: 10.1680/ geot.1984.34.2.263
Michot D., Benderitter Y., Dorigny A., Nicoullaud B., King D., Tabbagh A., Spatial and temporal monitoring of soil water content with an irrigated corn crop cover using surface electrical resistivity tomography. Water Resources Research, 2003, 39(5), 1401–1420, DOI: 10.1029/2002WR001581 Nery T.D., Vieira B.C., Susceptibility to shallow landslides in a
drainage basin in the Serra do Mar, São Paulo, Brazil, predicted using the SINMAP mathematical model. Bulletin of Engineering Geology and the Environment, 2015, 74(2), 369-378, DOI: 0.1007/s10064-014-0622-8
O’Callaghan J.F., Mark D.M., The extraction of drainage networks from digital elevation data. Computer vision, graphics, and image processing, 1984, 28(3), 323-344, DOI: http://dx.doi. org/10.1016/S0734-189X(84)80011-0
Pack R.T., Tarboton D.G., Goodwin C.N., The SINMAP approach to terrain stability mapping. In 8th congress of the international association of engineering geology, Vancouver, British Columbia, Canada, 1998, 21, p. 25
Piegari E., Cataudella V., Di Maio R., Milano L., Nicodemi M., Soldovieri M.G., Electrical resistivity tomography and statistical analysis in landslide modelling: A conceptual approach. Journal of Apllied Geophysics, 2009, 68, 151-158, DOI: http:// dx.doi.org/10.1016/j.jappgeo.2008.10.014
Pozdnyakov A.I., Pozdnyakova L.A., Karpachevskii L.O., Relationship between water tension and electrical resistivity in soils. Eurasian Soil Science, 2006, 39, S78-S83, DOI: 10.1134/ S1064229306130138
Quinn P., Beven K., Chevalier P., Planchon O., The prediction of hillslope flow paths for distributed hydrological modelling using digital terrain models. Hydrological Processes, 1991, 5, 59 – 79, DOI: 10.1002/hyp.3360050106
Rabonza M.L., Felix R.P., Lagmay A.M.F.A., Eco R.N.C., Ortiz I.J.G., Aquino D.T., Shallow landslide susceptibility mapping using high-resolution topography for areas devastated by super typhoon Haiyan. Landslides, 2016, 13(1), 201-210, DOI: 10.1007/s10346-015-0626-x
Robain H., Descloitres M., Ritz M., Atangana Q.Y., A multiscale electrical survey of a lateritic soil system in the rain forest of Cameroon. Journal of Applied. Geophysics, 1996, 34, 237-253, DOI: 10.1016/0926-9851(95)00023-2
Rossi R., Pollice A., Diago M., Oliveira M., Millan B., Bitella G., Amato M., Tardaguila J., Using an automatic resistivity profiler soil sensor on-the-go in precision viticulture. Sensors, 2013, 13, 1121-1136, DOI: 10.3390/s130101121
Samouëlian A., Cousin I., Tabbagh A., Bruand A., Richard G., Electrical resistivity survey in soil science: a review. Soil Tillage Research. 2005, 83, 173-193, DOI: http://dx.doi.org/10.1016/j. still.2004.10.004
Sarkar S., Roy A.K., Raha P., Deterministic approach for suscep-tibility assessment of shallow debris slide in the Darjeeling Himalayas, India. Catena, 2016, 142, 36-46, DOI: http://dx.doi. org/10.1016/j.catena.2016.02.009
Schwartz B.F., Schreiber M.E., Yan T., Quantifying field-scale soil moisture using electrical resistivity imaging. Journal of Hydrology, 32008, 62, 234-246, DOI: http://dx.doi. org/10.1016/j.jhydrol.2008.08.027
Seibert J., McGlynn B.L., A new triangular multiple flow direction algorithm for computing upslope areas from gridded digital elevation models. Water Resources Research, 2007, 43(4), DOI: 10.1029/2006WR005128, 2007
Sousa B., Sequeira A., Geological Report on the Alijó sheet No. 10D (1:50 000). Portuguese Geological Survey, Lisbon, 1989, 59 p. Tarboton D.G., A new method for the determination of flow
directions and upslope areas in grid digital elevation models. Water resources research, 1997, 33(2), 309-319, DOI: 10.1029/96WR03137
Teixeira M., Bateira C., Marques F., Vieira B., Physically based shallow translational landslide susceptibility analysis in Tibo catchment, NW of Portugal. Landslides, 2015, 12(3), 455-468, DOI: 10.1007/s10346-014-0494-9
Werban U., al Hagrey S.A., Rabbel W., Monitoring of root-zone water content in the laboratory by 2D geoelectrical
tomography. Journal of Plant Nutrition and Soil Science, 2008, 171, 927-935, DOI: 10.1002/jpln.200700145. 781.
Yang T.H., Chen Y.C., Chang Y.C., Yang S.C., Ho J.Y., Comparison of different grid cell ordering approaches in a simplified inundation model, Water, 2015, (2), 438-454
Zhang W., Montegomery D.R., Digital elevation model grid size, landscape representation, and hydrologic simulations. Water Resources Research, 1994, 30,(04), 1019-1028, DOI: 10.1029/93WR03553
Zond geophysical software – Program for two-dimensional interpretation of data obtained by resistivity and induced polarization methods, 2016, Retrieved from http://zond-geo. ru/english/zond-software/ert-and-ves/zondres2d