ISSN 0104-6632 Printed in Brazil
www.abeq.org.br/bjche
Vol. 31, No. 04, pp. 905 - 912, October - December, 2014 dx.doi.org/10.1590/0104-6632.20140314s00003038
Brazilian Journal
of Chemical
Engineering
THREE-DIMENSIONAL SIMULATION OF LIQUID
FLOW ON A SIEVE TRAY UNDER DIFFERENT
INCLINATIONS
Zhang Ping
1,2*, Jin Dan
3, Meng Huibo
3and Wu Jianhua
31School of Chemical Engineering and Technology, Tianjin University, Tianjin, 300072, China. 2
College of Mechanical Engineering, Shenyang University of Chemical Technology, Shenyang, 110142, China.
Mobil Phone: 86-015840013416 E-mail: [email protected]
3School of Energy and Power Engineering, Shenyang University of Chemical
Technology, Shenyang, 110142, China.
(Submitted: October 17, 2013 ; Revised: February 17, 2014 ; Accepted: February 22, 2014)
Abstract - The fluid state on a sieve tray will change when the towers tilt under wind loads. A computational fluid dynamics (CFD) model was used to predict the flow patters and hydraulics on the tray under different inclinations. The gas and liquid phases are modelled with the volume-of-fluid (VOF) framework as two inmiscible phases. Several three-dimensional transient simulations were carried out for a 0.38m diameter tray with varying liquid weir loads and inclined angles. The clear liquid height determined from these simulations is in reasonable agreement with experimental measurements carried out for air-water in a round tray of the same dimensions. The simulation results show that, compared with the horizontal tray, the circulation area is bigger when the liquid flow and inclination direction of the tray are the same, but when they are opposite the circulation area is smaller. The percentage of circulation area to the tray area can obviously be decreased, along with increasing liquid weir loads. It is concluded that CFD can be used for the prediction of liquid flow on sieve trays under different inclinations
Keywords:Inclination; Volume of Fluid (VOF) method; Tray; Clear liquid height.
INTRODUCTION
The tray column has been widely used in many chemical separation processes, especially distillation, due to its simple structure, lower cost, and easier enlargement compared with other type towers (Sun et al., 2011). The performance of a large distillation column always suffers from a loss of separation abil-ity due to maldistributed or abnormal flow of the liquid phase on the tray. For example, liquid phase circula-tion, which frequently occurs on a tray, may cause a serious reduction in the Murphree tray efficiency (Yu et al., 1999). Therefore, to accurately predict the tray efficiency, the hydrodynamics of non-uniform flow
on the tray must be considered (Bell and Solari, 1974; Yu et al., 1983). Because the ratio of tower height to diameter is large and the shell of the tower is thin, a greater deflection will occur when the tower is subjected to wind loads. Gas-liquid mass transfer is inhomogeneous due to the deflection, which leads to the decline of tower efficiency (Zhang et al., 2011).
Larson, 1992; Huang et al., 1996) and gas-liquid contact is insufficient. The thick side is prone to weeping and to entrainment for the thin one (Liu and Lu, 1990), which seriously affect tray efficiency. The poor distribution of weeping from a distillation tray and its effect on tray efficiency were discussed by Zeng (2002). The extent of the Murphree tray effi-ciency drop depended chiefly on the degree of inade-quate distribution and the percentage of weeping.
Recently, advances and interest in the use of CFD techniques have be used for the study of fluid dy-namics in process equipment. Zhang and Yu (1994) employed the k-ε two-equations model of CFD for simulating the liquid phase flow pattern on a sieve tray. A single-pass sieve distillation tray was simu-lated with a three-dimensional CFD program with the k-ε turbulence model and a source term
i
M
S was
formulated in the Navier-Stokes equations to repre-sent the interfacial momentum transfer (Liu and Liu, 2002). The volume-of-fluid (VOF) technique can be used for a priori determination of the morphology and rise characteristics of single bubbles rising in a liquid (Krishna et al., 1999). A three-dimensional two-phase flow model based on the VOF method for simulating the hydrodynamics and mass-transfer be-havior in a typical representative unit of the struc-tured packing is developed (Chen et al., 2009). Some prior research on gas–liquid flow on a distillation tray using CFD techniques can be mentioned (Buwa and Ranade, 2003; Gesit et al., 2003).
In this paper a three-dimensional transient CFD model is developed, within the two-phase VOF frame-work, to describe the hydrodynamics on a 0.38 m diameter sieve tray under different inclinations. Simulations have been carried out with varying liquid weir loads and incline angles. The results of the simulation are compared with experimental data generated for the air-water column. The objective of this work is to examine the extent to which CFD models can be used as a research tool for the trays under different inclinations.
EXPERIMENTAL SET-UP
The experimental set-up, shown in Figure 1, con-sists of four circular plates without holes and a liquid distribution device. The parameters of the tray and experiment are given in Table 1. The first plate is not the experimental plate but rather the two middle plates in order to eliminate the non-uniformity of water. The liquid from the water tank (8) was fed to the plate (4) by a liquid pump (1).The liquid flow rate was measured by a calibrated liquid flowmeter (3). By the adjustment of screw (7), the inclination angle of the tray could be adjusted. For a specified set of working conditions, the clear liquid height on the tray (5) was measured with two graduated scales attached to the wall of the inlet and outlet weir, respectively.
1. liquid pump; 2. valve;
3. liquid flowmeter;
4. tray (to obtain stable flow); 5. tray (experiment);
6. plate;
7. adjustment screw; 8. storage tank for liquid.
Figure 1: Experimental apparatus
Table 1: The parameters of tray and experiment.
parameters value parameters value
CFD MODEL DEVELOPMENTS
Mechanical Model
The tower will incline due to the wind loads when it is in operation. Liquid flow distribution on the tray is shown in Figure 2 and indicates that the liquid flow direction and tilt direction of the tower are the same for the ith tray and contrary for the (i-1)th tray. θi is the inclination angle of the ith tray.
Figure 2: Liquid flow distributions on the tray
Mathematical Model
The VOF method is an effective approach for tracking the free surface. The fields of all variables and properties are shared by all the phases. Thus, the variables and properties in any given cell are either pure representatives of one of the phases, or repre-sentative of a mixture of all the phases, depending upon the volume fraction values. The tracking of the interface between the phases is accomplished by the solution of a continuity equation for the volume fraction of one (or more) of the phases (Hong, 2003). For the qth phase, the equation can be written
( ) 0
q i q
i u t x α α ∂ ∂ + =
∂ ∂ (1)
In each control volume, the volume fraction sum of all phases is equal to 1.
1 1 n q q α = =
∑
(2)Mass and momentum conservation equations are given by: ( ) 0 i i u t x ρ ρ ∂ ∂ + =
∂ ∂ (3)
( )
( )
( )
i j
i i
j i j j
u u
u p u
t x x x x
ρ
ρ ∂ μ
∂ + = −∂ + ∂ ∂ +
∂ ∂ ∂ ∂ ∂ F (4)
The momentum conservation equation is enclosed by means of the k-ε mode1.
The transport equation for k is:
( )
( ) i e
i i k i
u k
k k
G
t x x x
ρ μ
ρ μ ρε
σ
⎡⎛ ⎞ ⎤
∂
∂ + = ∂ + ∂ + −
⎢⎜ ⎟ ⎥
∂ ∂ ∂ ⎢⎣⎝ ⎠∂ ⎥⎦ (5)
The transport equation for ε is:
1 2
( ) ( )
( )
i e
i i i
u
t x x x
C G C k ⎡⎛ ⎞ ⎤ ∂ ∂ + = ∂ + ∂ ⎢⎜ ⎟ ⎥ ∂ ∂ ∂ ⎣⎝ ⎠∂ ⎦ + − ε
ρ ε μ
ρε μ ε
σ ε ε
(6)
where, μeis the turbulent viscosity:
2
e
k Cμ
μ ρ= ε (7)
( i j) i e
j i j
u
u u
G
x x x
μ ∂ ∂ ∂
= +
∂ ∂ ∂ (8)
In the VOF framework, a single momentum equa-tion is solved throughout the domain, and the result-ing velocity field is shared among the phases. The equation, as originally stated, depends on the volume fractions of all phases through ρ and μ, as shown in Equation (9). F is body force on the control ele-ment and only acted upon by gravity.
1 1
,
n n
q q q q
q q
ρ α ρ μ α μ
= =
=∑ =∑ (9)
where the constants are taken from the literature (Launder, 1989), as follows:
1 1.44
C = ,C2=1.92,Cμ=0.09,σ =k 1.0, σ =ε 1.3
velocity inlet
weir pressure out
wall wall
front+back:wall wall
x y z
Figure 3: Computational space used in the CFD
simulations
A commercial CFD package FLUENT was used to solve the equations of continuity and momentum for the two-fluid mixture. There is a finite volume solver in this package, using body-fitted grids. Grid cells of 5 mm size are used in the x-, y- and z- directions based on the experience gained in the modelling of gas-liquid bubble columns operating in the churn-turbulent regime (Krishna et al., 1999; Van Baten and Krishna, 2000). The chosen grid size of 5 mm is smaller than the smallest grid used in an earlier study (Hirt and Nichols, 1981), where the grid convergence was satisfied. The boundary conditions and simulation parameters are shown in Table 2.
Table 2: The boundary conditions and simulation parameters.
content parameters content parameters
liquid inlet velocity-inlet liquid outlet pressure-out
gas outlet pressure-out liquid load per unit weir length /m3·s-1·m-1
1.08, 1.62, 2.16, 2.7
inclination angle/°
0, 1, 2, 3, 4 time increment /s
10-4∼ 10-3
Air and water were used as the gas and liquid phases, respectively. At the start of a simulation, the tray configuration shown in Figure 3 is filled with gas phase only. A shorter time-step was set to obtain a better simulation result (Tao, 2008). The step size can then be increased when there is a good conver-gence in the simulation. The time increment used in the simulations was from 10-4 s to 10-3 s. The pressure– velocity coupling was obtained using the PISO algo-rithm. During the simulation, the volume fraction of the liquid phase in the gas–liquid dispersion in the system was monitored. A transient simulation was supposed to converge whenever there was no ap-preciable change with time of the volume fraction of the liquid. Although many of the simulations were
inherently transient, an averaged parameter, the vol-ume fraction of the liquid, can be obtained, as seen in Figure 4. Typically, the steady state is achieved in about 10 s from the start of liquid flow. It took about 2 days to simulate 20 s of an inclination tray. For obtaining the clear liquid height, the parameter values are averaged over a sufficiently long period in which the volume fraction of the liquid phase re-mains steady.
0 5 10 15 20 25 30
0 5 10 15 20 25 30
the
vol
um
n fr
ac
ti
on of
t
he
l
iqui
d /
%
liquid flow time/s
Figure 4: Changing curve of flow time with volume
fraction
(hw=40 mm, QL/lW =2.7×10⁻³ m3·s-1·m-1, θ=2°)
RESULTS AND ANALYSIS OF THE SIMULATION
Simulation Results
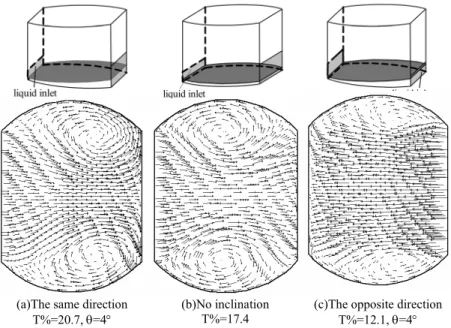
The flow field of a 1.2m diameter tray was made by using a tracer, and the results show that there is the district of the main flow and circulation flow (Porter et al., 1972). The circulation flow is recon-structed in our simulation. The fraction of circulation area of the tray is defined by Equation (10).
% N x
T N
−
= (10)
circulation area is maximum in 3 cases, but the circumfluence center is towards the inlet and the fraction of circulation area is minimum in the 3 cases in Figure 5(c).
Figure 6 presents the flow field distribution of the tray in the z=0.02 m plane with inclinations of 2° and
4°, respectively. When the tilt of tray and the liquid flow have the same direction, with increasing incli-nation of the tray, the area of circulation increases. When the direction is opposite, the area of circula-tion will show a decreasing trend with increasing inclination of the tray.
(a)The same direction T%=20.7, θ=4°
(b)No inclination T%=17.4
(c)The opposite direction T%=12.1, θ=4°
Figure 5: Liquid velocity distribution along the z direction
(hw=40 mm, QL/lW =1.08×10
-3
m3·s-1·m-1, z=0.02m)
Figure 6: Flow field distribution along the z direction under different inclination
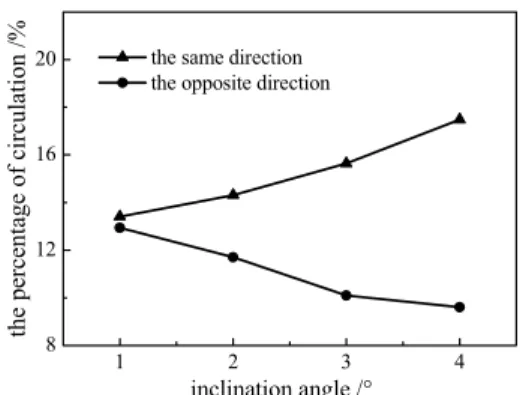
The variation of the circulation area with inclina-tion angle is given in Figure 7. The percentages of circulation from the simulations are obtained after averaging 10 s of flow time once quasi-steady-state conditions were established.
1 2 3 4
8 12 16 20
the
p
erc
ent
age
of
c
ir
cul
at
io
n /
%
inclination angle /° the same direction the opposite direction
Figure 7: The fraction of circulation as a function of
inclination angle
(hw=40 mm, QL/lW =2.7×10
-3
m3·s-1·m-1, z=0.02m) The percentage of circulation area on the tray in the z direction is shown in Figure 8. The percentages of circulation from the simulations are obtained after averaging 10 s of flow time once quasi-steady-state conditions were established. The circulation area tends to increase gradually from z=0.02 m to z=0.03 m, especially for z=0.03 m. The increase in rate from z=0.03 m to z=0.04 m is twice that from z=0.02 m to z=0.03 m. It can be attributed to the existence of a diffuse interface from z=0.03 m to z=0.04 m.
15 20 25 30 35 40
8 12 16 20
the
pe
rc
ent
ange
of
ci
rc
ul
at
ion/
%
distance along z,mm the opposite direction no inclination the same direction
Figure 8: The fraction of circulation along the z
di-rection
(hw=40 mm, QL/lW =2.16×10⁻³ m3·s-1·m-1,θ=2°)
As can be seen from Figure 9, independent of whether the liquid flow and inclination of tray have the opposite or the same direction, the percentage of
circulation area decreases as the liquid weir loads increase, although that of the same direction de-creased more rapidly. The circulation percentages from the simulations were obtained after averaging 10 s of flow time once quasi-steady-state conditions were established. The liquid acquires a greater mo-mentum in the primary flow direction with increas-ing liquid weir load, so the circulation areas are reduced.
0.8 1.2 1.6 2.0 2.4 2.8 8
12 16 20 24
Liquid load per unit weir length/10-3⋅m3⋅s-1⋅m-1
the
pe
rc
en
ta
ge
of c
irc
ul
at
ion a
era
/%
the opposite direction(i-1th tray) the same direction(ith tray)
Figure 9: The fraction of circulation as a function of
the liquid weir load
(hw=40 mm,z=0.02m,θ=2°)
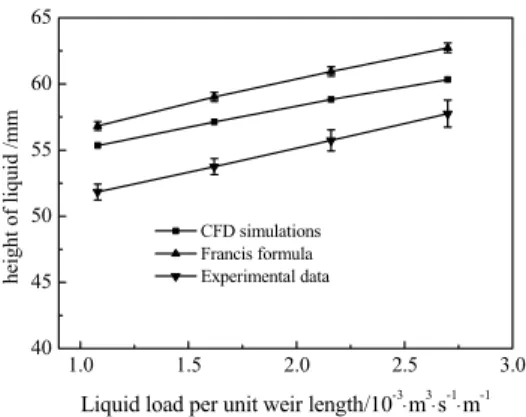
CFD Simulations vs. Experiments
The comparisons for the clear liquid height with varying liquid weir loads between the experimental data, the simulation results from CFD, and the Francis formula, Equation (11), are shown in Figure 10.
2 3 2.84
( ) 1000
L
L W
W
Q
h h E
l
= + (11)
The value of E in Equation (11) is determined by Equation (12):
2.5 1 [0.00012 0.00386ln( w)] L
w
l Q
E
D l
= + − (12)
experimental results. The calculated results might be useful for simplifying the tray simulation and evalu-ating the tray efficiency under different inclination.
1.0 1.5 2.0 2.5 3.0
40 45 50 55 60 65
Liquid load per unit weir length/10-3⋅m3⋅s-1⋅m-1
h
ei
g
ht
o
f
li
qu
id
/
m
m
CFD simulations Francis formula Experimental data
(a) Flow of liquid and tilt of tray in the opposite di-rection
1.0 1.5 2.0 2.5 3.0
30 35 40 45 50
h
ei
g
ht
o
f l
iqu
id
/
m
m
Liquid load per unit weir length/10-3⋅m3⋅s-1⋅m-1 Experiment data
CFD simulations Francis formula
(b) Flow of liquid and tilt of tray in the same di-rection
Figure 10: Comparison of CFD simulations with
experimental data and the Francis formula (hw=0.04 m, θ=2°)
CONCLUSIONS
A transient three-dimensional CFD model has been developed for simulating the liquid phase flow on a sieve tray under wind loads. The gas and liquid phases are modeled within the VOF framework. The predictions of the clear liquid height and liquid volume fraction from the CFD simulations show the right trend with varying liquid weir loads. The per-centages of circulation area to total tray area along the z direction with varying inclination angle were obtained. Compared with the horizontal tray, the circulation area is bigger when the liquid flow and
the inclination of the tray are in the same direction, but when direction is the opposite, the circulation area is smaller. Moreover, it increases with increas-ing inclination angle when the direction of the liquid flow and inclination of tray are same. The circulation area is smaller when the direction is the opposite. There is an obvious enlargement of the fraction of the circulation area when the height is over the inlet in the z direction.
ACKOWLEDGMENTS
This work was supported by the National Natural Science Foundation of China (Nos.21476142, 21306115 and 21106086), the Program for Liaoning Excellent Talents in University (No.LJQ2012035), the Science Foundation for doctorate Research of the Liaoning Science and Technology Bureau of China (No.20131090), the Science and Technology Research Project of Education Department of Liaoning province (No.L2013164).
NOMENCLATURE
1 2
, ,
C C Cμ model constants
E Liquid expansion coefficient
F body force N/m3
L
h clear liquid height m
W
h weir height m
k turbulent kinetic energy m2·s-2
W
l length of the weir m
x
N− nodes of negative ux in the
z-plane
N the whole nodes in the
z-plane
p pressure Pa
L
Q liquid loads m3·s-1
t time s
u velocity m·s-1
, ,
x y z coordinate
Greek Letters
α volume fraction of phase
ε turbulent dissipation m2·s-3
μ viscosity of phase Pa·s
e
μ effective viscosity m2·s-1
θ inclination angle of tray
ρ density of phase kg·m-3
,
k ε
Subscripts
q the qth phase
,
i j co-ordinate index
REFERENCES
Bell, R. L., Solari, R. B., Effect of Nonuniform velocity fields and retrograde flow on distillation tray efficiency. AIChE Journal, 20(4), 688-695 (1974).
Buwa, V. V., Ranade, V. V., Dynamics of gas-liquid flow in a rectangular bubble column: Experiments and single/multi-group CFD simulations. Chem. Eng. Sci., 57(22), 4715-4736 (2002).
Chen, J. B., Liu, C. J., Yuan, X. G., CFD Simulation of flow and mass transfer in structured packing distillation columns. Chinese Journal of Chemical Engineering, 17(3), 381-388 (2009).
Gesit, G., Nandakumar, K., Chuang, K. T., CFD modeling of flow and hydraulics of commer-cial-scale sieve trays. AIChE Journal, 49(4), 910- 924 (2003).
Hirt, C. W., Nichols, B. D., Volume of fluid (VOF) method for the dynamics of free boundaries. Jour-nal of ComputatioJour-nal Physics, 39(1), 201-225 (1981).
Hong, R. Y., Numerical study of pinching liquid fila-ment using VOF method. Chinese Journal of Chemical Engineering, 11(5), 542-549 (2003). Huang, J., Song, H.H., Liu, F. S., Liquid Channelling
and its effect on plate efficiency. Journal of Chemical Industry and Engineering, 47(3), 311- 315 (1996).
Launder, B. E., 2nd-moment closure and its use in modeling turbulent industrial flows. International Journal for Numerical Methods in Fluids, 9(8), 963-985 (1989).
Kister, H. Z., Larson, K. F., Madsen, P. E., Vapor cross flow channeling on sieve trays, fact or myth. Chem. Eng. Prog., 88(11), 86-93 (1992).
Krishna, R., Urseanu, M. I., Van Baten, J. M. and Ellenberger, J., Rise velocity of a swarm of large gas bubbles in liquids. Chem. Eng. Sci., 54(2), 171-183 (1999).
Krishna, R., Van Baten, J. M., Ellenberger, J., Higler, A. P., Taylor, R., CFD simulations of sieve tray hydrodynamics. Chemical Engineering Research and Design, 77(7), 639-646 (1999).
Liu, B. T., Liu, C. J., Three dimensional simulation of liquid flow on distillation tray. Chinese Journal of Chemical Engineering, 10(5), 517-521 (2002). Liu, X. N., Lu, X. L., Effect of entrainment on tray
efficiency of distillation columns. Journal of Chemical Industry and Engineering, 41(5), 762- 767 (1990).
Porter, K. E., Locket M. J., Lim C. T., The effect of liquid channeling on distillation plate efficiency. Trans. Instn. Chem. Engr., 50(2), 91-101 (1972). Sun, Z. M., Liu, C. J., Yu, K. T., Yuan, X. G.,
Predic-tion of distillaPredic-tion column performance by com-putational mass transfer method. Chinese Journal of Chemical Engineering, 19(5), 833-844 (2011). Tao, W. Q., Numerical Heat Transfer. (2nd Ed.),
Xi’an Jiao Tong University Press, 104-105 (2008). Van Baten, J. M., Krishna, R., Modelling sieve tray
hydraulics using computational fluid dynamics. Chemical Engineering Journal, 77(3), 143-151 (2000).
Wang, Y. L., Computational problems of clear liquid height on the weir. Chemical World, 2, 82-84 (1990).
Yu, K. T., Yuan, X. G., You, X. Y., Liu, C. J., Compu-tational fluid-dynamics and experimental veri-fication of two-phase two-dimensional flow on a sieve column tray. Chemical Engineering Research and Design, 77(6), 554-560 (1999).
Yu, K. T., Huang, J., Gu, F. Z., Simulation and effi-ciency of large tray (i)-eddy diffusion model with non-uniform liquid velocity field. Chinese Jour-nal of Chemical Engineering, 2, 12-20 (1983). Zeng, A. W., Mal-distribution of weeping from a
distillation tray and its effect on tray efficiency. Chinese Journal of Chemical Engineering, 10(5), 508-516 (2002).
Zhang, P., Wang, C. H., Wu, J. H., Calculation of top deflection of tray column under working condi-tions. Chemical Engineering, 39(8), 37-39 (2011). Zhang, M. Q., Yu, K. T., Simulation of two