Effect of dietary
phospholipids and
docosahexaenoic acid in
growth performance, lipid
profile and oxidative
stress
in Meagre (Argyrosomus
regius) juveniles
Maria João Magalhães de Almeida Xavier
Mestrado em Recursos Biológicos Aquáticos
Biologia da FCUP 2014/2015
Supervisor
Prof. Doutor Pedro Pousão, Investigador Auxiliar, EPPO
Co-Supervisor
Prof. Doutor Aires Oliva-Teles, Professor Catedrático, FCUP
Todas as correções determinadas pelo júri, e só essas, foram efetuadas.
O Presidente do Júri, Porto, /_ /
Acknowledgments
I would like express my gratitude to my supervisor, Dr. Pedro Ferreira Pousão for the opportunity to work in the Olhão Aquaculture Research Station. For guiding me throughout the work of this dissertation and for all the support given and knowledge shared over this last year.
A very special thanks to my co-supervisor Prof. Dr. Aires Oliva-Teles for his excellent guidance throughout this work. His immense scientific knowledge was an incentive to go further on and essential for the accomplishment of this dissertation.
Thanks to the Dra. Narcisa Bandarra (L-IPMA/INRB, IP) for accepting me at IPMA
laboratory and to guide me.
To Dr. Jorge Dias and SPAROS Ltd, for the supply of diets used in this study, and their critical view have also contributed to the establishment of this research.
I am especially grateful to all the members of EPPO for receiving me and providing me a stimulating and fun environment in which I had the opportunity to learn and grow. In particular to Ana Mendes for having guided me during the practical work. I would like to extend my thanks to Sara Costa for the entire accessibility and affection that has always shown. Throughout the time spent and for what taught me the laboratory level.
A heartfelt thanks to all the members of Nutrimo laboratory and the Marine Zoology Station, for their help and friendship. Especially to Carolina Castro that taught me so much and spent the time to accompany me.
To pilot project meagre cultivation in several production systems - "AQUACOR". PROMAR 31-03-05FEP-003
All my dear friends that were always present when I needed the most. A sincere thank you to Sofia Abrunheiro, Filipe Silva, Luis Esteves and Diana Moura for the work they have put in the review of this document.
Last and most especially I would like to express my gratitude to my family who have always supported and encouraged me as well as for the unconditional love.
Abstract
Meagre (Argyrosomus regius, Asso, 1801) is a new species within in the Mediterranean aquaculture industry and introduced to diversify the number of cultured species. Meagre flesh is characterized by a high protein and low lipid content, having a recommended nutritional quality. Moreover, it exhibit a high content of polyunsaturated fatty acids (PUFA), mainly represented by a high proportion of n-3 PUFA, whose importance for human health, has been continuously increasing in the last decades. These fatty acids (FA) are essential nutrients with a variety of important structural, functional and signaling roles. Furthermore, highly unsaturated fatty acid (HUFA) the phospholipids (PL) requirement has been documented to be essential nutrients for larval and juvenile marine fish in regulation of a wide range of cellular functions.
The present study was therefore designed and carried out to investigate the effects of increased levels of PL (1.0 to 4.0 %) and docosahexaenoic acid (DHA) (1.0 to 2.0%) on the diet (at a constant lipid, protein and starch level), in growth performance, fatty acid and lipid class composition of different organs and oxidative state of meagre juveniles was also evaluated.
For that purpose, a total of 1800 juveniles, with mean initial weight 13.8± 2.0g, were randomly assigned into 12 tanks, to perform analysis in triplicate for the 4 treatments (diet A, B, C and D), fed, ad libitum, three times a day for 81 days.
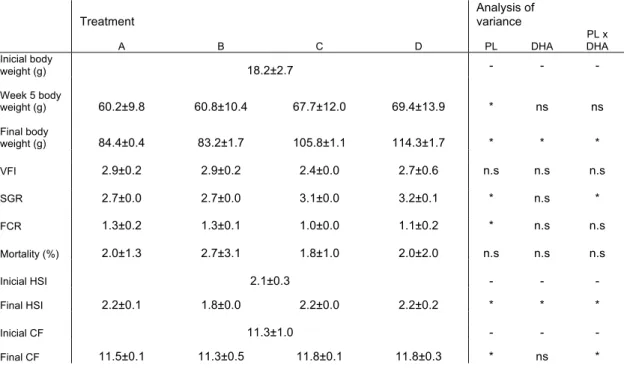
Results showed that dietary enrichment of PL and DHA didn’t exert any influence in the survival rate of juveniles of meagre. In terms of growth performance, specific growth rate (SGR) and final body wet weight (FBW) were increased with the combination of 4.0% PL and 2.0% DHA in the diet and the feed conversion ratio (FCR) showed best results with higher PL percentage in the diet.
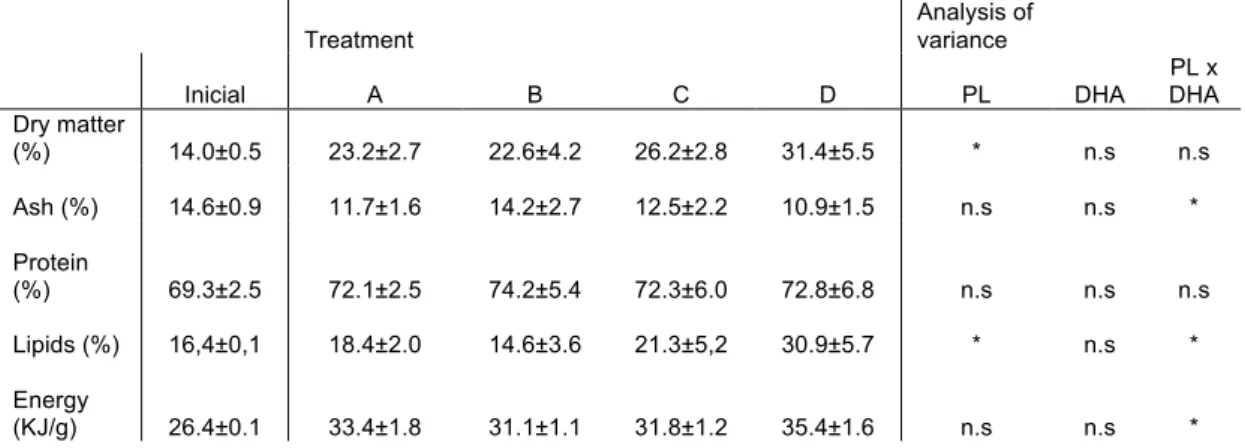
The use of 4.0% PL and 2.0% DHA diet promoted whole-body lipid retention as well as higher energy content.
FA composition in the analyzed organs were correlated to the used diet. Therefore, increasing DHA concentration in the diet resulted in a higher accumulation of DHA in body tissues. DHA tissue distribution showed a higher accumulation in the brain than in muscle or liver.
Finally, regarding the liver oxidative status, the liver lipid peroxidation levels observed were similar in all diet treatments applied on this study. However, in diets with higher PL percentage the activity of superoxide dismutase (SOD) and glucose-6-phosphate dehydrogenase (G6PDH) was significantly increased.
In conclusion, this work showed that juveniles of meagre achieve an increasing growth performance with an increase of 4.0% of PL in the diet. The increasing DHA concentration in diet led to a higher retention of this essential FA in the muscle. No major changes were also observed in lipid peroxidation levels related to an increase of PL and DHA in the diet.
Keywords: Argyrosomus regius; Growth performance; Polyunsaturated Fatty Acids;
Docosahexaenoic acid; Phospholipids; Oxidative stress; Fatty acid composition.
Resumo
Corvina (Argyrosomus regius, Asso, 1801) é uma nova espécie dentro da indústria da aquicultura do Mediterrâneo, introduzida para diversificar o número de espécies cultivadas. A qualidade nutricional da corvina é considerada muito boa, caracterizada por um elevado teor de proteínas e baixo teor de lipídios. Além disso, apresenta um elevado teor de ácidos gordos polinsaturados (PUFA), representado, principalmente, por uma alta proporção de n-3 PUFA, cuja atenção tem aumentado continuamente durante as últimas décadas para a saúde humana. Estes ácidos gordos (FA) são nutrientes essenciais com uma variedade de papéis importantes a nível estrutural, funcional e de sinalização. Tal como estes ácidos gordos polinsaturados (HUFA) os requisitos de fosfolípidos (PL) têm sido documentados como sendo nutrientes essenciais para larvas e juvenis de peixes marinhos ao nível da regulação de uma vasta gama de funções celulares.
O presente estudo foi, por conseguinte, concebido e realizado para investigar os efeitos do aumento dos níveis dietéticos de PL (1,0 a 4,0%) e ácido docosahexanóico (DHA) (1,0 a 2,0%), com um nível de lípidos, proteínas e energia constantes, no desempenho do crescimento. Também se avaliou o perfil dos ácidos gordos e a classe de lípidos dos diferentes órgãos e estado oxidativo dos juvenis de corvina.
Para esse objetivo, um total de 1800 juvenis, com peso médio inicial 13,8± 2,0g, foram distribuídos ao acaso por 12 tanques, de forma a ter triplicados para os 4 diferentes tratamentos (dietas A, B, C e D) alimentados, ad libitum, três vezes ao dia durante um período de 81 dias.
Os resultados mostraram que aumento de PL e DHA nas dietas não exerce qualquer influência na taxa de sobrevivência dos juvenis de corvina. Quanto à performance de crescimento, a taxa de crescimento específica e peso médio final obtiveram um aumento com a combinação de 4,0% PL e 2,0% DHA na dieta e a taxa de conversão alimentar mostrou melhores resultados com maior percentagem de fosfolípidos na dieta.
A dieta com concentração de 4,0% de PL e 2,0% de DHA promoveu uma retenção de lípidos no corpo inteiro, assim como um conteúdo energético mais elevado.
A composição de FA nos órgãos analisados refletiu a suplementação da dieta aplicada. Assim, o aumento da concentração de DHA na dieta resultou numa maior acumulação de DHA nos tecidos corporais analisados. A distribuição de DHA nos tecidos mostrou uma acumulação mais elevada no cérebro quando comparado com o tecido muscular e hepático.
Finalmente, em relação ao estado oxidativo do fígado, os níveis verificados de peroxidação lipídica no fígado foram semelhantes em todos os tratamentos dietéticos implementados no presente estudo. Contudo, nas dietas com maior percentagem de PL a superóxido dismutase (SOD) e a glucose-6-phosphate desidrogenase (G6PDH) mostrou uma maior atividade.
Em conclusão, os resultados deste trabalho mostram que os juvenis de corvina obtiveram um aumento no desempenho de crescimento com um aumento de 4,0% de PL na dieta. O aumento da concentração de DHA na dieta induziu uma maior retenção deste FA no tecido muscular. Não foram observadas grandes alterações nos níveis de peroxidação lipídica em relação ao aumento de PL e DHA na dieta.
Palavras-chave: Argyrosomus regius; Performance de crescimento; Ácidos gordos
polinsaturados; Ácido docosahexanóico; Fosfolípidos; Stress oxidativo; Composição de ácidos gordos.
Index
1- INTRODUCTION ... 1
1.1- State of Aquaculture ... 1 1.2- Meagre ... 2 1.3- Meagre Aquaculture ... 3 1.4- Fish Nutrition ... 5 1.5- Lipids ... 7 1.6- Fatty acids ... 8 1.7- Phospholipids ... 11 1.8- Oxidative Stress ... 12 1.9- Objectives ... 142- MATERIAL AND METHODS ... 15
2.1- Diets ... 15 2.2- Experimental conditions ... 17 2.3- Sampling ... 17 2.4- Analytical Methods ... 18 2.4.1- Zootechnical parameters ... 18 2.4.2- Proximate analysis ... 18 2.4.3- Tissue lipids ... 19 2.4.3.1- Lipid classes ... 19 2.4.3.2- Fatty-acids ... 19 2.4.4- Oxidative stress ... 20 2.5- Statistical analysis ... 22
3- RESULTS ... 23
3.1- Diet composition ... 23 3.2- Growth trial ... 24 3.3- Whole-body composition ... 25 3.4- Lipid composition ... 26 3.5- Oxidative Stress ... 374- DISCUSSION ... 38
4.1- Conclusion ... 44
5- REFERENCES ... 46
Figure Index
FIGURE 1: FISHERY PRODUCTION IN LIVE WEIGHT EQUIVALENT FOR AQUACULTURE (LEFT) AND CAPTURE (RIGHT). SOURCE: OECD AND FAO SECRETARIATS, 2014. ... 2
FIGURE 2: MEAGRE (ARGYROSOMUS REGIUS, ASSO, 1801) SOURCE: IRIDA’S
RESEARCH FOR MEAGRE CULTURE ... 3
FIGURE 3: GLOBAL PRODUCTION OF FISHMEAL AND FISH OIL. SOURCE: FAO, 2014 ... 7
FIGURE 4: THE METABOLIC PATHWAYS BY WHICH ESSENTIAL FATTY ACIDS ARE CONVERTED TO LONGER CHAIN, MORE UNSATURATED DERIVATIVES.
SOURCE: NARAYAN ET AL., 2015 ... 9
FIGURE 5: PATHWAYS OF CONVERSION OF ARAQUIDONIC ACID 20:4 (N-6) AND EICOSAPENTAENOIC ACID 20:5 (N-3) TO EICOSANOIDS. SOUCE: LALL, 2000 ... 10
FIGURE 6: VARIATION OF DIFFERENT FATTY ACIDS EICOSAPENTAENOIC ACID (EPA), DOCOSAHEXAENOIC ACID (DHA), ARACHIDONIC ACID (ARA), TOTAL
SATURATED FATTY ACID (ΣSFA), TOTAL MONOUNSATURATED FATTY ACID (ΣMUFA) AND TOTAL POLYUNSATURETED FATTY ACID (ΣPUFA) IN THE LIVER, BRAIN AND MUSCLE (IN MG/G) OF ARGYROSOMUS REGIUS FED THE
EXPERIMENTAL DIETS. RESULTS FROM TWO WAY ANOVA ARE REFLECTED; ASTERISKS INDICATE SIGNIFICANT DIFFERENCES AS *P<0.05; N.S. INDICATES NON SIGNIFICANT DIFFERENCES. ... 33
FIGURE 7: VARIATION OF DIFFERENT LIPID CLASS, TRIACYLGLYCEROLS (TAG); FREE FATTY ACIDS (FFA); CHOLESTEROL (CH); DIACYLGLYCEROL (DAG); MONOACYLGLYCEROL (MAG); PHOSPHOLIPIDS (PL), IN THE LIVER, BRAIN AND MUSCLE (IN %) OF ARGYROSOMUS REGIUS FED THE EXPERIMENTAL DIETS. RESULTS FROM TWO WAY ANOVA ARE REFLECTED ASTERISKS INDICATE SIGNIFICANT DIFFERENCES AS *P<0.05; N.S. INDICATES NON SIGNIFICANT DIFFERENCES. ... 36
Table Index
TABLE 1: FORMULATION OF EXPERIMENTAL DIETS. ... 16
TABLE 2: FATTY ACID COMPOSITION OF THE DIFFERENT EXPERIMENTAL DIETS (RESULTS IN % AND MG/G FATTY ACID) ... 23
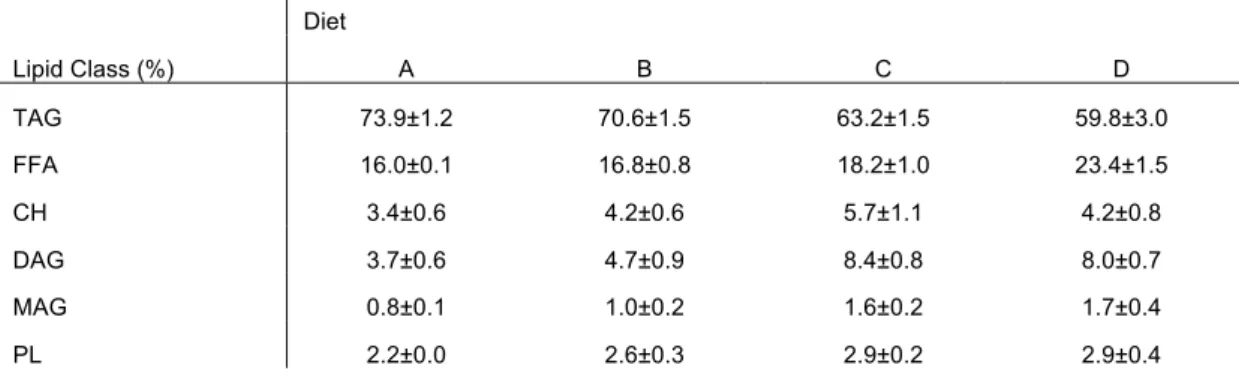
TABLE 3: LIPID CLASS OF DIFFERENT EXPERIMENTAL DIETS (RESULTS IN %) ... 24
TABLE 4: GROWTH PERFORMANCE, FEED UTILIZATION, CONDITION AND HEPATIC INDICES OF ARGYROSOMUS REGIUS FED THE EXPERIMENTAL DIET. ... 25
TABLE 5: WHOLE-BODY COMPOSITION (DRY MATTER) OF ARGYROSOMUS REGIUS FED THE EXPERIMENTAL DIET. ... 26
TABLE 6: LIVER FATTY ACID COMPOSITION (MG/G FATTY ACIDS) OF ARGYROSOMUS
REGIUS FED THE EXPERIMENTAL DIETS. ... 27
TABLE 7: BRAIN FATTY ACID COMPOSITION (MG/G FATTY ACIDS) OF ARGYROSOMUS
REGIUS FED THE EXPERIMENTAL DIETS. ... 28
TABLE 8: MUSCLE FATTY ACID COMPOSITION (MG/G FATTY ACIDS) OF
ARGYROSOMUS REGIUS FED THE EXPERIMENTAL DIETS. ... 29
TABLE 9: LIVER FATTY ACID COMPOSITION (MG/G FATTY ACIDS) OF ARGYROSOMUS
REGIUS FED THE EXPERIMENTAL DIETS. ... 30
TABLE 10: BRAIN FATTY ACID COMPOSITION (% FATTY ACIDS) OF ARGYROSOMUS
TABLE 11: MUSCLE FATTY ACID COMPOSITION (% OF TOTAL FATTY ACIDS) OF
ARGYROSOMUS REGIUS FED THE EXPERIMENTAL DIETS. ... 32
TABLE 12: LIPID CLASS COMPOSITION (% TOTAL OF LIPID CLASS) AND FAT DEPOSITION (%) OF LIVER, BRAIN AND MUSCLE OF ARGYROSOMUS REGIUS FED THE EXPERIMENTAL DIETS. ... 35
TABLE 13: ACTIVITIES OF GLUTATHIONE PEROXIDASE (GPX; MU MG−1 PROTEIN), SUPEROXIDE DISMUTASE (SOD), GLUCOSE-6-PHOSPHATE DEHYDROGENASE (G6PDH), GLUTATHIONE REDUCTASE (GR), AND CATALASE (CAT) (U MG−1 PROTEIN), AND TBARS CONTENT (NMOL MDA G TISSUE−1) OF ARGYROSOMUS
Abbreviations index
ARA - Arachidonic Acid ALA - α-Linolenic Acid BW - Body Weight BHT - Butylated Hydroxytoluene CAT - Catalase CH- Cholesterol K - Condition Factor DAG - Diacylglycerol
DHA - Docosahexaenoic Acid DM - Dry Matter
EPA - Eicosapentaenoic Acid EFA - Essential Fatty Acid
EPPO - Estação Piloto de Piscicultura de Olhão
FA - Fatty Acids
FAME - Fatty Acid Methyl Esters FCR - Feed Conversion Ratio FBW - Final Body Wet Weight FID - Flame Ionization Detector FAO - Food and Agriculture Organization
FFA - Free Fatty Acids GC - Gas Chromatographer G6PDH - Glucose-6-phosphate Dehydrogenase
GPX - Glutathione Peroxidase GR - Glutathione Reductase HIS - Hepatosomatic Index
HUFA - Highly Unsaturated Fatty Acid H2O2 - Hydrogen Peroxide
HO· - Hydroxyl Radicals
IPMA - Instituto Português do Mar e da Atmosfera
LA - Linoleic Acid
LPO - Lipid Peroxidation MDA - Malondialdehyde MAG - Monoacylglycerol
MUFA - Monounsaturated Fatty Acids MDA - Nanomoles Malondialdehyde GSSG - Oxidized Glutathione PL- Phospholipids
PUFA - Polyunsaturated Fatty Acids ROS - Reactive Oxygen Species GSH - Reduced Glutathione SFA - Saturated Fatty Acids
1O
2 -‐ Singlet Oxygen
SGR - Specific Growth Rate O2− - Superoxide Anions
SOD - Superoxide Dismutase TLC - Thin Layer Cromatography TBA - Thiobarbituric Acid
TBARS - Thiobarbituric Acid Reactive Substances
TAG - Triacylglycerol TCA - Trichloroacetic Acid VFI - Voluntary Feed Intake
1- Introduction
1.1- State of Aquaculture
Despite the increasing of world population, beyond 7 billion persons in 2015, the world per capita apparent fish consumption increased from an average of 9.9 kg in the 1960s to 19.2 kg in 2012. This was possible because global fish production has grown steadily over the last five decades, with food fish supply increasing at an average annual rate of 3.2 percent (FAO, 2014).
Fish and fishery products are among the most traded food commodities worldwide, with trade volumes and values reaching new highs in 2011, and are expected to carry on rising. However, this increase in fish demand causes huge pressure in wild stocks leaving an increased percentage of overexploited fish stocks and decreased proportion of non-fully exploited species. Of the world fish stocks assessed in 2011, 61.3 percent were fully-exploited and only 9.9 percent were under-exploited. While capture fisheries production remains stable, aquaculture represents the only viable solution to prevent the depletion of aquatic resources (FAO, 2014).
The contribution of farmed food fish has a record of 42.2 percent of the total 158 million tons of fish produced by capture fisheries (including for non-food uses) and aquaculture in 2012 (FAO, 2014).
In terms of production, global aquaculture provided 90.4 million tons (live weight equivalent) in 2012 (US$144.4 billion), including 66.6 million tons of food fish (US$137.7 billion). According to the latest information, FAO estimated that world food fish aquaculture production rose by 5.8 percent, to 70.5 million tons in 2013. The global trend of aquaculture development is gaining importance in total fish supply, and continues to grow strongly, yet at a slower rate (figure 1).
The development and distribution of aquaculture products is not uniform in all regions of the world (Gjedrem et al., 2012). Asia accounted for 89 percent of world’s aquaculture production by volume in 2010, with the share of freshwater aquaculture gradually increasing to 65.6 percent in 2010, from around 60 percent in the 1990s. Africa has increased its contribution to global production from 1.2 percent to 2.2 percent in the past ten years, mainly as a result of a rapid development in freshwater fish farming in sub-Saharan Africa. Europe and Oceania had the lowest average annual growth rates in the period 2000–2012, at 2.9 and 3.5 percent, respectively. In North America aquaculture has ceased expanding in the recent past years, but in South America it has shown strong and continuous growth, particularly in Brazil and
Peru. Some developed countries like Japan, The United States of America and several European countries have reduced their aquaculture output in recent years, mainly owing to competition from countries with lower production costs (FAO, 2014).
Figure 1: Fishery production in live weight equivalent for aquaculture (left) and capture (right). Source: OECD and FAO Secretariats, 2014.
1.2- Meagre
Meagre, Argyrosomus regius (Asso, 1801), is a teleost fish of the family Sciaenidae, which includes 70 genera and 270 species (Nelson, 1994) distributed in subtropical waters such as Mediterranean and Black Sea and along the Atlantic coasts of Europe and Africa (Poli et al., 2003). Meagre is nectobentonic, and inhabits inshore and shelf waters close to the bottom, as well as surface and midwaters from 15 to about 200 m in sandy bottoms and grassland of Posidonia (Whitehead et al., 1986). This species exhibits a big head and an elongated, fusiform and slightly compressed body. It has a dorsal silver-grey color with bronze trails and an evident lateral line (figure 2). In the wild this species can grow up to 2 m and reach 50 kg, but it is more frequent to capture individuals between 50 cm and 1 meter in length (Cárdenas, 2010).
A. regius has a relatively big terminal mouth, with small teeth disposed in several
series. It is a carnivorous species, very voracious and has a diet based on polychaete worms, crustaceans, echinoderms, mollusks, and small fish (Jimenez et
al., 2005).
It is a gregarious species, moving in small groups, and displaying anadromous behavior, migrating to spawn from deep waters to coastal areas like estuaries and salt marshes between the months of April and June (Monfort, 2010). Areas that remain important for spawning are the estuary of the river Gironde, Bay of Biscay,
France (Quéméner et al., 2002), river Tejo, Portugal and river Guadiana, Southern Spain and Portugal (Gonzalez-Quiros et al., 2011). This species is capable of reaching these areas because it is eurithermal and eurihaline, resisting sudden changes in temperature from 2 to 38 °C and of salinity from 5 to 39 ‰.
The majority of Sciaenid species are iteroparous, reproducing more than once in a lifetime and gonochoric, only have one distinct sex per organism.
Average world catches of A. regius were of 4408 tons per year from 2005 to 2007 (FAO, 2007). However, this value may have been higher as FAO data for some countries were unavailable, or wrongly estimated.
Meagre is considered a highly susceptible species because it forms large spawning aggregations and produces conspicuous sounds when migrating to shallow waters, with substantial fishing effort during the reproductive season. Furthermore, the spawning habitats of the species (river mouths and lagoons) often suffer serious environmental deterioration (Quéro and Vayne, 1987; Sadovy and Cheung, 2003). This reproductive behavior, coupled with the general worldwide tendency to overfish top predators (Christensen et al., 2003), including adult and juvenile meagre (Quéméner, 2002), and the lack of basic biological information about the species, have raised concerns about the status of meagre stocks.
In Mediterranean waters, meagre populations have suffered an alarming decline in numbers (Quéro and Vayne, 1987) and have disappeared from the Balearic Islands (Western Mediterranean), where the species is considered to be in critical danger (Mayol et al., 2000).
Figure 2: Meagre (Argyrosomus regius, Asso, 1801) Source: IRIDA’s research for meagre culture
1.3- Meagre Aquaculture
The history of meagre aquaculture is quite recent, it is farmed in Europe since the late nineties. The first commercial production was recorded in France in 1997. Since
then, production has expanded slowly in nearby regions, especially on the Tyrrhenian side of the Italian coast and in Corsica.
Total aquaculture production has raised from a few tons in 2000 to 2200 tons in Egypt, 1348 tons in Spain, 418 tons in France, 102 tons in Italy, and 44 tons in Portugal, in 2009 (FAO, 2011).
Mediterranean mariculture has been dominated by the production of gilthead seabream (Sparus aurata) and European seabass (Dicentrarchus labrax). Meagre has potential characteristics suitable for aquaculture diversification, because it adapts easily to captivity, exhibits high growth rates (>1 kg year per year), which is much more than the growth potential of currently cultured species, it has an excellent feed conversion rate (0.9–1.2 depending on the feed) (Quéro and Vayne, 1997; Quèmèner, 2002) and tolerates wide ranges of temperature and salinity. It has a high nutritional value owing to the fact it is a lean fish, with low lipid and high protein quality flesh and long shelf-life (Quèmèner, 2002; Poli et al., 2003). Seabass and seabream have two to five times more fat than meagre, however the profile of fatty acids are similar to them, characterized by a high proportion of polyunsaturated fatty acids (PUFAs), especially the n-3 series (among 20.7 and 26.7% in 100 grams of live weight) (Rodriguez-Rua et al., 2009). In addition, meagre matures at a large size >4 kg (Schuchardt et al., 2007), which is larger than the harvest size, thus avoiding problems of reduced growth associated with maturation. Although meagre fails to undergo oocyte maturation spontaneously in confinement, recently developed hormonal induction methods have proven effective in controlling spawning (Mylonas
et al., 2011; Duncan et al., 2012) and producing eggs of sufficient quality and
quantity for commercial hatchery production. Larvae and juveniles have been reared with similar facilities and methodologies used for other marine fish species (Pousão-Ferreira et al., 2013; Soares et al., 2015). This large size fish offer excellent opportunities for processing such as fillets, loins, slices, etc. all items increasingly demanded by the European market (Saavedra et al., 2015).
However, this species is generally unknown to fish consumers, apart from some local areas, where it is landed from capture fisheries, western France, southern Portugal, southern Spain and Egypt. So producers have to work out the marketing for the successful introduction of this species on the market. During the last few years market showed signs of saturation for this species, prices have been low and the sector exhibited severe signs of crisis (Cardia and Lovatelli, 2007). Though culture of new species has been suggested as a basic mean to overcome the problem of Mediterranean aquaculture (Cardia and Lovatelli, 2007), and although meagre was
one of the most suitable candidate species, this apparently did not yet fulfil consumers requirements.
The production of meagre is intensive, conducted both in land-based tanks and cages. Production facilities are few and mainly distributed in southern France (Camargue, Cannes, and Corsica) and Italy (La Spezia and Orbetello). In land-based farms production is mainly achieved in circular or rectangular tanks with a water depth of 1 meter and a volume of 500 m³, usually covered with PVC. Nowadays meagre is mainly farmed in the sea, using circular or square surface cages of 500-1000 m³. More recently, submerged cages have also successfully been used; these 2 000 m³ cages are submerged at 10-20 m depth, and an average stocking density of 10-15/m³ is used (Monfort, 2010).
Commercial feed is supplied by all major aquafeed producers. Meagre feed is similar to that used for other Mediterranean marine species. An extruded feed with 45-48 percent protein and up to 20-24 percent lipid is used. In land-based farms fish are fed 2 to 3 meals per day and in sea cages a single daily meal is often provided (Monfort, 2010). Little information exists about the dietary nutrient requirements that can be used for the formulation of specialized diets for this species (Chatzifotis et al., 2012). Chatzifotis et al. (2010), evaluated the effect of dietary lipid levels on growth and feed utilization of meagre. Overall, results indicated that the best growth performance was observed in fish fed with a diet including 17% lipids, whereas the increase of dietary lipid level from 17% to 21% had a negative effect on growth.
Moedo et al. (2011) indicated that 60% of crude protein was the most suitable protein level for meagre juveniles. Allied to these results the analysis of the proximal composition of the whole body revealed that fish fed this diet had lower lipid content and the highest percentage of protein content.
The mean market price of meagre coming from captured fisheries is between EUR 7-12/kg and has increased since 1999. Now, the cost of production for meagre is similar or lower to the cost of production of European seabass and gilthead seabream, estimated to be approximately 3.9 kg (Monfort, 2010). Thus, from an economical perspective, meagre still seems to be a promising aquaculture species.
1.4- Fish Nutrition
For several years, the main concern in Nutrition studies was to accomplish the minimal nutrients necessary to achieve good growth in different species of fish (NRC, 2011). However, nowadays, the role of nutrition is much more embracing than designing fish performance trials, select appropriate diet formulations and feeding
levels. Nutrition plays an important role in aquatic environments by increasing nutrient retention as well as in reproduction, fish health and welfare, or the capacity of fish to respond to stressors and pathogens (Lall et al., 2000). Nutrition combines efforts of various scientific areas, such as physiology, genetics, pathology, molecular biology, which can contribute importantly for developing new knowledge in aquaculture (Hardy, 1999).
The intensification of the production systems and technology was necessary for aquaculture development. This was essentially a result of the formulation of new diets that covered all nutritional requirements of the studied species (Allan et al., 2006). As any other animal producing industry, aquaculture is focused on maximizing growth rate and minimizing production costs: a rapid growth rate minimizes the time to achieve the marketable size of the animals while decreasing production costs. However, despite all technologic advances aquaculture’s future is threatened as far the production of fishmeal and fish oil remains stagnant. Being highly dependent on nutrient inputs, aquaculture main challenges for the next years must focus on the development of new alternative ingredients to feed cultivated species (Lane et al., 2014).
Important ingredients like fishmeal and fish oil are hugely produced worldwide, approximately 6 million and 1 million tonnes respectively are produced annually (figure 3) (Tacon, 2003). Even so, these ingredients cannot sustain the continued increase in demanding from aquaculture products. Understanding the nutritional requirements of aquaculture target species and exploring new ingredients and their capacity to fulfil the needs of the species is imperative (Allan et al., 2006). Fish growth and overall production are influenced by many factors, with feeding the fish occupying the first place in the running costs of production. The most expensive nutrient is protein and therefore, it is necessary that diets be formulated with optimized quantities of protein that meet but not exceed fish protein needs, for reducing feed costs (Rahimnejad et al., 2015). In aquaculture, the objective is to provide species with the quantities of protein necessary to satisfy the requirements of the fish in essential amino acids for a maximum performance and growth (Chi et al., 2010). Excess of dietary protein can lead to higher excretion of ammonia by the fish, as well as making the diets more expensive than needed. As a consequence of increase levels of ammonia, the water quality gets poorer (Rahimnejad et al., 2015). Diet efficiency is one of the central issues in fish nutrition and this factor is very influence by the ratio protein/energy, as well as, the specie or life stage of the fish. If
the protein is in excess or deficient in a diet, it will either be used as an energy source or have a negative influence in growth (NRC, 2011)
It has been demonstrated that protein utilization efficiency can be improved by using lipids and carbohydrates for sparing protein for energy purposes (Moedo et al., 2011; Cho and Kaushik, 1990; Kaushik and Medale, 1994). In this regard, lipids are a more efficient source of energy than carbohydrates because lipids are readily metabolized by fish, especially by carnivorous species (NRC, 2011).
Figure 3: Global production of fishmeal and fish oil. Source: FAO, 2014
1.5- Lipids
Lipids are generally described as hydrophobic compounds with high solubility in organic solvents, and usually containing fatty acids covalently bond to glycerol molecules or amino groups, forming glycerides in the first case and sphingolipids in the latter (Tocher, 2003). Lipids include, as major groups, triacylglycerols (TAG), wax esters, sterols and phospholipids (PL). As for most vertebrates, lipids also constitute a great source of energy for fish and participate in the growth, reproduction and other important metabolic functions. They are important constituents of biological membranes, precursors of many hormones and signaling molecules like eicosanoids and others. The term 'eicosanoids' is used to denote a group of oxygenated, twenty carbon fatty acids, and the pathways leading to it are known collectively as the 'arachidonate cascade'. Almost all tissues produce eicosanoids, and they have a wide range of physiological actions in blood clotting, immune and inflammatory responses, cardiovascular tone, renal and neural functions, and reproduction (Schmitz and Ecker, 2008).
Lipids are also a source of essential fatty acids (EFA), like n-3 and n-6 polyunsaturated fatty acids that cannot be synthesized de novo in animal cells and
must therefore be obtained from the diet (Turchini et al., 2009). In fish diets, n-3 PUFA are mainly provided by fish oils, which contain highly levels of these EFA. Of all animals currently farmed, fish are the richest source of n-3 PUFA, which has fundamental implications for human nutrition (Huang et al., 2007).
About 15-30% of fish diets are lipids, and the increase of dietary lipids contributes to reducing diet costs, by diminishing protein content (Craig and Helfrich, 2009), and maximizing protein retention and fish performance (Cho and Kaushik, 1990). An increase of lipids in the diet can however lead to higher body fat deposition (Chatzifotis et al., 2010; Luo et al., 2005), and induce metabolic alterations, including fatty liver (Dos Santos et al., 1993), abnormal oxidative status (Rueda-Jasso et al., 2004), impairment of nutritional value and transformation yield, or affect organoleptic and physical properties of the fillets (Austreng and Krogdahl, 1987; Gjedrem, 1997; Hillestad et al. 1998) which may reduce its commercial value (Martino et al., 2002). So it is fundamental knowing the optimal levels of dietary lipids that promotes maximum efficiency of fish growth, development and flesh quality (Wang et al., 2005).
1.6- Fatty acids
Fatty acids (FA) are hydrocarbon chains of varying length with one end of the chain terminated by a methyl group and the other end by a reactive carboxyl group. The hydrocarbon chain can be saturated or unsaturated. Unsaturated fatty acid contain double bonds between pairs of adjacent carbon atoms and can be classified depending on the number of double bonds as monounsaturated (MUFAs), which contain just one double bond, and polyunsaturated that contain more than one double bond. FA are the major constituent of triacylglycerides and phospholipids but can be found either as free molecules, although at small amounts.
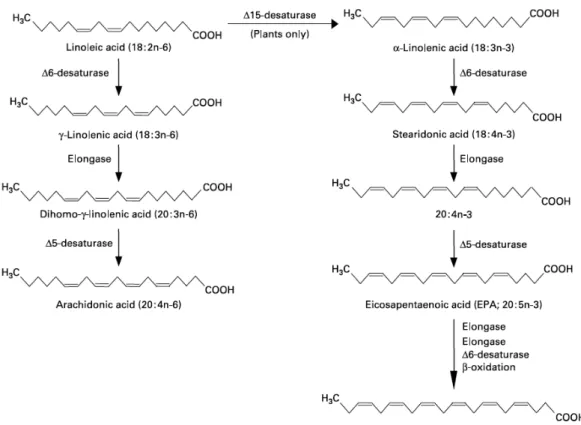
Generally, there are only two essential fatty acids. These are linoleic and α-linolenic acids that can be elongated and desaturated by the animals to the functional FA. However, marine fish can only met their FA requirements with highly unsaturated fatty acids (HUFAs) of the n-3 series: eicosapentaenoic (EPA; 20:5(n-3)) and docosahexaenoic (DHA; 22:6(n-3)), as they lack or have a very low activity of 5-desaturase, thus preventing the elongation and desaturation of the precursor α-linolenic acid (figure 4) (Owen et al., 1975; Watanabe, 1982; Sargent et al., 1989). The spatial conformation of DHA is different from that of EPA as a result of its carbon backbone length and degree of unsaturation, so EPA has 20 carbon atoms and 5
double bonds (20:5) and DHA has a longer chain, 22 carbon atoms and 6 double bonds (22:6) (Gorjão et al., 2009).
Figure 4: The metabolic pathways by which essential fatty acids are converted to longer chain, more unsaturated derivatives. Source: Narayan et al., 2015
These two HUFAs play diverse roles in cells, controlling and regulating growth performance, survival, stress resistance, cell membrane fluidity, immune function, nervous system development, vision and pigmentation (Bell et al., 1986)
Recent studies have also shown that n-3 long chain PUFA decrease fat accumulation, increase fatty acid β-oxidation capacity and modulate the expression of lipid metabolism-related genes, which are essential for lipid synthesis and play key roles in the catabolism and storage of fatty acids (Kjær et al., 2008; Todorčević et al., 2009; Ji et al., 2011).
On the other hand, HUFAs are more susceptible to peroxidation and trigger much more deleterious effects than other dietary fatty acids do. So, high levels (about 5% dry weight basis) of dietary HUFAs were reported to cause poor growth, low feed conversion (Ibeas et al., 2000), impaired mitochondrial function and β-oxidation activity in grass carp, rainbow trout (Oncorhynchus mykiss) and severe oxidative stress in Atlantic salmon (Du et al., 2006, 2008; Kjær et al., 2008; Østbye et al., 2009; Todorčević et al., 2009).
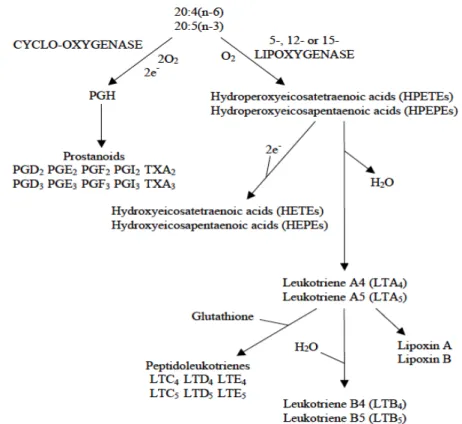
EPA, DHA and ARA, are precursors for the synthesis of bioactive lipid mediators, eicosanoids, that include prostaglandins, leukotrienes, lipoxins and thromboxanes. The principal substrate is arachidonic acid, but both eicosapentaenoic acid and docosahexaenoic acid are also important substrates (Henderson and Sargent, 1985). There are three major pathways within the eicosanoid cascade, including the cyclooxygenase, lipoxygenase, and epoxygenase pathways (figure 5). ARA and EPA compete for the cyclooxygenases and lipoxygenases that produce, respectively, 2-series prostanoids and 4-2-series leukotrienes from ARA, and 3-2-series prostanoids and 5-series leukotrienes from EPA. Eicosanoids produced from ARA are generally more biologically active than those produced from EPA and the respective eicosanoids compete for the same cell membrane receptors. Wherefore ARA produces more potent inflammatory and pro-aggregatory eicosanoids while EPA has an antagonist response (Tocher, 2010).
Figure 5: Pathways of conversion of araquidonic acid 20:4 (n-6) and eicosapentaenoic acid 20:5 (n-3) to eicosanoids. Souce: Lall, 2000
Therefore, adequate EPA:ARA ratios are important because one of these EFAs can regulate the efficacy of the other (Izquierdo and Koven, 2011; Koven et al., 2001). The EFA requirements of fish vary both qualitatively and quantitatively, and the optimal level of for marine fish is known to be around 0.5-1% of dry matter for EPA
and DHA (NRC, 2011).
Thus, several studies have been made to evaluate the ideal proportion of EFA in the diet. Some studies with larvae of red and gilthead seabream and juvenile striped jack, demonstrated that including more DHA promoted growth, feed efficiency and vitality more effectively than EPA (Watanabe et al., 1989; Izquierdo et al., 1989; Takeuchi et al., 1990; Rodriguez, 1994). Besides, elevated levels of dietary EPA relative to DHA were shown to have a negative impact on larval neural function, growth and survival (Copeman et al. 2002).
Given that DHA is naturally found at very high levels in the neural tissue, it is thought to play a critical role in neural membrane structure and function, including visual acuity for optimum hunting success (Copeman et al., 2002) and escape swimming with improved higher burst speed (Benítez-Santana et al., 2014).
In contrast, fresh water fish like rainbow trout, Oncorhynchus mykiss, that has an enzymatic system of desaturases and elongases very active are able to biosynthesize EPA and DHA so diets containing similar levels of EPA or DHA demonstrated that growth was independent of dietary type of n-3 HUFA; however a synergistic effect on growth and feed efficiency was observed when these acids were combined (Takeuchi and Watanabe, 1977). So, it is important to continue studies in this area to better understand the complex interactions between EFA.
1.7- Phospholipids
Berg et al. (2002) refer that the three principal lipids present in the membranes are phospholipids, glycolipids and cholesterol, being phospholipids the most abundant. Similarly to other animals, the biomembranes of fish tissues contain
phosphatidylcholine as the major phospholipid followed by
phosphatidylethanolamine, and minor components like phosphatidylserine, phosphatidylinositol, cardiolipin, and sphingomyelin.
Phospholipids are composed by fatty acids, a group were fatty acids are attached, usually glycerol, a phosphate, and an alcohol connected to the phosphate. The fatty acids create a hydrophobic barrier, while the other components of the phospholipids (the hydrophilic group) are able to keep an interaction with the environment (Berg et
al 2002).
Phospholipids have PUFA preferentially located on the sn-2 position of their glycerol backbone. Saturated and monounsaturated fatty acids are preferentially located on the sn-1 position of phospholipids and the sn-1 and sn-3 positions of triacylglycerols. Fish phospholipids characteristically contain a ratio of n-3/n-6 PUFA of 10-15:1
(Ackman, 1980).
Tocher et al. (2008) referred the important role of PL in the structure and function of biomembranes, in digestion and intestinal absorption of different components of the diet such as long chain fatty acids, proteins, vitamins and minerals. Also, PL contribute to optimize fish growth and survival, and decrease some deformities in different ages and types of fish.
The optimization of the quantity of PL in a diet may enhance lipid deposition, increasing the energy available for growth and ovaries development (Kanazawa et
al., 1985; Teshima et al., 1986; Alava et al., 1993; Cahu et al., 1994; Kontara et al.,
1997; Gong et al., 2000; Gonzalez- Felix et al., 2002). Furthermore, PL may exert beneficial effects by providing essential nutrients, e.g. essential fatty acids, phosphorous, choline and inositol (Tocher, 1995; Lall, 2002; Tocher et al., 2008). In previous studies, King et al. (1992) showed that phospholipids also have an antioxidant property, as well as feed-attractant properties (Harada, 1987).
It has been suggested that fish at larval stages, are not capable of synthesizing PL at a sufficient rate to meet the requirements for cell formation and its components during the initially period of larval growth (Izquierdo and Koven, 2011; Kanazawa, 1993; Geurden et al., 1997a). Due to this suggestion, several fish larvae receive an abundance of phospholipids in their natural diets, whether from yolk sac lipids or from natural prey (Tocher et al., 2008).
Recommended requirements for PL ranged from 8% to 12% dry diet in larval fish (Cahu et al., 2009). Although the PL requirement generally decreases with age or developmental stage, decrease to around 2 to 4% for juvenile (Tocher et al, 2008). Requirement for dietary phospholipids has not been established for adult fish. There is some confusion over whether excessive levels of dietary phospholipids can be detrimental to fish and crustaceans. Increasing the dietary PL level beyond the required level did not affect survival or growth in various studies (Conklin et al., 1980; Kanazawa, 1993; Geurden et al., 1995b).
1.8- Oxidative Stress
Generation of reactive oxygen species (ROS) is an unavoidable consequence in aerobic organisms. ROS are naturally produced during oxidative metabolism and include superoxide anions (O2−), hydrogen peroxide (H2O2), hydroxyl radicals (HO·),
and singlet oxygen (1O
In normal situations, a balance exists between the production of ROS and antioxidant processes, but if the balance is not perfect increased levels of oxidative damage can occur in organisms and increase lipid peroxidation (LPO), protein oxidation, and DNA damage that can deleteriously affect cell viability by causing membrane damage and enzyme inactivation (Livingstone, 2001). To maintain homeostasis and prevent oxidative stress, living organisms have evolved antioxidant defense mechanisms that include both enzymatic and non-enzymatic components. The main enzymes with antioxidant activity are: superoxide dismutase (SOD), which catabolizes the dismutation of superoxide radicals to molecular oxygen and hydrogen peroxide; catalase (CAT), which degrades hydrogen peroxide into molecular oxygen and water; and glutathione peroxidase (GPX), which reduces both hydrogen peroxide and organic peroxides to water and corresponding alcohols, respectively, by a glutathione-dependent reaction (Storey, 1996; Morales et al., 2004; Pérez-Jiménez
et al., 2009). Other enzymes, such glutathione reductase (GR) and the rate-limiting
enzyme of the pentose phosphate pathway, glucose-6-phosphate dehydrogenase (G6PDH), are considered to play a crucial role on the modulation of the activity of the two H2O2 scavenging pathways of cells (Mourente et al., 2002; Morales et al., 2004).
GR, at the expense of NADPH, regenerates the reduced glutathione (GSH), substrate for GPX from oxidized glutathione (GSSG); and G6PDH generates the NADPH that is crucial for the normal functioning of the antioxidant enzymes (CAT, GPX and GR) (Storey, 1996; Morales et al., 2004).
Several circumstances can interact with the antioxidant defense response in fish. Factors intrinsic to the fish itself, such as age, phylogenetic position, and feeding behavior, as well as environmental factors such as the type of diet supplied, daily or seasonal changes in temperature, dissolved oxygen, toxins present in the water, pathologies, or parasites, can either fortify or reduce antioxidant defenses (Felton, 1995; Martínez-Álvarez et al., 2005).
PUFA are particularly susceptible to lipid peroxidation (Halliwell and Chirico, 1993), due to the high number of double bonds. Fish tissues and commercial diets for cultured fish often contain high levels of PUFA (Stephan, Guillaume and Lamour 1995), and increasing dietary n-3 PUFA can elevate the concentrations of these FA in fish tissues. Lipid peroxidation can be a major contributor to the loss of cell function through cellular membrane disruption, by the decrease of membrane fluidity and activation of calcium-dependent proteases and lipases that lead to an increase of membrane permeability (Hermes-Lima et al. 1995).
To determine the oxidative stress levels in fish it is usually measured the antioxidant enzymes activities and malondialdehyde (MDA) or levels of end-product of lipid oxidation, such as thiobarbituric reactive species (TBARS) (Tsangaris et al., 2011). These biomarkers are however non-specific and non-reliable indicators of oxidative stress (Knight et al., 1988).
Most of the studies on oxidative stress have been conduced mostly in humans and rodents. Some reports suggested that 1% EPA + DHA in the diet could lead to oxidative damage in rats, showing higher thiobarbituric acid–reactive substance levels and reduced superoxide dismutase activity and glutathione levels (Park et al., 2009). On the other hand, Popović (2013) showed opposite results; after treatment of aged male rats with fish oil obtained an increase of SOD, CAT activities and decreased lipid peroxidation
In fish species like juvenile of grass carp, Ctenopharyngodon idellus, SOD activity increased significantly with increasing dietary HUFA content, which is consistent with the level of MDA (Ji et al., 2011) and in Atlantic salmon (Salmo salar) SOD activity also increased with more dietary EPA and DHA. Dietary PL supplement also significantly increased SOD activity and reduced the activities of catalase and glutathione peroxidase in the whole body of Misgurnus anguillicaudatus larvae (Gao
et al., 2014).
1.9- Objectives
As mentioned above, meagre is a species with high potential for aquaculture, but it is still necessary to improve knowledge on meagre nutrition to enhance fish performance.
Thus, this study aimed to determine the growth performance and body composition of meagre fed four diets with different proportions of phospholipids and DHA. Moreover, the effect of the dietary treatments on fatty acid and lipid class composition of the muscle, liver and brain was also evaluated, as well as dietary effects on hepatic oxidative damage and antioxidant mechanisms.
The overall objective of this study was to address two key issues: if the increase of phospholipids promotes growth performance and if increased levels of DHA in the diet promotes increased deposition of DHA in muscle.
2- Material and methods
2.1- Diets
Four experimental diets (A, B, C and D) were formulated to contain two different proportions of DHA (1.0 and 2.0%) and phospholipids (1.0 and 4.0%). The percentage of protein, lipids and starch were constant in all diets.
The variation in the content of phospholipids was achieved by altering the concentration of lecithin in the diet, and the variation of the DHA was made by changing the concentration of tuna and fish oil. The experimental diets used in this work were formulated by SPAROS Lda. (Olhão, Portugal).
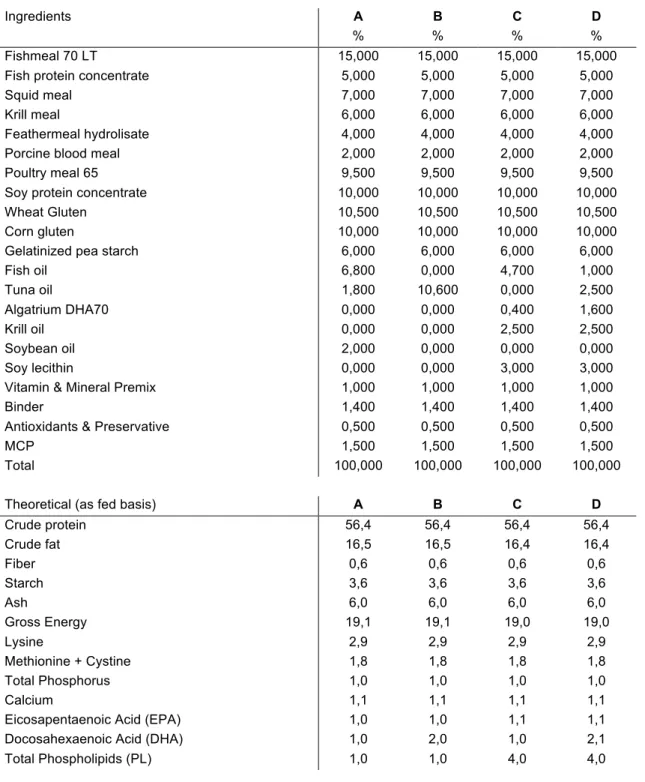
All ingredients and theoretical composition of the different diets are presented in table 1. Additionally, analyzed concentration of lipids and lipid composition are shown in table 2.
Table 1: Formulation and proximal chemical composition of the experimental diets.
Ingredients A B C D
% % % %
Fishmeal 70 LT 15,000 15,000 15,000 15,000
Fish protein concentrate 5,000 5,000 5,000 5,000
Squid meal 7,000 7,000 7,000 7,000
Krill meal 6,000 6,000 6,000 6,000
Feathermeal hydrolisate 4,000 4,000 4,000 4,000
Porcine blood meal 2,000 2,000 2,000 2,000
Poultry meal 65 9,500 9,500 9,500 9,500
Soy protein concentrate 10,000 10,000 10,000 10,000
Wheat Gluten 10,500 10,500 10,500 10,500
Corn gluten 10,000 10,000 10,000 10,000
Gelatinized pea starch 6,000 6,000 6,000 6,000
Fish oil 6,800 0,000 4,700 1,000 Tuna oil 1,800 10,600 0,000 2,500 Algatrium DHA70 0,000 0,000 0,400 1,600 Krill oil 0,000 0,000 2,500 2,500 Soybean oil 2,000 0,000 0,000 0,000 Soy lecithin 0,000 0,000 3,000 3,000
Vitamin & Mineral Premix 1,000 1,000 1,000 1,000
Binder 1,400 1,400 1,400 1,400
Antioxidants & Preservative 0,500 0,500 0,500 0,500
MCP 1,500 1,500 1,500 1,500
Total 100,000 100,000 100,000 100,000
Theoretical (as fed basis) A B C D
Crude protein 56,4 56,4 56,4 56,4 Crude fat 16,5 16,5 16,4 16,4 Fiber 0,6 0,6 0,6 0,6 Starch 3,6 3,6 3,6 3,6 Ash 6,0 6,0 6,0 6,0 Gross Energy 19,1 19,1 19,0 19,0 Lysine 2,9 2,9 2,9 2,9 Methionine + Cystine 1,8 1,8 1,8 1,8 Total Phosphorus 1,0 1,0 1,0 1,0 Calcium 1,1 1,1 1,1 1,1
Eicosapentaenoic Acid (EPA) 1,0 1,0 1,1 1,1
Docosahexaenoic Acid (DHA) 1,0 2,0 1,0 2,1
2.2- Experimental conditions
This experiment was conducted for 8 weeks, beginning on September 15th until
November 13th, in the facilities of Instituto Português do Mar e da Atmosfera (IPMA),
Estação Piloto de Piscicultura de Olhão (EPPO), Portugal with juveniles of meagre
Argyrosomus regius bred in captivity at IPMA.
A total of 1800 juveniles from the same cohort were randomly assigned to 12 fiberglass tanks (150 juveniles per tank) with 1500 liters of capacity. An open circulation system was established with water previously filtered and pumped from Ria Formosa.
Diets were tested in triplicate tanks with fish sorted manually to have an initial weight of 13.8± 2.0g. Previously to the start of the trial fish were acclimatized for 2 weeks in order to adapt to the experimental conditions.
During the experiment photoperiod was maintained at 14 hours light: 10h dark, dissolved oxygen between 3 to 6 mg/l, salinity ranged from 34 to 36 psu and water temperature between 19 to 24ºC. A heater assured that water temperature did not decrease from 19ºC to assure that fish ingestion were adequate.
Tanks maintenance was done daily, and included the monitoring of water temperature and dissolved oxygen. Regularly, the flow rate of each tank was also verified to maintain a water renovation rate of 60% per hour.
The meagre were fed by hand, 3 times a day, to apparent satiety at 9h, 13h and 17h, seven days a week.
2.3- Sampling
During the trial fish were sampled at 3 times: at the start of the experiment, at the fifth week, and the end of the experiment.
In the first sampling, 31 fish from the stock population were weighed, measured and any deformations registered. Six of these fish were frozen for proximal analysis of the carcass. Samples of muscle, brain and liver from another six fish, were collected for fatty acid and lipid class determination. Liver weight was also measured to calculate the hepatosomatic index.
In the second sampling, 31 fish from each tank were measured and weighed and any deformations registered. The remaining fish of each tank were weighed in groups of 10 fish.
At the end of the trial, all fish from each tank were weighed, measured and any deformations registered. Six fish from each tank were immediately frozen for whole body composition analysis. Two pools of four other fish per thank were sampled for liver, brain and muscle tissues for lipid class and fatty acid analysis. A portion of liver was also used for oxidative stress analysis. All livers were weighted for determination of the hepatosomatic index.
Before sampling fish were starved (for 4h) and lightly anaesthetised (ethylene glycol monophenyl ether, 0.3 ml l-1). Immediately after collection, all tissue samples were
placed in liquid nitrogen and then frozen at -80ºC until analysed.
2.4- Analytical Methods
2.4.1- Zootechnical parameters
All data referring to the growth performance, nutrient retention and physiological status of meagre were evaluated based on the following formulas:
• Specific growth rate (SGR): 100 × (ln FBW- ln IBW))/ Nº of days
• Feed conversion rate (FCR): Total dry feed intake (g)/ Wet weight gain (g) • Voluntary feed intake (VFI): (Total dry feed intake (g)/ ((Initial biomass (g) +
Final biomass (g))/2) × 100)/ Nº of days)
• Protein efficiency rate (PER): Wet weight gain (g)/ Protein intake (g)
• Nutrient Retention (% nutrient intake): Total dry nutrient gain (g)/ Total dry nutrient intake (g)
• Energy Retention (% intake): Total energy gain (kJ)/ Total energy intake (kJ) • Hepatosomatic index (HSI): (Liver wet weight (g)/ whole-body wet weight (g))
× 100
• Condition factor (K): (Body weight (g)/ Total body length (cm)) × 1000)
2.4.2- Proximate analysis
Frozen fish carcasses were transferred to the facilities of Faculdade de Ciências da Universidade do Porto (FCUP) for analysis. All proximal analyses were performed in duplicate.
Before analyses, fish were dried at 70 ºC and then ground and stored until posterior analysis. Dry matter (DM) was determined by drying the samples at 105°C until constant weight; ash by incineration in a muffle furnace at 450 °C for 16 h; protein content (N×6.25) by the Kjeldahl method after acid digestion using Kjeltec digestion and distillation units (Tecator Systems, Höganäs, Sweden; model 1015 and 1026, respectively); lipid by petroleum ether extraction (Soxtec HT System) and gross energy by direct combustion in an adiabatic bomb calorimeter (PARR Instruments, Moline, IL, USA; PARR model 1261).
2.4.3- Tissue lipids
The samples were frozen in dry ice and carried out to the IPMA facilities at Lisboa for analyses. Samples were freeze-dried and then grinded. Two pools of each sample tissue were obtained and analysed in triplicate.
2.4.3.1- Lipid classes
Total lipids were extracted from 1 g of the hogenized tissue, using chloroform: methanol (2:1 v:v), according to Folch et al. (1957). Solvent was evaporated under nitrogen flushing to quantify the total lipids extracted from the samples. Lipids were re-dissolved at a concentration of 10 mg/ml of chloroform for determining lipid class composition.
The lipid classes were classified through thin-layer chromatography (TLC) by the method of Olsen and Henderson (1989). Total lipid samples (10 µl) were applied in 20×20 cm TLC silica gel plates (VWR, Lutterworth, UK) and running in a solvent mixture comprising n-hexane, diethyl ether and formic acid (50:50:2, by vol.). Excess solvent was evaporated via air drying and vacuum desiccation. Lipid classes were visualised by spraying with solution of phosphomolybdic acid (10%) in ethanol and charring plates at 160ºC for 20min. The relative percentage of the lipid classes were quantified by densitometry (GS-800 Calibrated Densitometer) with a software program from Quantity One 4.5.2 (PDI).
2.4.3.2- Fatty-acids
The fatty acid profile was determined according to Lepage and Roy (1986) modified by Cohen et al. (1988). This method consists in the transesterification, in acidic medium, of fatty acid methyl esters (FAME). The fatty acids were transesterified
using a mixture of acetylchloride and methanol (1:19, v/v) and 10 mg/ml of tricosanoic acid (23:0), as internal standard. FAME were analyse throw injection of 2 µl into a gas chromatograph (GC; Varian Star CP-3800) equipped with an auto sampler and a flame ionization detector (FID) at 250ºC. The separation was performed in a polyethylene glycol capillary column DB-wax (0.25 mm internal diameter 30 m polar capillary precolumn × 0.25 µM layer thickness) and helium as carrier gas. Helium was used as carrier gas at a flow rate of 1 mL min-1, to perform
the separation in a capillary column DB-Wax (30 m length × 0.32 mm internal diameter; 0.25 µm film thickness; Hewlett Packard, Albertville, MN, USA) programmed at 180 ºC for 5 min, raised to 220 ºC at 4 ºC min-1, and maintained at 220 ºC for 25 min, with the detector and the split injector (100:1) at 250 ºC. FAME identification was carried out by comparing their retention time with those of Sigma standards. The quantification of the different fatty acids as a function of its peak area, and the peak area of internal standard (23: 0) of the heavy mass of the sample and the total area of fatty acid in the sampleusing Varian software . Fatty acids present in the sample were identified by comparing the retention time obtained for each one and that of the standard pattern Sigma-Aldrich (Supelco Analytical). The accuracy of this methodology was assessed by testing certified reference materials in the same conditions as the samples, and the results obtained in this study showed to be in agreement with the certified values.
2.4.4- Oxidative stress
In order to have representative liver samples to perform the enzymatic analysis, 2 pools of 4 livers each per tank were used. Each liver pool was homogenized (dilution 1:4) in ice-cold buffer (100 mM Tris-HCl, 0.1 mM EDTA and 0.1% triton X-100 (v/v), pH 7.8). All procedures were performed on ice. Homogenates were centrifuged at 30.000g for 30 min at 4°C. After centrifugation, the resultant supernatants were collected and aliquots were stored at −80°C until analysis.
All antioxidant enzyme assays were carried out at 25°C. The enzymatic reactions were started by addition of the tissue extract, except for SOD were xanthine oxidase was used. The specific assay conditions were as follows:
• SOD
Superoxide dismutase (SOD; EC 1.15.1.1) activity was measured spectrophotochemically at 550 nm by the ferricytochrome c method using xanthine/xanthine oxidase as the source of superoxide radicals (McCord and
Fridovich, 1969). The reaction mixture consisted of 50mM potassium phosphate buffer (pH 7.8), 0.1 mM EDTA, 0.1 mM xanthine, 0.012 mM cytochrome C, and 0.025 IU mL−1 xanthine oxidase. Activity was reported as
units per mg of protein. One unit of activity was defined as the amount of enzyme necessary to produce a 50% inhibition of the ferricytochrome C reduction rate.
• CAT
Catalase (CAT; EC 1.11.1.6) activity was determined according to the method of Aebi (1984) by measuring the decrease of hydrogen peroxide concentration at 240 nm. The reaction mixture contained 50 mM potassium phosphate buffer (pH 7) and 10 mM H2O2 freshly added.
• GPX
Glutathione peroxidase (GPX; EC 1.11.1.9) activity was assayed as described by Flohé and Günzler (1984). The glutathione disulfide (GSSG) generated by GPX was reduced by glutationa redutase (GR), and NADPH consumption rate was monitored spectrophomotetrically at 340 nm. The reaction mixture consisted of 50 mM potassium phosphate buffer (pH 7.1), 1 mM EDTA, 3.9 mM GSH (reduced glutathione), 3.9 mM sodium azide, 1 IU mL−1 glutathione reductase, 0.2 mM NADPH and 0.05 mM H
2O2.
• Lipid Peroxidation:
The concentration of thiobarbituric acid reacting substances (TBARS) was determined as a marker of lipid peroxidation (LPO) following the methodology described by Buege and Aust (1978). An aliquot of the supernatant from the homogenate (100 µL) was mixed with 500 µL of a previously prepared solution containing 15% (w/v) trichloroacetic acid (TCA), 0.375% (w/v) thiobarbituric acid (TBA), 80% (v/v) hydrochloric acid 0.25 N and 0.01% (w/v) butylated hydroxytoluene (BHT). The mixture was heated to 100 °C for 15 min. Then, after being cooled at room temperature and centrifuged at 1.500 g for 10 min, supernatant was removed and absorbance measured at 535 nm. Concentration was expressed as nanomoles malondialdehyde (MDA) per gram of tissue, calculated from a calibration curve.
Glucose-6-phosphate dehydrogenase (G6PDH; EC 1.1.1.49) activity was assayed as previously described by Morales et al. (1990), using a reaction mixture containing 50 mM imidazole–HCl buffer (pH 7.4), 5 mM MgCl2, 2 mM
NADP and 1 mM glucose-6-phosphate.
• GR
Glutathione reductase (GR; EC 1.6.4.2) activity was determined spectrophotometrically at 340 nm by measuring the oxidation of NADPH as described by Morales et al. (2004). The reaction mixture consisted of 0.1 M sodium phosphate buffer (pH 7.5), 1 mM EDTA, 0.63 mM NADPH, and 0.16 mM GSSG.
Except for SOD, which units of expression were already described, all enzyme activities were expressed as units (CAT) or milliunits (GK, HK, PK, FBPase, 21 GDH, ASAT, ALAT, G6PDH, ME, FAS, GPX and GR) per milligram of hepatic soluble protein (specific activity).
Protein concentration was determined according to Bradford (1976) using Sigma protein assay kit and bovine serum albumin as standard. One unit of enzyme activity was defined as the amount of enzyme required to transform 1 µmol of substrate per minute under the above assay conditions.
2.5- Statistical analysis
Data are expressed as mean ± standard error of the mean (S.E), and all data analysis was done with the software used SPSS 19.0. Levene and Shapiro-Wilk tests were performed before analysis to verify whether the data were homogeneous and were normally distributed, respectively. When values were significant, data was transformed using ln, √x orarcsin square root . Statistical evaluation of growth trial,
lipid composition and oxidative stress data was done by two-way analysis of variance (ANOVA). The significance level of 0.05 was used for rejection of the null hypothesis.
3- Results
3.1- Diet composition
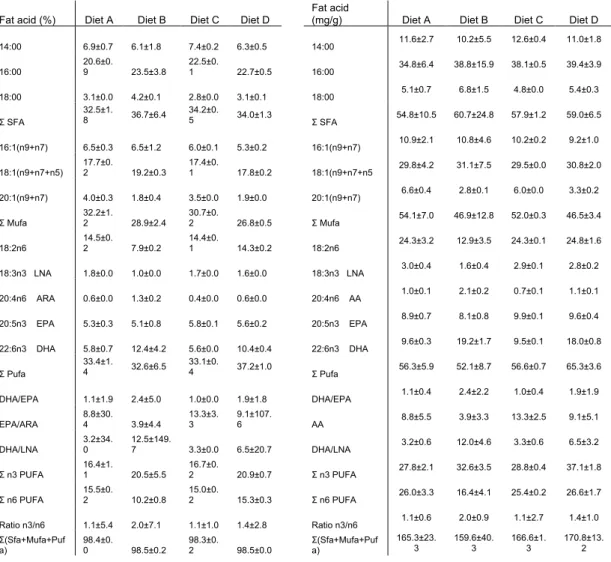
Table 2 presents the fatty acids composition of different diets. All diets had relatively similar amounts of total SFA, MUFA and PUFA, although diet A had a slightly higher level of MUFA than diet D (32.2 and 26.8% respectively DW) and the amount of PUFA was higher in D diet (37.2% DW) than in the other diets.
Lipid classes of the four diets are presented in table 3. TAG is the highest proportion in all diet, despite its percentage being lower in diets C (63.2% DW) and D (59.8% DW) than in the other diets. This is due to the diets supplementation with 4.0% PL as well as the high among of DAG (table 3).
Table 2: Fatty acid composition of the different experimental diets (results in % and mg/g fatty acid)
Fat acid (%) Diet A Diet B Diet C Diet D
Fat acid
(mg/g) Diet A Diet B Diet C Diet D
14:00 6.9±0.7 6.1±1.8 7.4±0.2 6.3±0.5 14:00 11.6±2.7 10.2±5.5 12.6±0.4 11.0±1.8 16:00 20.6±0. 9 23.5±3.8 22.5±0. 1 22.7±0.5 16:00 34.8±6.4 38.8±15.9 38.1±0.5 39.4±3.9 18:00 3.1±0.0 4.2±0.1 2.8±0.0 3.1±0.1 18:00 5.1±0.7 6.8±1.5 4.8±0.0 5.4±0.3 Σ SFA 32.5±1. 8 36.7±6.4 34.2±0.5 34.0±1.3 Σ SFA 54.8±10.5 60.7±24.8 57.9±1.2 59.0±6.5 16:1(n9+n7) 6.5±0.3 6.5±1.2 6.0±0.1 5.3±0.2 16:1(n9+n7) 10.9±2.1 10.8±4.6 10.2±0.2 9.2±1.0 18:1(n9+n7+n5) 17.7±0. 2 19.2±0.3 17.4±0. 1 17.8±0.2 18:1(n9+n7+n5 29.8±4.2 31.1±7.5 29.5±0.0 30.8±2.0 20:1(n9+n7) 4.0±0.3 1.8±0.4 3.5±0.0 1.9±0.0 20:1(n9+n7) 6.6±0.4 2.8±0.1 6.0±0.0 3.3±0.2 Σ Mufa 32.2±1.2 28.9±2.4 30.7±0.2 26.8±0.5 Σ Mufa 54.1±7.0 46.9±12.8 52.0±0.3 46.5±3.4 18:2n6 14.5±0.2 7.9±0.2 14.4±0.1 14.3±0.2 18:2n6 24.3±3.2 12.9±3.5 24.3±0.1 24.8±1.6 18:3n3 LNA 1.8±0.0 1.0±0.0 1.7±0.0 1.6±0.0 18:3n3 LNA 3.0±0.4 1.6±0.4 2.9±0.1 2.8±0.2 20:4n6 ARA 0.6±0.0 1.3±0.2 0.4±0.0 0.6±0.0 20:4n6 AA 1.0±0.1 2.1±0.2 0.7±0.1 1.1±0.1 20:5n3 EPA 5.3±0.3 5.1±0.8 5.8±0.1 5.6±0.2 20:5n3 EPA 8.9±0.7 8.1±0.8 9.9±0.1 9.6±0.4 22:6n3 DHA 5.8±0.7 12.4±4.2 5.6±0.0 10.4±0.4 22:6n3 DHA 9.6±0.3 19.2±1.7 9.5±0.1 18.0±0.8 Σ Pufa 33.4±1. 4 32.6±6.5 33.1±0.4 37.2±1.0 Σ Pufa 56.3±5.9 52.1±8.7 56.6±0.7 65.3±3.6 DHA/EPA 1.1±1.9 2.4±5.0 1.0±0.0 1.9±1.8 DHA/EPA 1.1±0.4 2.4±2.2 1.0±0.4 1.9±1.9 EPA/ARA 8.8±30. 4 3.9±4.4 13.3±3. 3 9.1±107. 6 AA 8.8±5.5 3.9±3.3 13.3±2.5 9.1±5.1 DHA/LNA 3.2±34. 0 12.5±149. 7 3.3±0.0 6.5±20.7 DHA/LNA 3.2±0.6 12.0±4.6 3.3±0.6 6.5±3.2 Σ n3 PUFA 16.4±1.1 20.5±5.5 16.7±0.2 20.9±0.7 Σ n3 PUFA 27.8±2.1 32.6±3.5 28.8±0.4 37.1±1.8 Σ n6 PUFA 15.5±0.2 10.2±0.8 15.0±0.2 15.3±0.3 Σ n6 PUFA 26.0±3.3 16.4±4.1 25.4±0.2 26.6±1.7 Ratio n3/n6 1.1±5.4 2.0±7.1 1.1±1.0 1.4±2.8 Ratio n3/n6 1.1±0.6 2.0±0.9 1.1±2.7 1.4±1.0 Σ(Sfa+Mufa+Puf a) 98.4±0. 0 98.5±0.2 98.3±0. 2 98.5±0.0 Σ(Sfa+Mufa+Puf a) 165.3±23. 3 159.6±40.3 166.6±1.3 170.8±13.2
SFA, Saturated Fatty Acids; MUFA, Monounsaturated Fatty Acids; LNA, α-Linolenic acid; ARA, Arachidonic Acid; EPA, Eicosapentaenoic acid; DHA, Docosahexaenoic acid; PUFA, Polyunsaturated Fatty Acids.