UNIVERSIDADE DE AVEIRO
2012
Departamento de Biologia
Sara Sofia Dinis
de Sousa
Biodiversidade de estirpes de S. cerevisiae vínicas
em Portugal.
Biodiversity of wine S. cerevisiae strains in
Portuguese appellations.
UNIVERSIDADE DE AVEIRO
2012
Departamento de Biologia
Sara Sofia Dinis
de Sousa
Biodiversidade de estirpes de S. cerevisiae vínicas
em Portugal.
Biodiversity of wine S. cerevisiae strains in
Portuguese appellations.
Dissertação apresentada à Universidade de Aveiro para cumprimento dos requisitos necessários à obtenção do grau de Mestre em Biologia Aplicada, realizada sob a orientação científica da Doutora Ana Catarina Batista Gomes, Investigadora da Unidade de Genómica do Biocant e do Professor Manuel António da Silva Santos, Professor Associado do Departamento de Biologia da Universidade de Aveiro.
Este trabalho é financiado por Fundos FEDER através do Programa
Operacional Factores de
Competitividade – COMPETE e por Fundos Nacionais através da FCT – Fundação para a Ciência e a Tecnologia no âmbito do
projecto FCOMP-01-0124-FEDER-008749 (referência FCT: PTDC/AGR-ALI/098292/2008)
Dedico este trabalho em especial à minha família pelo constante apoio e às minhas amigas Cecília e Vera pela motivação e ajuda dadas.
o júri
presidente Doutor João António de Almeida Serôdio
Professora auxiliar do Departamento de Biologia da Universidade de Aveiro
Doutora Laura Cristina da Silva Carreto
Investigadora no CESAM da Universidade de Aveiro
Doutor Manuel António da Silva Santos
Professor associado do Departamento de Biologia da Universidade de Aveiro
Doutora Ana Catarina Batista Gomes
agradecimentos Gostaria de começar por agradecer ao meu orientador interno, Professor Manuel Santos, pela oportunidade de participar neste projecto, e pela disponibilidade e interesse demonstrados. Queria também agradecer todo o empenho da Doutora Ana Catarina Gomes, minha orientadora externa. Sob a tua orientação, tive uma constante transmissão de conhecimento em diversas áreas.
O presente trabalho não seria possível sem a colaboração constante e incansável das pessoas que me rodeiam no laboratório. Por tal queria agradecer especialmente: à Susana Sousa que sempre me acompanhou no laboratório com muita paciência transmitindo-me a sua experiência, ao André Melo e à Ana Raquel pelo apoio ao longo deste ano, à Cátia Pinto e ao Remy Cardoso pela ajuda disponibilizada e a todos os colegas do Biocant que estiveram sempre presentes para me apoiarem.
Queria agradecer a todos os meus amigos, em especial à Cecília e à Vera que estiveram presentes sempre precisei.
Agradeço também à minha família, pelo apoio dado. Queria especialmente agradecer aos meus pais pela educação, suporte e carinho dados.
Por fim, queria agradecer ao Bruno por todo o apoio, motivação, dedicação, e por estar sempre ao meu lado.
palavras-chave Vinho, leveduras vínicas, Saccharomyces cerevisiae, genómica, microssatélites
resumo A produção de vinho é uma prática ancestral, onde o sumo de uva é fermentado. Este processo baseia-se na ação de um conjunto de microrganismos, dos quais a levedura Saccharomyces cerevisiae se destaca. Considerando que atualmente há uma crescente pressão para a diferenciação dos vinhos, suportada sobretudo na valorização das características únicas do vinho, a utilização massiva de estirpes de S. cerevisiae industriais limita o potencial de produção de vinhos com perfis metabólicos e aromáticos únicos e diferenciados.
Neste trabalho, o objetivo foi identificar a população de leveduras vínicas fermentativas de diferentes regiões vitivinícolas de Portugal, por forma a explorar a sua biodiversidade natural e, desta forma, avaliar o potencial de diferenciação existente naturalmente nas vinhas Portuguesas.
Para tal, isolaram-se leveduras de 36 fermentações de diferentes castas de quatro regiões vitivinícolas de Portugal. Ao todo foram isoladas 1260 leveduras na sua maioria S. cerevisiae. Das 911 S. cerevisiae identificadas foram distinguidas 826 estirpes de S. cerevisiae.
Com este trabalho, reunimos uma amostragem significativa da diversidade de estirpes de S. cerevisiae endógenas nas vinhas portuguesas, que permitirão um estudo mais aprofundado da diversidade genética. Assim, este trabalho representa um avanço significativo na exploração da biodiversidade de S. cerevisiae em Portugal, e será a base de futuros trabalhos em que se pretende explorar o potencial enológico destas estirpes.
keywords Wine, yeast, Saccharomyces cerevisiae, genomics, microsatellits
abstract Winemaking is an ancestral practice, where the grape juice is fermented into wine. This process relies on the action of a set of microorganisms where the yeast Saccharomyces cerevisiae stands out. Considering that nowadays there is a growing pressure for the wines’ differentiation, manly supported by the valorisation of the unique wine characteristics, the massive use of industrial S. cerevisiae strains limits the potential of a differential production of wine with metabolic and aromatic unique profiles.
In this work, the main objective was to identify the fermentative wine yeasts population of different Portuguese wine appellations of origin, in order to exploit their natural biodiversity and to evaluate the differentiation potential present at Portuguese vineyards.
Therefore, it is urgent to unveil the yeasts communities present in different Portuguese wine appellations whit a holistic approach and by this explore their natural biodiversity. In this work, yeasts were isolated from 36 fermentations of different grape varieties of four Portuguese appellations of origin. The predominant species from the 1260 yeast isolates was S. cerevisiae. In the 911 S. cerevisiae identified we found 826 S. cerevisiae strains.
With this study we have gathered a significant sampling of endogenous diversity of S. cerevisiae that will allow a deeper study on the genetic diversity. Therefore, this study represents a significant progress in the exploitation of the Portuguese S. cerevisiae biodiversity, which will be the basis for future work in which we intend to exploit the oenological potential of these strains.
Biodiversity of wine S. cerevisiae strains in Portuguese appellations
i
Index
Introduction ... 1
1. Grape must fermentation ... 3
1.1. Grape must fermentation pathways ... 3
1.2. Grape must microflora and its impact on wine organoleptic character ... 5
1.3. Commercial S. cerevisiae strains ... 8
1.4. Critical factors on grape must fermentation... 8
2. Genomics overview ... 9
2.1. Genomic techniques overview for yeasts’ identification by molecular methods 10 2.2. Genomic techniques for S. cerevisiae strains differentiation... 11
3. Objectives ... 13
Methods ... 15
1. Wine must collection and fermentation ... 17
2. Yeasts isolation and cryopreservation ... 18
3. Genomic DNA isolation ... 19
4. Yeasts identification ... 19
5. Genomic fingerprinting by microsatellite amplification ... 22
Results and Discussion ... 25
1. Introduction ... 27
2. Wine cellar biodiversity study ... 27
2.1. Yeasts’ isolation and identification ... 27
2.2. S. cerevisiae genotyping ... 29
3. Biodiversity of white wine fermentations at low temperatures ... 34
3.1. Spontaneous fermentations kinetics ... 34
3.2. Yeasts’ isolation and identification ... 35
3.3. S. cerevisiae genotyping ... 38
3.2.1. Effect of temperature on strains diversity... 40
4. Allelic frequency and heterozygosity of the Portuguese S. cerevisiae population .... 42
4.1. Allelic frequency of S. cerevisiae population of each wine appellation ... 48
Conclusion ... 50
Annexes ... 54
Biodiversity of wine S. cerevisiae strains in Portuguese appellations
ii
Figures index
Figure 1. Metabolic overview of the alcoholic fermentation. ... 4
Figure 2. Basic chemical reaction of the malolactic fermentation. ... 5
Figure 3. Yeast population dynamic and the content of reducing sugars during fermentation (8). Legend: Δ - Content in reducing sugars, • - Yeast´s population. ... 6
Figure 4. Wine aroma precursors, their main stages of degradation during the wine biotechnological sequence and general impact on wine aroma of the odorants generated (40). ... 7
Figure 5. Recognition site of EcoRI. ... 10
Figure 6. Amplification region of ITS1 and ITS4 primers (20). ... 11
Figure 7. Results obtained with GenneMapper analyze software. ... 12
Figure 8. Number of yeast isolates from cellar fermentations in Portuguese wine appellation. ... 27
Figure 9. Wine yeasts isolation. ... 28
Figure 10. Eletrophoretic band profile on Labchip. ... 28
Figure 11. PCA of S. cerevisiae strains present at Alentejo fermentations. ... 29
Figure 12. PCA of S. cerevisiae strains present at Dão fermentations. ... 30
Figure 13. PCA of S. cerevisiae strains present at Douro fermentations. ... 31
Figure 14. PCA of S. cerevisiae strains present at Touriga Nacional variety from Alentejo, Douro and Dão fermentations. ... 31
Figure 15. PCA of S. cerevisiae strains present at Alentejo, Douro and Dão fermentations. ... 32
Figure 16. Cluster of S. cerevisiae strains from Alentejo, Dão and Douro wine appellations. ... 33
Figure 17. Fermentations kinetics. ... 35
Figure 18. Biodiversity of Bical spontaneous fermentations. ... 36
Figure 19. Biodiversity of Maria Gomes spontaneous fermentations. ... 37
Figure 20. PCA of S. cerevisiae strains present at Bical fermentations. ... 39
Figure 21. PCA of S. cerevisiae strains present at Maria Gomes fermentations. ... 39
Figure 22. PCA of S. cerevisiae strains present at Bical fermentations from different fermentation temperatures. ... 40
Figure 23. PCA of S. cerevisiae strains present at Bical from 12ºC fermentations from different temperatures of isolation (12ºC and 30ºC). ... 40
Figure 24. PCA of S. cerevisiae strains present at Maria Gomes fermentations from different fermentation temperatures (12°, 18° and 25°C). ... 41
Biodiversity of wine S. cerevisiae strains in Portuguese appellations
iii
Tables index
Table 1. Grape variety from Portuguese appellations. ... 17
Table 2. Fermentation temperature and code. ... 18
Table 3. MET2 gene PCR run program. ... 20
Table 4. ITS PCR run program. ... 20
Table 5. ITS fragment size and corresponding species (adapted from (20, 18)). ... 21
Table 6. Characteristics and polymorphism of 11 loci (28). ... 22
Table 7. Multiplex A PCR run program. ... 23
Table 8. Multiplex B PCR run program. ... 23
Table 9. Amount of strains from Bairrada spontaneous fermentations. ... 38
Table 10. Allelic frequency in 911 strains S. cerevisiae of the multiplex A microsatellite. 43 Table 11. Allelic frequency in 911 strains S. cerevisiae of the multiplex B microsatellite. 45 Table 12. Characteristics of 11 microsatellite loci for the characterization of S. cerevisiae strains. ... 48
Annexes index
Annex A 1. Cluster of S. cerevisiae strains present at Baga fermentation from Bairrada wine appellation. ... 56Annex A 2. Cluster of S. cerevisiae strains present at Maria Gomes fermentation from Bairrada wine appellation. ... 56
Annex A 3. Cluster of S. cerevisiae strains present at Bical fermentation from Bairrada wine appellation. ... 57
Annex B 1. Table of the allelic frequency of Alentejo S. cerevisiae strains of the multiplex A microsatellites. ... 58
Annex B 2. Table of the allelic frequency of Alentejo S. cerevisiae strains of the multiplex B microsatellites. ... 59
Annex B 3. Table of the allelic frequency of Bairrada S. cerevisiae strains of the multiplex A microsatellites. ... 60
Annex B 4. Table of the allelic frequency of Bairrada S. cerevisiae strains of the multiplex B microsatellites. ... 62
Annex B 5. Table of the allelic frequency of Dão S. cerevisiae strains of the multiplex A microsatellites. ... 64
Annex B 6. Table of the allelic frequency of Dão S. cerevisiae strains of the multiplex B microsatellites. ... 65
Annex B 7. Table of the allelic frequency of Douro S. cerevisiae strains of the multiplex A microsatellites. ... 66
Annex B 8. Table of the allelic frequency of Douro S. cerevisiae strains of the multiplex B microsatellites. ... 67
Biodiversity of wine S. cerevisiae strains in Portuguese appellations
Biodiversity of wine S. cerevisiae strains in Portuguese appellations
1
Introduction
Biodiversity of wine S. cerevisiae strains in Portuguese appellations
Biodiversity of wine S. cerevisiae strains in Portuguese appellations
3
1. Grape must fermentation
1.1. Grape must fermentation pathways
During the last 30 years, major progress was achieved in the understanding of the ecology, biochemistry, physiology and molecular biology of yeasts, and in particular of their importance in wine production. To strategically tailor wines in a changing market, winemakers find the alcoholic fermentation as the key process that they can creatively engineer wine character and value (16).
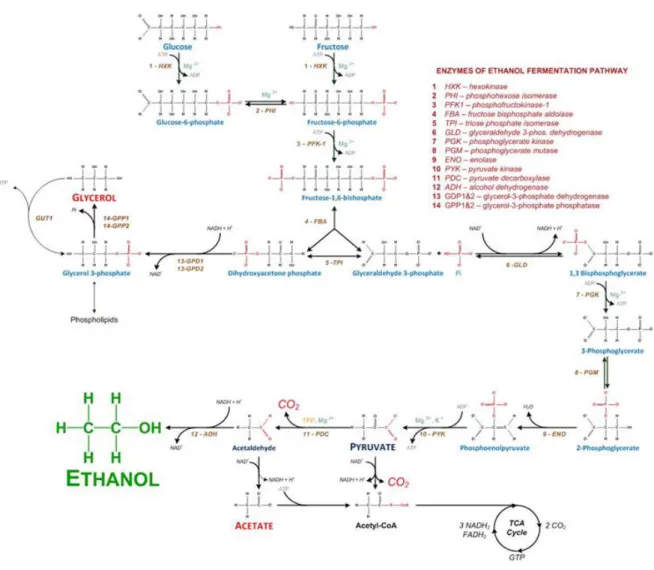
The wine is achieved after two sequential fermentations: the alcoholic fermentation and the malolactic fermentations. The alcoholic fermentation is the foundation of the transformation of grapes into wine and is conducted by yeasts of the genus Saccharomyces. The yeasts present on the grape must convert its glucose, fructose and sucrose into ethanol via the process of fermentation. In the overall fermentation, glucose (C6H12O6) is converted into ethanol (CH3CH2OH) and carbon dioxide (CO2), which is released in the form of gas. During glycolytic pathway, one glucose molecule is converted into two ethanol molecules and two carbon dioxide molecules (Figure 1).
Biodiversity of wine S. cerevisiae strains in Portuguese appellations
4
Figure 1. Metabolic overview of the alcoholic fermentation.
In this process, one molecule of glucose is broken down into pyruvate and during this reaction two molecules of NADH and of ATP are generated. Pyruvate is then converted into acetaldehyde and carbon dioxide by pyruvate decarboxylase. Afterwards, the acetaldehyde is reduced to ethanol, using the previously produced NADH molecule, which is converted into NAD+ (1). The malolactic fermentation is carried out by acid lactic bacteria such as Oenococcus oeni, Lactobacillus ssp., Leuconostoc spp.. Indeed
Oenococcus oeni is the ideal species used to conduct this fermentation due to its tolerance
to low pH and flavor metabolites produced. By a process of deacidification it is able to convert the dicarboxylic L-malic acid (malate) into the monocarboxylic L-lactic acid (lactate) and carbon dioxide (Figure 2) (29). This fermentation is an additional step to confer a distinct flavor and smooth texture to the wine (30, 26). The bacterial activity plays a role in stabilization of wine and ensures an enrichment of its aromatic composition (34).
Biodiversity of wine S. cerevisiae strains in Portuguese appellations
5 Since our aim is to study yeasts and this process is done by bacteria it won’t be target of our study.
Figure 2. Basic chemical reaction of the malolactic fermentation.
1.2. Grape must microflora and its impact on wine organoleptic character
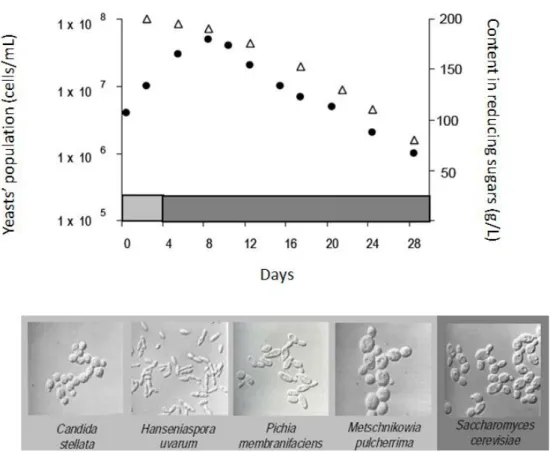
A spontaneous wine fermentation is carried out by the sequential action of different genus and species of yeasts and bacteria (22). The fermentative microflora is reliant on a diverse network of factors such as the origin of the grapes, the winemaking technique and phytosanitary conditions of the grapes and cellars. Indeed, in our previous studies, we have already demonstrated that grape berries are a great reservoir for S. cerevisiae. The alcoholic fermentation is usually started by the non-Saccharomyces yeasts and then completed by S. cerevisiae, who can resist to high ethanol concentration and have high fermentative power. Yeast species within Hanseniaspora, Candida, Kluyveromyces,
Zigosaccharomyces genera are the non-Saccharomyces yeasts most commonly present at
Biodiversity of wine S. cerevisiae strains in Portuguese appellations
6
Figure 3. Yeast population dynamic and the content of reducing sugars during fermentation (8). Legend: Δ - Content in reducing sugars, • - Yeast´s population.
Yeasts affect wines’ sensorial properties by different mechanisms that extend far beyond the glycolytic pathway, namely the grape juice and the nitrogen metabolism, enzymatic hydrolysis of grape components that affect wine aroma, flavor and clarity, yeasts autolysis and yeast bioadsorption properties. Nowadays, it is accepted that the metabolic profiles from different yeast species and strains are singular, so it is important to carry out an extensive strain screening to understand the positive and negative contributions of each strain (16). Also, such a wide screen will allow us to unveil the metabolic biodiversity which can afterwards bring value to wines.
Ethanol is the second most abundant compound in wine, being water the first. Ethanol’s affinity to water and its solubility, by forming hydrogen bonds, makes it a powerful dehydrator. This property is useful in flocculating hydrophilic colloids, proteins and polysaccharides. It also gives ethanol disinfectant properties that are particularly valuable in aging wines. The combination of ethanol and acidity makes it possible to keep wine for a long time without any noticeable spoilage. The addition of ethanol to stabilize certain wines is a long-standing winemaking tradition seen in the Port winemaking. Ethanol’s
Biodiversity of wine S. cerevisiae strains in Portuguese appellations
7 solvent properties are involved in solubilizing certain odoriferous molecules and definitely contribute to the expression of aromas in wine (36). Several monoterpene alcohols occur naturaly on grapes such as citronellol, geraniol, linalool and nerol providing distinct fruity, estery, spicy and vegetative aromas. Yeasts are able to produce glycosidases that break down the covalent link between trepenes and glucose so that volatile trepenes are released and impact on wine organoleptic character. The production of glycosidases varies with species and strains, and some authors suggest that non-Saccharomyces like Hanseniaspora,
Debaryomyces and Dekkera are stronger producers of such enzymes when compared to the S. cerevisiae (16). Saccharomyces also produces acetic acid but generally not in a
concentration above the threshold for detection. Nevertheless, many commercial strains are available with little to no acetic acid production.
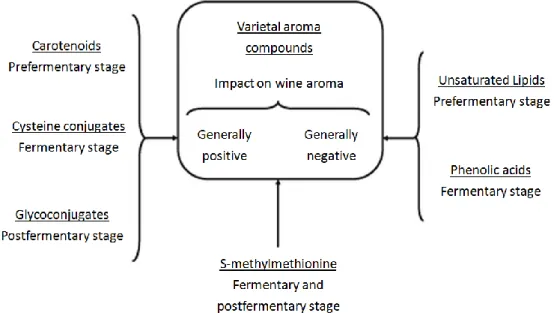
There are numerous wine aroma precursors at different fermentation stages and they can have a positive or negative impact on wine aroma (Figure 4). There are several spoilage species, which produce metabolites that give bad flavor to the wine. The most common species are Brettanomyces/Dekkera bruxellensis and Zigossacharomyces bailii. The yeast Brettanomyces/Dekkera produces 4-ethyl phenol which confers an unpleasant horse seat aroma. Some examples of spoilage bacteria are: Lactobacillus (4), some species of Acetobacter (3) and Glucanobacter oxydans. A case of a bad flavor precursor is the acetic acid produced via ethanol consumption by acetic acid bacteria, giving a vinegar flavor to wine.
Figure 4. Wine aroma precursors, their main stages of degradation during the wine biotechnological sequence and general impact on wine aroma of the odorants generated (40).
Biodiversity of wine S. cerevisiae strains in Portuguese appellations
8
1.3. Commercial S. cerevisiae strains
A constant risk for the producer are stuck fermentations, this origins great lost of investment. To guarantee a successful fermentation, winemakers currently apply dry yeast to the grape must (40). They have several characteristics that make them chosen, for example, its high fermentative power, tolerance to high alcohol concentration, synthesis of metabolites that originate desired sensorial properties and the absence of production of undesirable compounds. Thus, these yeasts provide greater efficiency and speed of fermentation. One of the most significant advantages of commercial yeast usage is that they can add a desired organoleptic characteristic. However, this procedure has serious consequences on the production of different regional wines and it leads to a gradual replacement of the indigenous microflora. This leads to a standardization of organoleptic characteristics of wines, which become more similar to popular wines in international markets and this can originate a loss of competitiveness of local wines (7).
1.4. Critical factors on grape must fermentation
Non-Saccharomyces yeasts grow during the early stage of the alcoholic fermentation as they have a low fermentative power and low resistance to high ethanol concentrations (21). As the ethanol concentration rises up to about 5%, it denatures proteins leading to cell death. Nevertheless, the ethanol tolerance varies from strain to strain. At the physiological level there are some traits that are particularly important for wine strains of
Saccharomyces, such as, reasonable rate of fermentation, predictable fermentation
characteristics, high ethanol and good temperature tolerance, sulfur dioxide tolerance, no production of hydrogen sulfide, acetic acid and ethyl carbamate, killer factor resistance and production of desired aroma and flavor characters.
Considering fermentation kinetics, it is problematic if they are too fast as well as too slow. If the kinetics is too fast, the fermentation may reach a high temperature, due to the rate of heat released from metabolism and may also lead to an increased loss of volatile components. Conversely, if kinetics is too slow, then it will take longer to the ethanol conversion increase, and allows for growing of non-Saccharomyces organisms, which can
Biodiversity of wine S. cerevisiae strains in Portuguese appellations
9 produce unwanted metabolites and also becomes difficult to distinguish from a problematic fermentation. Temperature is another key factor that affects directly the microbial ecology of the grape must and its biochemical reactions (45). Temperature is a growth modeler, since Saccharomyces and Saccharomyces show differential growth rates. Some
non-Saccharomyces have a better ability to grow at low temperature fermentations than the Saccharomyces. This may happen because they have an increased tolerance to ethanol at
low temperatures (17, 45). Grape must is frequently fermented at extremes of temperature to which Saccharomyces is tolerant. It is critical that if commercial strains are used they must not be inhibited by heat or by cold conditions. White wines are generally fermented at a temperature lower than the optimal to S. cerevisiae growth (12-14°C), while many red wines are fermented at temperatures at the upper limit of S. cerevisiae growth (35-42°C). If a commercial yeast is used it is also important that the yeast strains are tolerant to sulfur dioxide, which is used as an antimicrobial agent. Saccharomyces is able to survive in the presence of sulfur dioxide by metabolizing the SO2 via the formation of acetaldehyde adjuncts.
2. Genomics overview
Understanding biological diversity at the whole genome level will provide insights into the origins of individual traits. Since we are now living in a post-genomic era progress at the comparative, structural, evolutionary and functional genomics level is seen. Nevertheless, bioinformatics is giving a great help as the number of results is increasing and the analysis is complex. New generation genomic tools were developed in order to speed up and improve the results obtained. The implementation of molecular tools has rapidly enhanced our knowledge of prokaryote abundance, diversity and function (9). Since new yeasts genome fingerprinting techniques are now available, there has been an exponential increase in yeasts genome studies accompanied by great progress in the understanding of yeasts strains diversity.
Biodiversity of wine S. cerevisiae strains in Portuguese appellations
10
2.1. Genomic techniques overview for yeasts’ identification by molecular methods
MET2 gene analysis is based on the principle of RFLP and Hansen & Kielland-Brandt (1994) used it for the identification of wine yeasts, S. cerevisiae and S. bayanus (23). RFLP technique comprises the breaking of the DNA by restriction enzymes in certain regions with base sequences and the separation of the resulting fragments by electrophoresis. Different profile bands or polymorphisms can be observed, thus exposing a genetic fingerprint of the organism. The MET2 gene codes for synthesis of homoserine acetyltransferase and the DNA sequences of this gene differ for these two species. Complimentary oligonucleotides amplify a part of the gene located on the outer flanks and a 580 bp amplicon is obtained. Restriction endonucleases, EcoRI and PstI, are used to cleave the MET2 gene amplicon of S. cerevisiae and S. bayanus, respectively (32). In the case of EcoRI, two fragments (369 bp, 211 bp) are obtained when the MET2 gene product of S. cerevisiae is cleaved (Figure 5). EcoRI doesn’t cut S. bayanus’ MET2 gene. For PstI the reverse effect occurs, whereby two fragments (365 bp, 215 bp) for S. bayanus are visible and no fragment is visualized in S. cerevisiae.
Figure 5. Recognition site of EcoRI.
Also the fact that the rDNA occurs in multiple copies, reflecting the need to produce large quantities of ribosomal subunits in cells, has facilitated its RFLP analysis, and the polymorphism allowed the differentiation of both species and strains. It should be noted that almost all the restriction sites that allow discrimination of individual strains are located in the hyper variable region of the intergenic spacer (13). The non-transcribed areas from ribosomal genes such as 18S gene, ITS region and 26S gene have been widely used by various authors to identify species in the Saccharomyces sensu stricto group (2, 43, 46, 8, 6, 47, 13). These transcription units are repeated between 100-200 times in the genome. Other regions include the internal transcribed spacer (ITS) (Figure 6) and external transcribed spacers (ETS), which are areas that are transcribed, but not processed. The transcription units are also separated by non-transcribed spacer (NTS).
Biodiversity of wine S. cerevisiae strains in Portuguese appellations
11 These ribosomal regions have developed into the chosen target regions to identify phylogenetic relationships between yeasts (20, 27, 11).
Figure 6. Amplification region of ITS1 and ITS4 primers (20).
2.2. Genomic techniques for differentiation of S. cerevisiae strains
In order to unveil the wide diversity of S. cerevisiae strains observed in wine fermentations there are several genotyping techniques that can be used to differentiate them, such as, pulsed field electrophoresis, mitochondrial DNA restriction, interdelta element amplification (28) and microsatellite fingerprint (41).
δ-sequences are present in the genome of S. cerevisiae, about 150-300 sequence repeats with a size of 300 bp. The interdelta sequences are repetitive DNA sequences present in the
S. cerevisiae genome that have an intrinsic variability in number and location. By using
specific primers it is possible to amplify the regions flanked by δ–sequences. The result of the PCR reaction is a mixture of fragments of sizes between 200 and 2000 bp. Since the inter-δ sequences distribution profile is highly variable in different S. cerevisiae strains, the molecular typing method has been used to differentiate oenological strains. These sequences have a good discriminatory power on commercial strains however they seem to have a lower discriminatory power on indigenous strains (41).
Another genotyping technique is the fingerprint of microsatellite or simple sequence repeat loci that are small DNA sequences tandem repeats (1-10 nucleotides) dispersed throughout the genome. Microsatellites present a high degree of variability which lead to their great discriminatory potential on the S. cerevisiae strains (41). Microsatellites are highly abundant in eukaryotic genomes but their function and evolution haven’t yet been well understood. Their elevated mutation rate makes them ideal markers of genetic differentiation.
Biodiversity of wine S. cerevisiae strains in Portuguese appellations
12
The complete sequence of the S. cerevisiae genome (25) has allowed the identification of these regions For the genotyping of S. cerevisiae, some of the most frequently utilized loci include YOR267C, SC8132X, SCPTSY7 (44); ScAAT1-ScAAT6 (41); YPL009C, C4, C5, C9 and C11 (28, 39). These loci can also be used for multiplex-PCR reactions where two or more loci are amplified as we can see in the GeneMapper software (Figure 7) (48, 39). Results are expressed as a number of repeats of the loci. These loci have been identified and used in studies to effectively discriminate between S. cerevisiae strains (14, 37, 44, 31) and evaluated to distinguish between commercially available yeast strains (41, 28, 5, 48). This technique has the same discriminatory resolution as interdelta regions, but less than electrophoretic karyotyping and has higher discriminatory power and it is more reproducible than RAPD and AFLP (12). The advantages of this technique are: the same method can be used in different organisms, computer compatibility, and highly reproducibility.
Biodiversity of wine S. cerevisiae strains in Portuguese appellations
13
3. Objectives
In this work we aim to identify and cluster Portuguese endogenous wine yeasts in order to uncover the natural richness of fermentative yeasts. We also will create a S. cerevisiae strain collection contributing to the preservation of S. cerevisiae genetic resources. To achieve this, we have established two specific objectives:
i) to carry out spontaneous wine must fermentations and isolate the microorganisms responsible for their fermentation;
ii) to characterize wine yeasts, by microsatellites amplification and other molecular approaches.
Biodiversity of wine S. cerevisiae strains in Portuguese appellations
Biodiversity of wine S. cerevisiae strains in Portuguese appellations
15
Methods
Biodiversity of wine S. cerevisiae strains in Portuguese appellations
Biodiversity of wine S. cerevisiae strains in Portuguese appellations
17
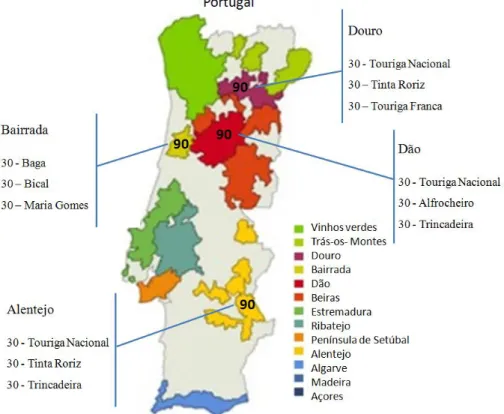
1. Wine must collection and fermentation
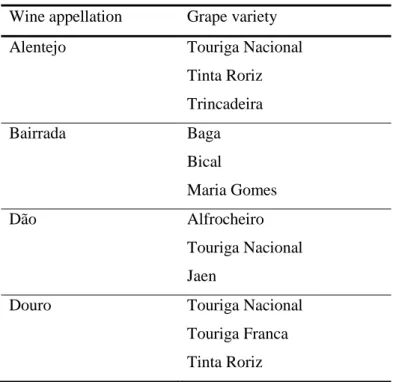
In order to have a representative sample of the Portuguese endogenous biodiversity, grape and wine samples were collected in different Portuguese wine appellations, such as, Alentejo, Bairrada, Dão and Douro. The different grape varieties studied here are described in Table 1.
Table 1. Grape variety from Portuguese appellations.
Wine appellation Grape variety
Alentejo Touriga Nacional
Tinta Roriz Trincadeira Bairrada Baga Bical Maria Gomes Dão Alfrocheiro Touriga Nacional Jaen
Douro Touriga Nacional
Touriga Franca Tinta Roriz
Grape and wine samples were collected, by the producers, in an appropriate bag and bottle, respectively, and sent to the laboratory in a cooled box. In the laboratory, grapes were crushed in a bag in aseptic conditions. Then the resulting must was placed in a sterile 500 mL erlenmeyer. All fermentations were carried out at room temperature except for some of the Bical and Maria Gomes fermentations that were tested with different fermentation temperatures, described in Table 2. The fermentation kinetic was followed every day by measuring the weight loss. Grape must samples were collected from each fermentation at three different moments: the initial must, the beginning of the fermentation (5 g/L loss), and the end (70 g/L loss). Samples from fermentations occurring in the cellar were collected at the beginning and at the end of the fermentation process. For each sampling stage 100 mL were filtered into falcon tubes and centrifuged at 4000 rpm. The pellet was collected and cryopreserved in 40% w/V glycerol at -80ºC.
Biodiversity of wine S. cerevisiae strains in Portuguese appellations
18
Table 2. Fermentation temperature and code.
Grape variety Fermentation temperature (°C) Fermentation code
Bical 12 BBi0817 BBi0917 BBi1117 18 BBi0818 BBi0918 BBi1118 25 BBi0819 BBi0919 BBi1119 Maria Gomes 12 BM1217 BM1317 BM1417 18 BM1218 BM1318 BM1418 25 BM1219 BM1319 BM1419
2. Yeasts isolation and cryopreservation
At the end of the fermentation, the filtered must, from the previous step were diluted to 10-4 times and plated in agar YPD medium (1% w/v yeast extract, 2% w/v glucose, 2% w/v peptone) and placed in an incubator at 30ºC during 48 hours so that yeasts could be isolated. For yeasts’ isolation from the 12°C fermentations three incubation temperatures were tested: 30°C, 12°C and 4°C for 48h. Pure cultures were isolated and grown in the same conditions and preserved in YPD liquid medium with 40% w/V glycerol at -80ºC.
Biodiversity of wine S. cerevisiae strains in Portuguese appellations
19
3. Genomic DNA isolation
DNA isolation was done on 1 mL pure cultures, cells were collected by centrifugation and washed twice with ultrapure water. Cells were then resuspended in 100 µL of lysis buffer (1 M sorbitol, 0,1M Na2-EDTA, 7,5 pH) and then 5 µL of lyticase (5U/µL) were added. The mixture was briefly vortexed and incubated at 37ºC during 1 hour. Then 100 µL of a second solution (50mM Tris-HCl, 20mM EDTA-Na2, 7,4 pH) and 5 µL of 10% w/v SDS were added, the mixture was vortexed and incubated at 65ºC during 10 minutes. After that, 80 µL of 5 M potassium acetate were added and the samples were incubated on ice during at least 10 minutes. The cellular debris and proteins present were pelleted by centrifugation and the supernatant, containing the DNA was collected into a new tube with 1 volume of isopropanol. The solution was mixed and incubated for 10 minutes at -20ºC allowing for DNA precipitation, which was then recovered by another centrifugation step. The supernatant was discarded and the DNA pellet was washed with 70% ethanol and dried for 3 minutes under vacuum. Finally, DNA was resuspended in 50 µL of TE (10mM Tris-HCl, 1mM Na2-EDTA, 7,5 pH) and stored at -20ºC (38).
4. Yeasts identification
To rapidly discriminate between Saccharomyces and non-Saccharomyces yeasts, MET2 gene amplifications were performed in an Eppendorf thermal cycler using synthetic oligonucleotide primers for MET2. Amplifications were carried out in 25 μL reaction volumes containing 100 ng DNA, 1x reaction buffer (100mM Tris-HCl (pH 8,8 at 25 ºC, 500 mM KCl, 0,8% igepal), 1,7 mM MgCl2, 0,2 μM of each primer (MET2_F: CGA AAA CGC TCC AAG AGC TGG and MET2_R: GAC CAC GAT ATG CAC CAG GCA), 0,2 mM of each dNTP (Bioron) and 0,5 U/μL taq DNA polymerase. The cyclic program is described in Table 3. The EcoRI digestion was done on reactions of 50 μL where 20 μL of the PCR product, 5 μL of 10x NEbuffer EcoRI (Fermentas) and 0,5 μL of the EcoRI enzyme (20 U/μL) (Fermentas) were used. MET2 gene and resulting restriction fragments were analyzed on LabChip.
Biodiversity of wine S. cerevisiae strains in Portuguese appellations
20
Table 3. MET2 gene PCR run program.
Step Temperature (ºC) Time Number of cycles
Initial denaturation 94 3 minutes 1
Denaturation 94 1 min
Annealing 60 1 min 35
Extension 72 1 min and 30 sec
Final extension 72 5 min 1
Those isolates that showed no amplification by PCR of MET2 were classified as
non-Saccharomyces species, and were then identified by amplification of ITS gene region, in
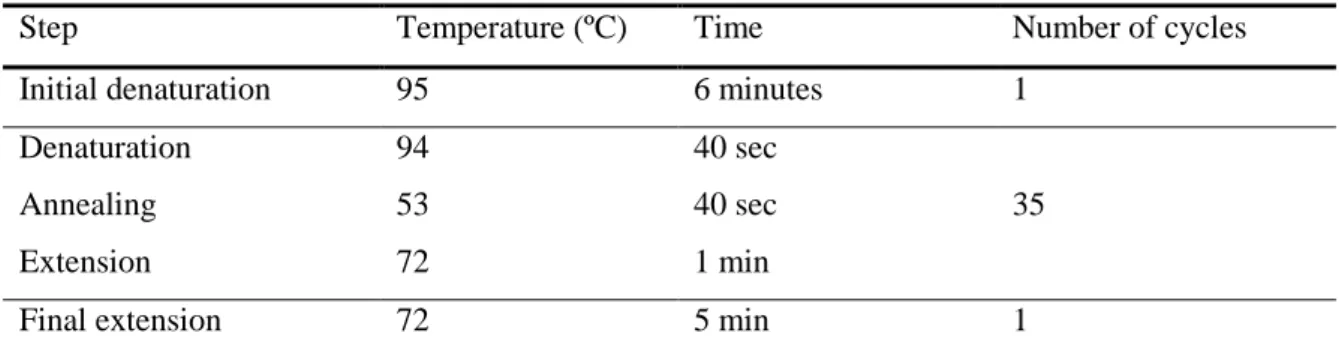
25 μL reaction volumes containing 100 ng DNA, 1x reaction buffer (100mM Tris-HCl (pH 8.8 at 25 ºC, 500 mM KCl, 0,8% igepal), 2 mM MgCl2, 0,4 μM of each primer (ITS1: TCC GTA GGT GAA CCT GCG G and ITS4: TCC TCC GCT TAT TGA TAT GC), 0,2 mM of each dNTP (Bioron) and 2,5 U/μL taq DNA polymerase. The cyclic program is described in Table 4. The PCR product was analyzed on LabChip® 90 and the size of the fragments compared with the values presented on Table 5.
Table 4. ITS PCR run program.
Step Temperature (ºC) Time Number of cycles
Initial denaturation 95 6 minutes 1
Denaturation 94 40 sec
Annealing 53 40 sec 35
Extension 72 1 min
Biodiversity of wine S. cerevisiae strains in Portuguese appellations
21
Table 5. ITS fragment size and corresponding species (adapted from (20, 18)).
Species Amplicon (bp) Schizosaccharomyces pombe 970 Saccharomyces bayanus 880 Saccharomyces cerevisiae Saccharomyces pastorianus Candida colliculosa 810 Torulaspora delbrueckii 803 Candida glabrata 800 Hanseniaspora uvarum 760 Kloeckera apiculata Saccharomyces ludwigii 758 Zygosaccharomyces baiili 750 Candida boidinii 700 Kluyveromyces thermotolerans 682 Candida tenuis 680 Candida famata 656 Debarymoces hansenii Candida zeylanoides 620 Pichia guilliermondii 606 Candida norvegica 580 Candida albicans 550 Candida tropicalis Candida parapsilosis 520 Dekkera anómala 514 Brettanomyces bruxellensis 500 Candida stellata Dekkera intermédia Pichia membranaefaciens Issatchenkia orientalis 494 Candida sake 470 Pichia fermentans Pichia kluyveri Dekkera bruxellensis 459 Metschnikowia pulcherrima 390
Biodiversity of wine S. cerevisiae strains in Portuguese appellations
22
5. Genomic fingerprinting by microsatellite amplification
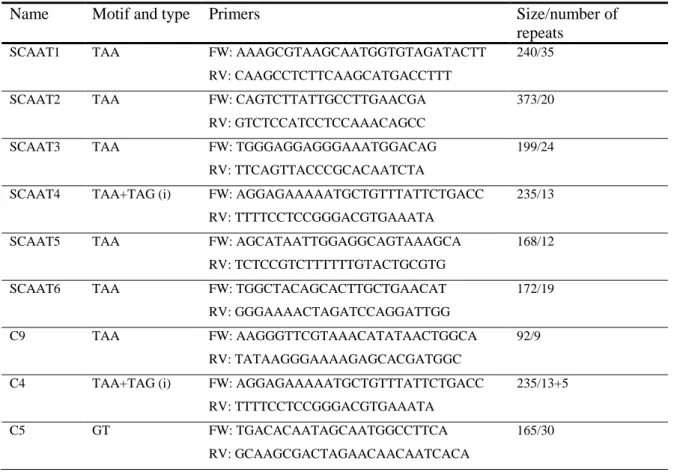
In order to group S. cerevisiae strains the amplification of microsatellites was done. The eleven microsatellite loci described as ScAAT1, ScAAT2, ScAAT3, ScAAT4, ScAAT5, ScAAT6, SYOR267c, C4, C5, C9 and C11 (Table 6) were amplified in two multiplex reactions using 25-100 ng of template DNA (28). The first multiplex reaction (A) contained 0,016 µM of ScAAT1F (F- forward), ScAAT1R (R-reverse), ScAAT3F and of ScAAT3R, 0,0068 µM of ScAAT2F, 0,039 µM of ScAAT2R, 0,015 µM of ScAAT4F and of ScAAT4R, 0,00078 µM of ScAAT5F and 0,013 µM of ScAAT5R. The second multiplex reaction (B) contained 0,0115 µM of ScAAT6F, 0,015 µM of ScAAT6R, 0,01 µM of SYOR267cF, SYOR267cR, C5F, and of C5R, 0,02 µM of C4F, 0,025 µM of C4R, 0,009 µM of C9F and of C9R, 0,015 µM of C11F and 0,02 µM of C11R. The forward primer of all microsatellite was labelled with fluorescent dye. In both multiplexes the total volume of the reaction was 10 µL and the run was done in an Eppendorf thermal cycler. The run program for each reaction is described on Table 7 and Table 8.
Table 6. Characteristics and polymorphism of 11 loci (28).
Name Motif and type Primers Size/number of
repeats
SCAAT1 TAA FW: AAAGCGTAAGCAATGGTGTAGATACTT 240/35
RV: CAAGCCTCTTCAAGCATGACCTTT
SCAAT2 TAA FW: CAGTCTTATTGCCTTGAACGA 373/20
RV: GTCTCCATCCTCCAAACAGCC
SCAAT3 TAA FW: TGGGAGGAGGGAAATGGACAG 199/24
RV: TTCAGTTACCCGCACAATCTA
SCAAT4 TAA+TAG (i) FW: AGGAGAAAAATGCTGTTTATTCTGACC 235/13
RV: TTTTCCTCCGGGACGTGAAATA
SCAAT5 TAA FW: AGCATAATTGGAGGCAGTAAAGCA 168/12
RV: TCTCCGTCTTTTTTGTACTGCGTG
SCAAT6 TAA FW: TGGCTACAGCACTTGCTGAACAT 172/19
RV: GGGAAAACTAGATCCAGGATTGG
C9 TAA FW: AAGGGTTCGTAAACATATAACTGGCA 92/9
RV: TATAAGGGAAAAGAGCACGATGGC
C4 TAA+TAG (i) FW: AGGAGAAAAATGCTGTTTATTCTGACC 235/13+5
RV: TTTTCCTCCGGGACGTGAAATA
C5 GT FW: TGACACAATAGCAATGGCCTTCA 165/30
Biodiversity of wine S. cerevisiae strains in Portuguese appellations
23
Name Motif and type Primers Size/number of
repeats
C11 GT FW: TTCCATCATAACCGTCTGGGATT 203/20
RV: TGCCTTTTTCTTAGATGGGCTTTC
SYOR267c TGT FW: TACTAACGTCAACACTGCTGCCAA 186/21
RV: GGATCTACTTGCAGTATACGGG (i) – imperfect motif.
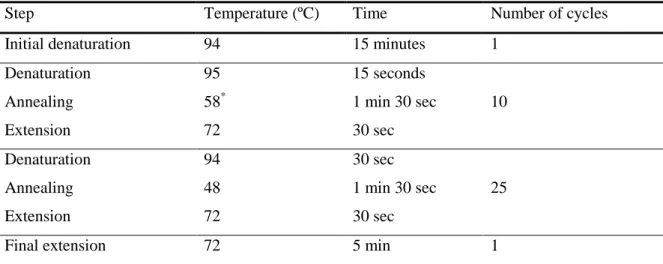
Table 7. Multiplex A PCR run program.
Step Temperature (ºC) Time Number of cycles
Initial denaturation 94 15 minutes 1
Denaturation 95 15 seconds
Annealing 58* 1 min 30 sec 10
Extension 72 30 sec
Denaturation 94 30 sec
Annealing 48 1 min 30 sec 25
Extension 72 30 sec
Final extension 72 5 min 1
*
- decrease of one degree at each cycle.
Table 8. Multiplex B PCR run program.
Step Temperature (ºC) Time Number of cycles
Initial denaturation 95 15 minutes 1
Denaturation 94 30 sec
Annealing 53 30 sec 34
Extension 68 1 min
Final extension 68 10 min 1
The amplified PCR products were then analysed on the Sanger sequencer. For this, 7,5 µL of formamide and 0,5 µL of molecular size standard (Liz Genescan 600 Rox Applied Biosystems) were added to 1 µL of the PCR product. This mix was transferred to a Bioplatics 96x0,2 ml plate and denatured for 3 minutes at 95ºC and then kept on ice to cool down. The plate was then loaded on the AB 3500 genetic analyzer (Applied Biosystems) and the program Fragment Analysis Assay run. The analysis was done using the BioNumerics (Applied Maths) with the clustering Jaccard correlation UPGMA and the Principal component analysis (PCA).
Biodiversity of wine S. cerevisiae strains in Portuguese appellations
Biodiversity of wine S. cerevisiae strains in Portuguese appellations
25
Results and Discussion
Biodiversity of wine S. cerevisiae strains in Portuguese appellations
Biodiversity of wine S. cerevisiae strains in Portuguese appellations
27
1. Introduction
Given that the alcoholic fermentation is a key process on winemaking and that yeasts have the major role at this process, it is the objective of this work to monitor the biodiversity of the fermentative yeasts and genotype S. cerevisiae since they represent the majority fermentative population. In order to do so, we studied the wine cellar biodiversity and white wine spontaneous fermentations at low temperatures.
2. Wine cellar biodiversity study
2.1. Yeasts’ isolation and identification
Yeasts were isolated from wine cellar fermentations in order to exploit the endogenous biodiversity of the wine cellar. This study was done in four Portuguese wine appellations: Alentejo, Bairrada, Dão and Douro. From all the 12 fermentations 30 yeasts were isolated at the end of the fermentation to gather information of the fermentative microflora.
Biodiversity of wine S. cerevisiae strains in Portuguese appellations
28
From the three grape varieties from the four regions, 30 yeasts were isolated each makes a total of 360 yeasts from wine cellars fermentations (Figure 8). The isolation was done by inoculating a wine sample in YPD medium. Wine yeasts were isolated following classical microbiology procedures. We successfully achieved the isolation of pure cultures of the fermentative population (Figure 9).
Figure 9. Wine yeasts isolation.
a) Wine yeast isolation on YPD medium. b) Pure yeast colonies isolated from the first plate.
After having effectively extracted the DNA from each yeast isolate and diluted it to 100 ng, the identification was attempted by the MET2 gene amplification and enzymatic restriction. In S. cerevisiae the MET2 gene amplification generates a fragment of 580 bp and its EcoRI restriction profile corresponds to two bands, of 369 and 211 bp each. The PCR product of the MET2 gene amplification followed by the enzymatic restriction with EcoRI, run in Labchip (Figure 10), showed a high number of Saccharomyces cerevisiae present at the end of the fermentation as expected (35, 22, 15).
Figure 10. Eletrophoretic band profile on Labchip.
a) MET2 gene amplification eletrophoretic band profile. b) Restriction of MET2 gene with EcoRI eletrophoretic band profile.
All the fermentations carried out at the cellars had an homogeneous population of S.
cerevisiae, which is in line with the described yeast populations in wine cellars. At Douro
appellation, commercial strains of S. cerevisiae were added to the Touriga Nacional and Tinta Roriz fermentations, so the S. cerevisiae abundance found was also expected.
Biodiversity of wine S. cerevisiae strains in Portuguese appellations
29
2.2. S. cerevisiae genotyping by microsatellite amplification
All S. cerevisiae strains isolated from wine cellar fermentations were tested with the 11 loci and then clustered in order to have a strain differentiation. The clustering was done with all microsatellite loci except for the ScAAT4 since its amplification in the multiplex A reaction was not favored, and not fully optimized, specially for poor DNA quality samples.
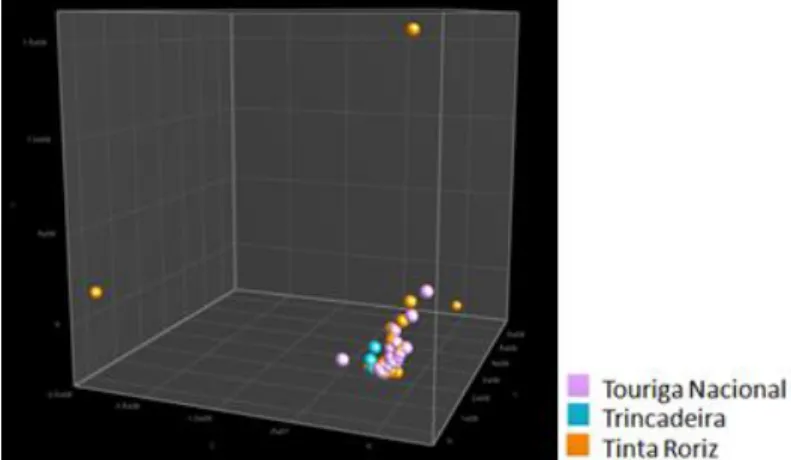
From Alentejo wine appellation three different grape varieties were studied. A total of 58 strains were identified by clustering the three fermentations. Touriga Nacional variety had 16 S. cerevisiae strains, Trincadeira had 21 strains and Tinta Roriz had 25 strains discriminated by microsatellites amplification. For a more global understanding of the proximity of the strains we made a Principal Component Analysis (PCA). Below we can observe that the majority of the strains are very close when we look from the three dimensional point of view, except for three isolates from Tinta Roriz fermentation, showing a similar endogenous yeast population, but the strains are still distinct (Figure 11).
Figure 11. PCA of S. cerevisiae strains present at Alentejo fermentations.
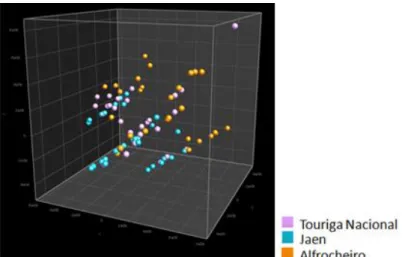
From Dão wine appellation a total of 79 strains were identified by clustering the three fermentations. Touriga Nacional fermentations had 29 S. cerevisiae strains, Jaen had 28 strains and Alfrocheiro had 24 strains discriminated. The discriminative power was also very high but in fact some strains have the same microsatellites, differing only in one of the microsatellites tested. The strains from Dão fermentations seem to be all somehow related, not clustering according to the grape variety (Figure 12). Only some of the
Biodiversity of wine S. cerevisiae strains in Portuguese appellations
30
Alfrocheiro strains are clustering with strains from the same fermentation. This result shows the great diversity of the endogenous population from the wine cellar.
Figure 12. PCA of S. cerevisiae strains present at Dão fermentations.
Strains isolated at the end of the fermentations of the grape varieties Touriga Nacional, Jaen and Alfrocheiro.
From Douro wine appellation three different grape varieties were also studied. A total of 71 strains were identified by clustering the three fermentations. At the Touriga Nacional fermentation were found 28 S. cerevisiae strains, at Touriga Franca 29 strains and at Tinta Roriz 21 strains. The discriminative power was very high but still some of the strains are related (Figure 13). This result was expected since different commercial strains were used in each fermentation of this wine appellation. In fact, only one different S. cerevisiae strain was applied to each one of the Douro’s fermentation and at the end of the fermentation we observed large strain diversity. Indeed, the initial strain suffered several divisions along the fermentation and during this divisions can occur genomic phenomena that can origin new related strains. For what concerns the fermentations from this appellation, we should have compared the microsatellite profile of the commercial yeast inoculated to conclude if the fermentation was carried out by the applied yeast, but unfortunately we didn’t have access to it.
Biodiversity of wine S. cerevisiae strains in Portuguese appellations
31
Figure 13. PCA of S. cerevisiae strains present at Douro fermentations.
Strains isolated at the end of the fermentations of the grape varieties Touriga Nacional, Touriga Franca and Tinta Roriz.
Comparing all the Touriga Nacional fermentations from Alentejo, Dão and Douro wine appellations we observe that there are strains close to each other, but there are also strains characteristic of their wine appellation (Figure 14). Alentejo strains already clustered together, so here it was already expected to observe this result. These results show the importance of the preservation of endogenous population.
Figure 14. PCA of S. cerevisiae strains present at Touriga Nacional variety from Alentejo, Douro and Dão fermentations.
Comparing all the strains of the fermentations from Alentejo, Dão and Douro, it is clear that each population clusters apart, but still, there are some strains that are closely related to some of the strains from other appellations (Figure 15). Strains from Dão seem to be divided in three baselines but each one does not represent isolates from just one fermentation.
Biodiversity of wine S. cerevisiae strains in Portuguese appellations
32
Figure 15. PCA of S. cerevisiae strains present at Alentejo, Douro and Dão fermentations.
When comparing all S. cerevisiae strains form the same three wine appellations, by clustering them with the Bionumerics UPGMA tool, we observe that the majority of the strains seem to cluster according to the wine appellation (Figure 16). There are no strains in common in these wine appellations, so there is a characteristic population of S.
cerevisiae strains of each wine appellation.
For what concerns the wine cellar fermentations from Bairrada wine appellation, at Baga variety fermentation we observed 27 different S. cerevisiae strains (Annex A 1). In the Maria Gomes variety fermentation 19 strains were differentiated from the 30 yeasts isolated (Annex A 2). In the Bical variety fermentation 25 strains were obtained (Annex A 3). The majority of the strains are very similar, showing a connected population for each one of the grape varieties.
Each one of the S. cerevisiae population found at the fermentations on the cellar could be explained by the resident yeast population at the winery (33). The samples studied from wine cellar fermentations gave us key information about the microflora responsible for the metabolic profile of each variety and wine appellation. In the fermentations that didn’t suffer the appliance of commercial strains the biodiversity found represents the autochthonous yeast population characteristic from each fermentation, wine cellar and wine appellation.
Biodiversity of wine S. cerevisiae strains in Portuguese appellations
33
Figure 16. Cluster of S. cerevisiae strains from Alentejo, Dão and Douro wine appellations. Cluster done using the Bionumerics UPGMA tool.
Biodiversity of wine S. cerevisiae strains in Portuguese appellations
34
3. Biodiversity of white wine fermentations at low temperatures
White wines fermentations are carried out at low temperatures to maximize the organoleptic properties of the wines and to preserve their floral and fruity properties (1). Therefore, it is necessary to use yeasts strains that are able to carry out the fermentations at such low temperatures. Considering this, we have carried out spontaneous fermentations of white grapes (Bical and Maria Gomes), at different temperatures (12°, 18° and 25°C), and then isolate the present microorganisms that were responsible for their fermentation.
3.1. Spontaneous fermentations kinetics
In the spontaneous fermentations that were carried out in the laboratory, kinetics was followed by monitoring the weight loss: we have considered a 2 g/L loss the beginning of the fermentation and a 70 g/L loss the end of the fermentation. Almost all fermentations reached the end, except for the two Bical fermentations at 18°C (Figure 17). This was due to a calculation error that led us to think that the fermentation had already reached the end, so these two samples represented the middle of the fermentations. The wine must fermentations were successfully followed until the end where we were able to isolate the fermentative yeasts. As expected the fermentations at 25°C had faster kinetics than those carried out at 12°C. It should be noted that the BBi1119 was the fermentations with faster kinetics, which corresponds to fermentations at 25°C of the Bical grape variety. As Bical, the Maria Gomes fermentation at 25°C (BM1219) was the fermentation with faster kinetics.
Biodiversity of wine S. cerevisiae strains in Portuguese appellations
35
Figure 17. Fermentations kinetics.
a) Fermentation kinetics of Maria Gomes variety fermentations. b) Fermentation kinetics of Bical
variety fermentations. 17 represent a fermentation that occurred at 12°C, 18 a fermentation at 18°C and 19 a fermentation at 25°C.
3.2. Yeasts’ isolation and identification
We then studied the yeast biodiversity of these fermentations. The yeasts’ isolation was according to the usual grow rate at 30°C, but for the 12° and 4°C colonies took more days to grow. For 12°C isolation took approximately 15 days. At 4°C colonies took in most cases a month to grow. This was predictable since by lowering the temperature we are increasing the yeasts’ stress. The Bical fermentations that occurred at 25°C were carried out by a population of only S. cerevisiae (Figure 18). Likewise, the fermentations at 18°C were mostly carried out by S. cerevisiae, except in the Bical 08 fermentation where one isolate of Candida zemplinina was present. For the fermentations that were carried out at 12°C isolated yeasts were grown at three different incubation temperatures: 30°C, 12°C and 4°C. In Figure 18 we can observe the differences in the fermentative population, while at 30°C we are favouring the S. cerevisiae growth, when decreasing the incubation
Biodiversity of wine S. cerevisiae strains in Portuguese appellations
36 temperature, we are favouring the non-Saccharomyces growth. At the incubation temperature of 12°C we have isolated H. uvarum from Bical variety (BBi08). From this fermentation, we have also isolated M. pulcherrima and C. zemplinina (grown at 4°C) and
S. cerevisiae (grown at 30°C). On the Bical 09 fermentation, we have isolated M. pulcherrima when isolating at 4° and 12°C, and S. cerevisiae when yeasts were isolated at
30°C.
Figure 18. Biodiversity of Bical spontaneous fermentations.
Biodiversity of Bical spontaneous fermentations that occurred at different fermentation and isolation temperatures.
The Maria Gomes variety fermentations were also studied on samples from three different grape producers and at three different fermentation temperatures (25°, 18° and 12°C). The fermentations that occurred at 25°C and 18°C were all carried out by a population of S.
cerevisiae (Figure 19). However, in the fermentations at 12°C was also found the M. pulcherrima which represent the majority of the non-Saccharomyces population. Again,
yeasts’ isolation from the fermentations at 12°C was also made at three different incubation temperatures 30°C, 12°C and 4°C. From the isolations at 12°C we have observed K. thermotolerans and M. chrysoperlae in a very low account (1 and 2 yeasts isolates, respectively). It should be noted that at the fermentations at 12°C were also isolated S. cerevisiae which for the Mª Gomes 12 represents 50% of the fermentative population and around 80% for the sample 12 and 14 at the 12°C isolation temperature.
Biodiversity of wine S. cerevisiae strains in Portuguese appellations
37
Figure 19. Biodiversity of Maria Gomes spontaneous fermentations.
Biodiversity of Maria Gomes spontaneous fermentations that occurred at different fermentation and isolation temperatures.
Regarding the identification, only few yeast isolates were not identified because in that cases the DNA didn’t have good quality. The results obtained for the yeasts identification were in accordance with the literature since at the end of the fermentation where the pH is low and the ethanol concentration is high S. cerevisiae represents the majority of the population (15). This can be explained by their ability to tolerate high ethanol concentrations. Besides the high presence of S. cerevisiae strains on the studied fermentations, on the fermentations at 12°C the non-Saccharomyces stood out being able to achieve the end of the fermentations of Bical and Maria Gomes varieties. Several authors suggest that non-Saccharomyces can enhance their tolerance to ethanol at low temperatures and this could explain the fact that they appear at the end of the mentioned fermentations (42, 17, 24, 45). In Bairrada fermentations, the non-Saccharomyces that stand out is M. pulcherrima being present in almost all the spontaneous fermentations. The interest on the use of mixed starter cultures of Saccharomyces and non-Saccharomyces has increased. The aim of this method is to enhance the quality and complexity of wines. Different mixed starter cultures, such as S. cerevisiae and M. pulcherrima have been experimented and the result was a positive interaction that result in a significant reduction of the volatile acidity (10). Therefore, the M. pulcherrima isolated here could have enological potential for Bairrada wines.
Biodiversity of wine S. cerevisiae strains in Portuguese appellations
38 These results highlight that, despite of being mostly carried out by S. cerevisiae, in those fermentations the non-Saccharomyces populations also plays an important role, which could be of particular importance for the production of unique white wines.
3.3. S. cerevisiae genotyping by microsatellite amplification
In the laboratory, the S. cerevisiae isolates from the spontaneous fermentations from Bairrada were genotyped. The microsatellites analysis was done in the 529 S. cerevisiae isolated strains. At Bical fermentative population a total of 247 S. cerevisiae strains were differentiated and from Maria Gomes fermentative population 145 strains were differentiated (Table 9).
Table 9. Amount of strains from Bairrada spontaneous fermentations.
Grape variety Fermentation temperature (°C) Isolation temperature (°C) Number of S. cerevisiae Number of strains Bical 25 30 85 77 18 30 78 71 12 30 68 57 12 58 55 Maria Gomes 25 30 90 54 18 30 79 60 12 30 34 17 12 37 18
Strains from the grape samples of Bical variety fermentations seem to cluster, based in microsatellite profile, randomly, only the strains from the sample BBi09 cluster closely (Figure 20). This result was expected since fermentations from the same grape sample fermented at distinct temperatures.
Biodiversity of wine S. cerevisiae strains in Portuguese appellations
39
Figure 20. PCA of S. cerevisiae strains present at Bical fermentations.
17 represent a fermentation that occurred at 12°C, 18 a fermentation at 18°C and 19 a fermentation at 25°C.
At the Maria Gomes fermentation the strains seem to cluster according to the grape sample particularly 13 and 14 (Figure 21). This reveals that the endogenous yeast population from each vineyard is characteristic of each one.
Figure 21. PCA of S. cerevisiae strains present at Maria Gomes fermentations.
17 represent a fermentation that occurred at 12°C, 18 a fermentation at 18°C and 19 a fermentation at 25°C.
Biodiversity of wine S. cerevisiae strains in Portuguese appellations
40
3.2.1. Effect of temperature on strains diversity
We analyzed the variability of S. cerevisiae strains that were present at the end of the fermentations that occurred at 12ºC in Bical and Maria Gomes varieties, in order to understand the effect of temperature on the strains diversity. Here we observe strains from Bical fermentation where some strains that grow at 30ºC are also able to grow at 12ºC and both strains ferment at 12ºC (Figure 22). Several strains from this fermentation are closely related at the phylogenic level, and only some of the 12ºC fermentations are clustering apart.
Figure 22. PCA of S. cerevisiae strains present at Bical fermentations from different fermentation temperatures.
Figure 23 shows no clustering differentiation for the two isolation temperatures (30º and 12ºC). This result may be due to the fact that the fermentation where they come from is the same and the selective pressure of temperature have already been made before the isolation, since the fermentation occurred at 12ºC.
Figure 23. PCA of S. cerevisiae strains present at Bical from 12ºC fermentations from different temperatures of isolation (12ºC and 30ºC).
Biodiversity of wine S. cerevisiae strains in Portuguese appellations
41
At Figure 24 we observe S. cerevisiae strains from different temperatures of Maria Gomes fermentation. The strains from 12ºC fermentation seem to have a characteristic endogenous population but some of the strains cluster together whit the other fermentations strains. The strains from the fermentations at 18º and 25ºC are more related than to the 12ºC fermentation. This could be because 12ºC is a more stressful environment than 18º or 25ºC.
Figure 24. PCA of S. cerevisiae strains present at Maria Gomes fermentations from different fermentation temperatures (12°, 18° and 25°C).
Here we observed that the fermentation temperature is a key factor for the S. cerevisiae strains diversity, which may also influence the metabolic profile of the wine and consequently their organoleptic characteristics.
Biodiversity of wine S. cerevisiae strains in Portuguese appellations
42
4. Allelic frequency and heterozygosity of the Portuguese S. cerevisiae population
For what concerns the allelic frequency of each one of the locus in study are presented in Table 10 and Table 11 where we can observe that the allelic frequency differs from allele to allele. There are some alleles that are present in a very high frequency, where we can highlight the allele 219 bp of the ScAAT5 locus and the allele 94 bp of the C9 locus. The most common alleles can be considered the most representative of the S. cerevisiae population.
43 Table 10. Allelic frequency in 911 strains S. cerevisiae of the multiplex A microsatellite.
ScAAT1 ScAAT2 ScAAT3 ScAAT4 ScAAT5
Alleles Frequencies Alleles Frequencies Alleles Frequencies Alleles Frequencies Alleles Frequencies
123 0,001 345 0,011 217 0,006 269 0,063 213 0,002 150 0,002 354 0,001 220 0,001 272 0,026 216 0,104 153 0,011 357 0,132 223 0,020 275 0,024 219 0,462 156 0,018 360 0,062 229 0,001 278 0,017 222 0,264 162 0,018 363 0,005 235 0,004 281 0,003 225 0,004 165 0,001 369 0,165 241 0,051 287 0,002 234 0,003 168 0,240 372 0,042 244 0,006 290 0,032 246 0,039 171 0,067 375 0,192 247 0,164 296 0,017 249 0,008 174 0,007 378 0,188 250 0,109 299 0,003 252 0,009 177 0,006 381 0,184 253 0,004 305 0,075 255 0,007 183 0,001 384 0,009 256 0,117 308 0,015 258 0,013 186 0,001 390 0,001 259 0,025 311 0,003 261 0,004 189 0,061 393 0,007 262 0,141 314 0,002 264 0,022 192 0,024 265 0,133 317 0,003 267 0,027 195 0,211 268 0,028 320 0,002 270 0,004 198 0,009 271 0,080 329 0,480 273 0,014 201 0,119 274 0,017 332 0,024 276 0,010 204 0,061 277 0,033 335 0,005 279 0,004 207 0,003 283 0,001 338 0,002 210 0,001 307 0,003 341 0,003 216 0,007 310 0,001 344 0,002 219 0,056 346 0,045 347 0,002 225 0,005 358 0,006 356 0,002 228 0,001 361 0,001 359 0,075 231 0,005 376 0,001 362 0,005 B iodi ve rsity of wine S . ce re visi ae stra ins i n P or tu gue se a ppe ll ati ons
44
ScAAT1 ScAAT2 ScAAT3 ScAAT4 ScAAT5
237 0,019 365 0,007 243 0,005 368 0,002 246 0,006 371 0,034 249 0,013 374 0,003 255 0,001 377 0,015 258 0,001 380 0,009 264 0,001 383 0,014 267 0,001 389 0,002 273 0,001 395 0,002 354 0,001 401 0,003 357 0,014 404 0,002 410 0,002 413 0,003 419 0,002 422 0,003 425 0,005 431 0,002 434 0,002 443 0,002 B iodi ve rsity of wine S . ce re visi ae stra ins i n P or tu gue se a ppe ll ati ons