i
SOCIAL VULNERABILITY ASSESSMENT IN
MADEIRA ISLAND
ii
SOCIAL VULNERABILITY ASSESSMENT IN MADEIRA ISLAND
Dissertation supervised by Professor Doutor Pedro Cabral
iii
Declaration of originality
I declare that the content of this document is my own and not from somebody else. All assistance received from other people is acknowledged and all sources (published or not published) are referenced.
This work has not been previously submitted for evaluation at NOVA Information Management School or any other institution.
Lisbon, February the 26th of 2018
i
ACKNOWLEDGEMENTS
I would like to thank to all the Professors of the Geographic Information Science and Systems Masters for all the learning opportunities they provided.
In particular, I would like to thank Professor Pedro Cabral for the support, guidance and motivation during the last two years, and in especially in the last year as supervisor of this dissertation.
I’m grateful to all the institutions that provided the required geographic and statistical information.
ii
SOCIAL VULNERABILITY ASSESSMENT IN MADEIRA ISLAND
ABSTRACT
Social Vulnerability is an area of growing interest among researchers and decision makers. As disaster losses mount, it emerged the understanding that disasters are not just a product of Hazards characteristics and Exposure, but also a Social construct that creates differentiate levels of ability to cope with, resist to and recover from extreme events.
The assessment of a multidimensional and intangible phenomenon like Social Vulnerability is extremely complex and over the years a number of indexes have emerged as an attempt to reduce the phenomenon to a simple metric, temporal and spatially comparable.
Social Vulnerability Index (SOVI) is a particularly robust and widely used index. A recent version of this algorithm, the Social Vulnerability to Natural and Technological Hazards Index (SOVI_NTH) addressed the caveat of having in the same SOVI Components variables regarding the socioeconomic attributes that make people vulnerable and the support structures and facilities that help them to resist and recover. Both indexes were implemented using the Hazards-of-Place model, that combines Social Vulnerability and Hazards Susceptibility to pinpoint areas where both have high scores.
In this research we compared the results and the statistical performance of both indexes to determine their consistency. Additionally, we analysed the sensitivity to data aggregation in order to determine whether it is possible to use very small spatial statistical units to highlight asymmetries and niches of particularly high Social Vulnerability.
KEYWORDS
Social VulnerabilitySocial Vulnerability Index
Social Vulnerability to Natural and Technological Hazards Index Index sensitivity
Data aggregation
iii
LIST OF ABBREVIATIONS AND ACRONYMS
GDP – Gross Domestic Product INE – National Institute of Statistics PCA – Principal Components Analysis SOVI – Social Vulnerability Index
iv
INDEX
ACKNOWLEDGEMENTS ... i
ABSTRACT ... ii
KEYWORDS ... ii
LIST OF ABBREVIATIONS AND ACRONYMS ... iii
LIST OF TABLES ... v LIST OF ILLUSTRATIONS ... vi 1. INTRODUCTION ... 1 1.1. Introduction ... 1 1.2. Objectives ... 4 1.3. Hypotheses ... 4 1.4. General Methodology ... 4 1.5. Structure ... 6 2. CONCEPTUAL FRAMEWORK ... 7 2.1. Introduction ... 7
2.2. Risk and Disasters ... 7
2.3. Vulnerability and Social Vulnerability ... 10
2.4. Hazards-of-Place ... 16
2.5. Importance of Scale ... 17
3. SOCIAL VULNERABILITY IN MADEIRA ... 20
3.1 Introduction ... 20
3.2 Study Area ... 21
3.3 Methods and Data ... 27
3.3.1 Social Vulnerability Index ... 33
3.3.2 Social Vulnerability to Natural and Technological Hazards Index ... 34
3.4 Results ... 35 4. HAZARDS-OF-PLACE ... 64 4.1. Introduction ... 64 4.2. Hazards in Madeira ... 64 4.3. Methodology ... 68 4.4. Results ... 69 5. DISCUSSION ... 81 6. CONCLUSION ... 87 BIBLIOGRAPHY ... 88 APPENDIX ... 96 Appendix I ... 97 Appendix II ... 98 Appendix III ... 100 Appendix IV ... 103
v
LIST OF TABLES
Table 1: Variables used in SOVI and SOVI_NTH. ... 36
Table 2: Performance parameters for SOVI and SOVI_NTH, with different data aggregation units. ... 36
Table 3: PCA results for SOVI in parishes ... 38
Table 4: PCA results for SOVI in blocks ... 38
Table 5: PCA results for SOVI in sub-blocks ... 39
Table 6: PCA results for Criticality in parishes ... 39
Table 7: PCA results for Criticality in blocks ... 39
Table 8: PCA results for Criticality in sub-blocks ... 40
Table 9: PCA results for Support Capacity in parishes ... 40
Table 10: PCA results for Support Capacity in blocks ... 41
Table 11: PCA results for Support Capacity in sub-blocks ... 41
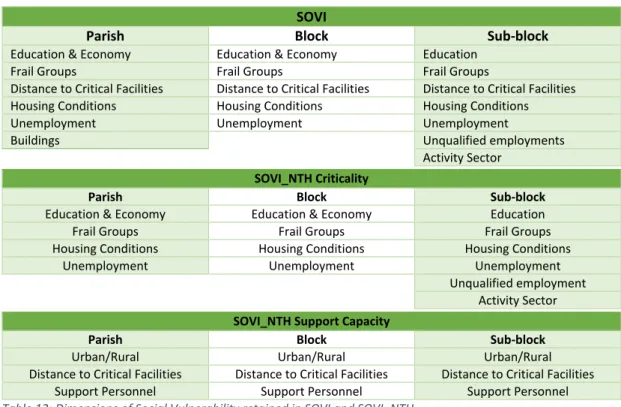
Table 12: Dimensions of Social Vulnerability retained in SOVI and SOVI_NTH ... 42
Table 13: Residents in Madeira per SOVI and SOVI_NTH score at parish, block and sub-block level .. 61
Table 14: Groups in Madeira per SOVI and SOVI_NTH score at parish, block and sub-block level ... 61
vi
LIST OF ILLUSTRATIONS
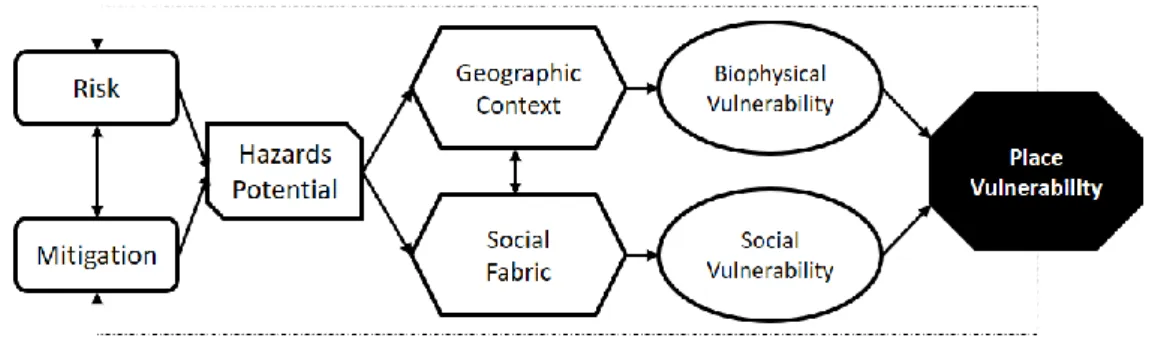
Figure 1: Hazards-of-Place Model. Adapt. Cutter, et al. (2003) ... 17
Figure 2: Location of Madeira ... 22
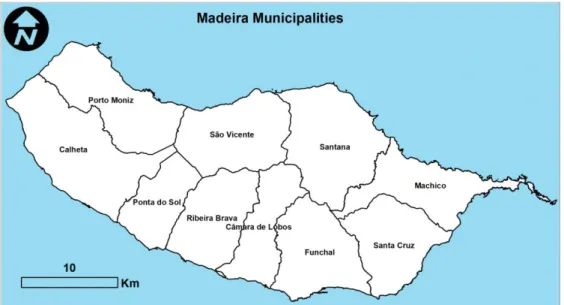
Figure 3: Municipalities in Madeira ... 25
Figure 4: SOVI at Parish level ... 43
Figure 5: SOVI at Block level ... 44
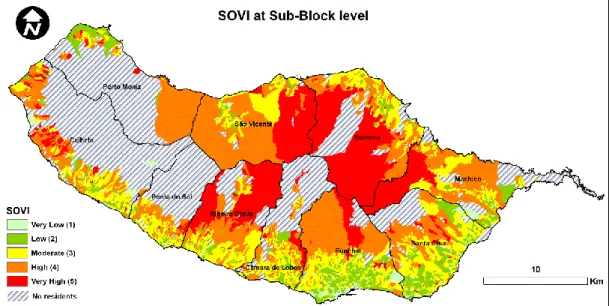
Figure 6: SOVI at Sub-Block level ... 45
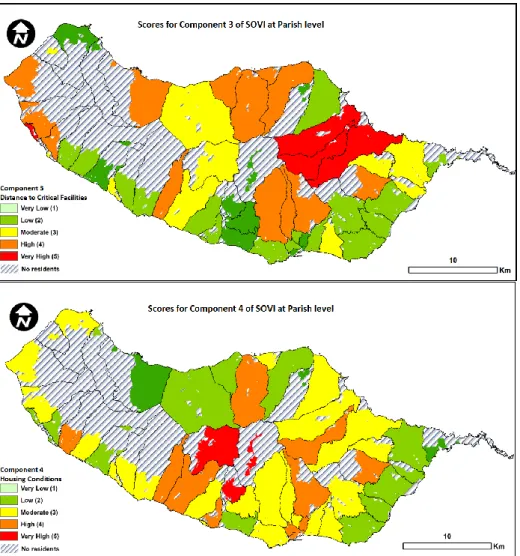
Figure 7: Example of 2 distinct Components patterns regarding the SOVI at Parish level ... 46
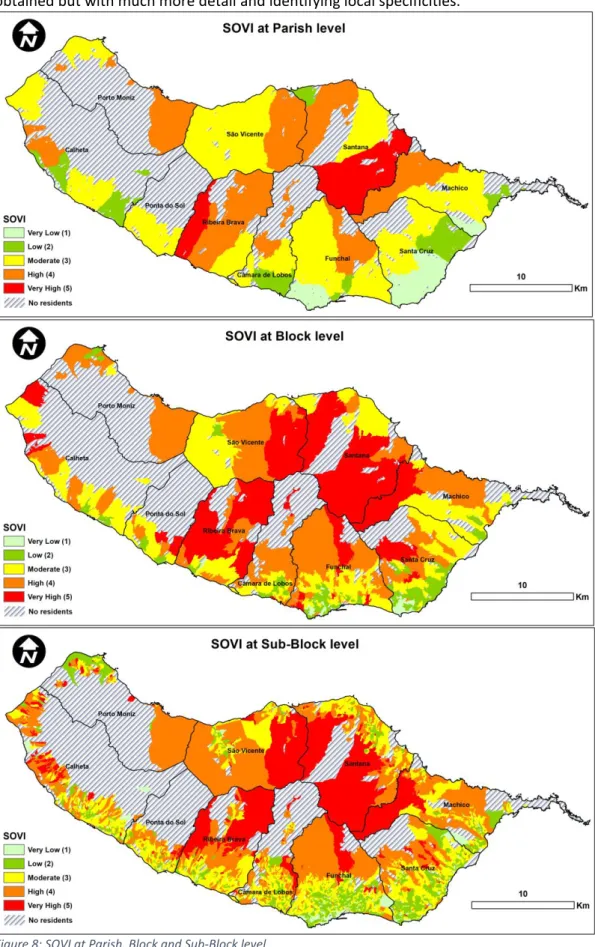
Figure 8: SOVI at Parish, Block and Sub-Block level ... 47
Figure 9: Criticality at Parish level ... 48
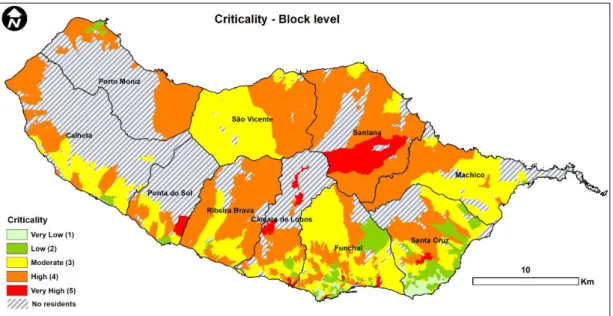
Figure 10: Criticality at Block level ... 49
Figure 11: Criticality at Sub-Block level ... 49
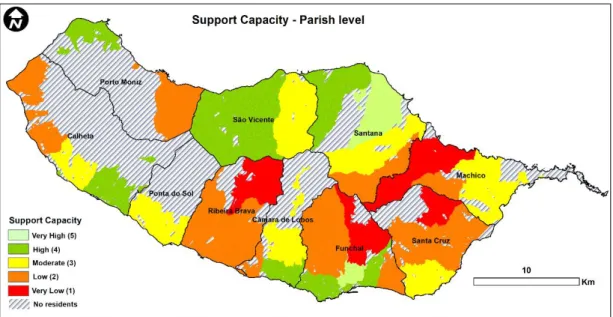
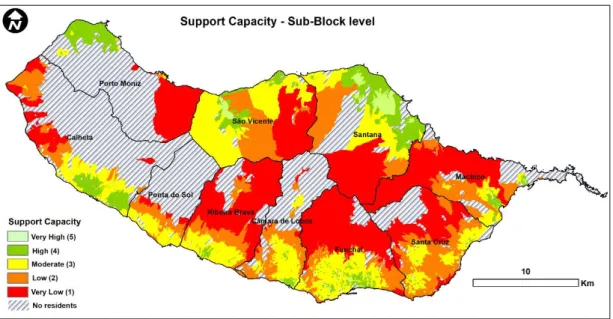
Figure 12: Support Capacity at Parish level ... 50
Figure 13: Support Capacity at Block level ... 51
Figure 14: Support Capacity at Sub-Block level ... 51
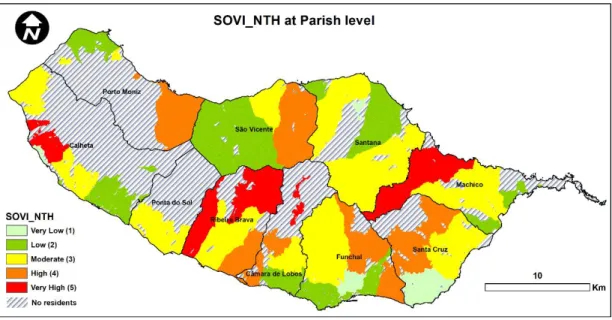
Figure 15: SOVI_NTH at Parish level ... 52
Figure 16: SOVI_NTH at Block level ... 53
Figure 17: SOVI_NTH at Sub-Block level ... 54
Figure 18: SOVI_NTH at Parish, Block and Sub-Block level ... 55
Figure 19: Social Vulnerability patterns across indexes and data aggregation units ... 56
Figure 20: Difference in results between SOVI and SOVI_NTH at Parish level ... 57
Figure 21: Difference in results between SOVI and SOVI_NTH at Block level ... 58
Figure 22: Difference in results between SOVI and SOVI_NTH at Sub-Block level ... 59
Figure 23: Difference in SOVI result at Parish and Block level ... 60
Figure 24: Difference in SOVI result at Block and Sub-Block level ... 60
Figure 25: SOVI at Block level and Population in Madeira ... 61
Figure 26: SOVI and SOVI_NTH patterns at Sub-Block level ... 63
Figure 27: Funchal Parishes ... 66
Figure 28: Illustration of Floods, Mass Movements and Forest Fires ... 67
Figure 29: Place Vulnerability with SOVI_NTH at Sub-Block level ... 69
Figure 30: Detail of Place Vulnerability in Ribeira Brava at Parish and Sub-Block level ... 70
Figure 31: Detail of Place Vulnerability in Funchal at Parish and Sub-Block level ... 71
Figure 32: Place Vulnerability regarding Mass Movements and SOVI at Parish and Sub-Block level ... 72
Figure 33: Detail of Place Vulnerability regarding Mass Movements and SOVI at Parish and Sub-Block level ... 73
Figure 34: Place Vulnerability regarding Forest Fire and SOVI at Parish and Sub-Block level ... 74
Figure 35: Place Vulnerability regarding Floods and SOVI at Parish and Sub-Block level ... 75
Figure 36: Detail of Place Vulnerability regarding Floods and SOVI at Parish and Sub-Block level ... 76
Figure 37: Multi-Hazards Susceptibility in Funchal ... 76
Figure 38: Place Vulnerability regarding Multi-Hazard and SOVI_NTH at Parish and Sub-Block level . 77 Figure 39: Detail of Place Vulnerability regarding Multi-Hazard and SOVI_NTH at Parish and Sub-Block level ... 78
Figure 40: Multi-Hazards and Population in Funchal ... 79
1
1. INTRODUCTION
1.1. Introduction
Risk has become a growing concern as societies are faced with disasters that escape their ability to control or prevent them (Beck, 1992). Risk, often represented as a product of Hazards and Vulnerability, refers to the probability of harmful consequences or losses due to natural or human-induced Hazards and vulnerable conditions or, in other words, the likelihood of occurrence of a hazardous phenomenon and the potential consequences and losses associated with it (Tate, 2011; UNISDR, 2004; Varnes, 1984).
In Risk and Disaster research there has historically been a predominance of studies focusing on Hazards (i.e. probability, intensity, distribution and triggering factors) and, thus, most initiatives implemented aim to control, or at least curb, the processes that induce Hazards (i.e. protective infrastructures, warning systems) having undervalued its social dimensions (Jorn Birkmann, 2007; Cutter, Emrich, Morath, & Dunning, 2013; Lewis, 1999).
As the number of disasters affecting people increase, Vulnerability studies are growingly seen as vital for Risk reduction (Balica, Douben, & Wright, 2009; Jorn Birkmann, 2006a; United Nations, 2005). There is a variety of methodological and conceptual approaches that show the growing vitality of this research topic, including the Social aspects of Vulnerability (Jorn Birkmann, 2006b; Cutter, Boruff, & Shirley, 2003; Cutter, Emrich, Webb, & Morath, 2009; Lundgren & Jonsson, 2012; Moret, 2014; Willis & Fitton, 2016; Wisner, Blaikie, Cannon, & Davis, 2004).
Vulnerability is a complex concept that generally refers to the potential of loss caused by a Hazard, but it has different meanings for different scientific areas – even within the context of Risk and Disaster research (Jorn Birkmann, 2006a; Guillard-Gonçalves, 2016; Moret, 2014). Social Vulnerability, in particular, considers the characteristics of individuals and communities that influence their frailty in the face of Hazards, their (in)ability to cope with, resist to, and recover from the impacts of Hazards, and why people exposed to the same event are affected differently (Cutter et al., 2003, 2013; Cutter & Finch, 2008).
Cutter et al. (1996, 2000, 2003), proposed an approach that combines both Exposition and Social Vulnerability to Hazards to produce the composite Vulnerability of a given place (Place Vulnerability) – the Hazards-of-Place model, highlighting those that are simultaneously more socially vulnerable and exposed to Hazards.
Assessing Hazards’ probability and spatial Susceptibility is a complex task. Assessing Social Vulnerability may be even harder, given that it is a less tangible concept, not directly
2
observable, multidimensional, harder to define and that can only be expressed by proxy measures (Cutter et al., 2003; Tate, 2011, 2013). Consequently, its assessment is also difficult to validate, and although some simple proxy indicators are often used (i.e. number of dead or injured) they can hardly account for all types of potential losses (Tate, 2011).
The difficulty in measuring Vulnerability begins in the concept itself. Different interpretations and perspectives of Vulnerability expand the field of research to a wide range of useful approaches, but complicates a common understanding of how to define and measure it (Jorn Birkmann & Wisner, 2006). Some aspects may even be ‘beyond quantification’ which does not mean they cannot be measured, or at least assessed and systematized, but that they’re not easily quantifiable objectively (Jorn Birkmann & Wisner, 2006).
The most disseminated approach is to use quantitative methods. Indexes, in particular, are a valued tool, simplifying the multidimensional nature of Social Vulnerability into a single metric that facilitates the comparation between places, creates new information and facilitates its communication (Jorn Birkmann, 2006a; Gall, 2007; Rygel, O’sullivan, & Yarnal, 2006; Tate, 2011, 2013). Despite the growing interest for such indexes, they face questions about their accuracy and ability to represent such a complex and multidimensional phenomenon (Gall, 2007; Rygel et al., 2006; Tate, 2011).
Social Vulnerability Index (SOVI) in particular, is a robust, widely used and tested index that has been used in different regional and scale contexts (Borden, Schmidtlein, Emrich, Piegorsch, & Cutter, 2007; Boruff, Emrich, & Cutter, 2005; Burton & Cutter, 2008; Cutter et al., 2006). It uses a large set of variables representing different dimensions of Social Vulnerability that are reduced using a Principal Component Analysis (PCA) to obtain a small number of Components and a relative value of Social Vulnerability within the studied area (Cutter et al., 2003).
Mendes et al. (2009), reflecting on some conceptual caveats of SOVI, proposed a Social Vulnerability Index to Natural and Technological Hazards (SOVI_NTH) where Criticality and Support Capacity are analysed separately, resulting in two sub-indexes, that are only then combined into an overall Social Vulnerability score.
When assessing Social Vulnerability, aspects like scale of analysis, data resolution and data availability should be aligned with the objectives of the research. These aspects also affect the statistical performance of the PCA (Garson, 2009; O’Rourke & Hatcher, 2013; Schmidtlein, Deutsch, Piegorsch, & Cutter, 2008). Social Vulnerability, especially when framed by the Hazards-of-Place model, is a place specific phenomenon and should be
3
analysed in a specific geographic context (Cutter, 1996; Cutter, Mitchell, & Scott, 2000).The analysis based on the Hazards-of-Place model may be done considering one type of Hazard or a combination of several Hazards (Cutter, 2003; Cutter et al., 2000).
Small island territories are particularly sensitive to disasters because of their small size, location, dependency on a small set of economic activities and less resources and capacities to respond to disasters (Lewis, 1999; Rodrigues, 2005).
In Madeira island, the combination of natural features (i.e. steep slopes; geology; dimension and shape of river basins; vegetation; clime) and anthropic characteristics (i.e. urbanization of susceptible areas; land use and soil impermeabilization; hydraulic structures) in a small insular territory, with limited availability of urbanization areas, creates conditions propitious for a high probability of occurrence of severe disasters affecting exposed and vulnerable population (Municipia, 2014; Oliveira et al., 2010; Policarpo, 2012; Quintal, 1999; Rodrigues, 2005; Sepúlveda, 2011).
Recurrent extreme natural events have through the years caused property damage, life loss and disruption of the socioeconomic fabric (Municipia, 2014; Quintal, 1999; Rodrigues, 2005; F. Silva & Menezes, 1978). Some of these disasters are listed on Appendix I. The need to balance the challenges posed by a territory prone to natural Hazards and the human occupation of an exiguous insular territory makes Madeira a singular case study.
In this dissertation we apply the Social Vulnerability Index (SOVI) and the Social Vulnerability Index to Natural and Technological Hazards(SOVI_NTH) and reflect about the methodological challenges including index implementation, data aggregation and data availability. We adopt the framework Hazards-of-Place model (Cutter, 1996; Cutter et al., 2000; Cutter & Solecki, 1989) to explore Social Vulnerability in Madeira Island.
We will test the performance of SOVI and SOVI_NTH, in the context of Madeira, and compare their statistical performance and information provided to determine whether SOVI_NTH can be a viable, if not preferable, option. Additionally, we will test their sensitivity to data aggregation, the way it affects statistical performance, the interest of the information provided. We want to determine whether an analysis using a resolution finer than those commonly used, with very small statistical units, is possible within the acceptable statistical performance parameters.
We aim to produce information that can inform future discussions about adequate policies, strategies and priorities to prevent and mitigate disaster impact, exploring the potential of Geographic Information Science and Systems, not only to process and analyse data, but also
4
to communicate information to the public, experts or policy makers, in a visual and easily understandable way (i.e. Cartography).
1.2. Objectives
The objectives of this research include:
a) Contribute to the discussion about disaster prevention and mitigation strategies in Madeira Island by assessing Social Vulnerability, within the Hazards-of-Place model. b) Test and compare the performance and applicability of both the SOVI and SOVI_NTH
indexes in the context of Madeira.
c) Test the indexes sensitivity to scale and data aggregation and determine the applicability to very small statistical units.
1.3. Hypotheses
The hypothesis used as start point for this research include:
a) SOVI can be used to effectively assess Social Vulnerability in Madeira.
b) SOVI_NTH offers a valid alternative, with a conceptual edge and with an extra layer of information.
c) Hazards-of-Place model provides an adequate framework to integrate Hazards Susceptibility and Social Vulnerability and create information and cartography relevant to the discussion about Risk and Disasters.
d) Social Vulnerability’s assessment should include different types of data aggregation, including fine and very fine resolution, in order to offer a better understanding and illustration of existing patterns and asymmetries.
1.4. General Methodology
In each Chapter we will detail the methodology and the data used at every step. We present here the general methodology of this dissertation.
We started this work by researching and reviewing existing literature about the main concepts regarding Disaster, Risk, Hazard, Vulnerability and Social Vulnerability. We selected the Hazards-of-Place model and the Social Vulnerability Index proposed by (Cutter, 1996;
5
Cutter et al., 2003, 2000) due to its robustness and suitability to the research objectives. Additionally, we implemented an adjusted version of the SOVI, the SOVI_NTH proposed by Mendes et al. (2009), to test its performance and the information produced, particularly by its two sub-indexes (Criticality and Support Capacity).
We systematized the steps of both the SOVI and SOVI_NTH algorithms, and identified the data, statistical and analytical requirements, as well as performance parameters for a successful application. Because one of the objectives was to explore the sensitivity to scale and data aggregation, we implemented the algorithms using different statistical units to, first, test the performance and viability of the analysis and, second, to assess the usefulness of the obtained information for Risk and Disaster management. We considered issues such as data availability, variables selection, data aggregation, statistical requirements and quality parameters of the resulting model. We compared the performance of these indexes, the quality of the PCA model, the resulting components, retained variables, the information provided and the resulting Social Vulnerability spatial patterns.
To evaluate the effect of using more disaggregated data, we used PCA performance and quality parameters. We also determined the percentage of statistical units that have a SOVI level (i.e. in a scale of 1 to 5) at a smaller statistical unit, different than the one that they would have if the value calculated for a more aggregated unit would be assigned to all the smaller units that compose it.
In order to apply SOVI and SOVI_NTH we collected and prepared statistical information. Some variables were calculated or obtained by performing spatial analysis using ArcGis. The indexes were calculated using SPSS and the results were then imported to ArcGis and combined with other geographic information.
To implement the Hazards-of-Place model, Social Vulnerability was combined with Hazards Susceptibility maps, using spatial analysis and raster calculation in ArcGis. We used both Hazard and Multi-Hazard analysis. In the latter case, we first combined different Hazards’ spatial Susceptibility into one single Multi-Hazards map and only then combined it with Social Vulnerability.
The combination of Hazards Susceptibility and Social Vulnerability in one single map allows to characterize Social Vulnerability and Hazards patterns, highlighting areas where high Hazard Susceptibility and high Social Vulnerability coincide (Cutter, 1996; Cutter et al., 2003, 2000).
6
Asymmetries in overall Social Vulnerability and the distribution of the different components that contribute to that overall Social Vulnerability were analysed.
Social Vulnerability was calculated and analysed for the entire island, but because we were not allowed to use all the existing regional Hazard’s cartography, the combination with some Hazards was only possible regarding Funchal.
Finally, we reflect about the lessons learned, the new information and knowledge produced and reflect on how it can be useful for disaster prevention and mitigation strategies.
1.5. Structure
The dissertation is organized in 6 chapters:
I. Introduction: In this chapter we frame this study by presenting its objectives,
hypotheses, general methodology and the dissertation structure.
II. Conceptual framework: In this chapter we present the main theories and conceptual
framework supporting this research.
III. Social Vulnerability in Madeira Island: In this chapter we describe the
methodological approach to assess Social Vulnerability and present the results. IV. Hazards-of-Place: In this chapter we implement the Model Hazards-of-Place by
combining Social Vulnerability whit spatial Susceptibility to Hazards.
V. Discussion: In this chapter we discuss the results of both the application of Social
Vulnerability indexes to Madeira, as well as the sensitivity analysis of the indexes and data aggregation units.
7
2. CONCEPTUAL FRAMEWORK
2.1. Introduction
In this Chapter we review significant literature regarding Risk, Disaster, Vulnerability, Social Vulnerability assessment methods and frameworks, and the challenges posed by scale of analysis and data aggregation. The purpose is to contextualize this research within the existing conceptual models.
We started with a broad perspective, reviewing different theories and conceptual frameworks in order to identify those that better would serve the purpose of our research. After the selection of the Hazards-of-Place model and the assessment indexes, additional literature was analysed to provide conceptual and methodological information.
2.2. Risk and Disasters
We live in a society of Risk, where there is a growing concern about disasters that often escape our grasp and our ability to control and prevent them (Beck, 1992). In the mid-twentieth century there might have been the hope that technology would eventually allow us to control natural phenomena, and we would be able to prevent nefarious consequences (Bateira, 2001), but societies are now more aware about the challenges of preventing, controlling, or even fully understanding these Hazards (Beck, 1992).
Risk refers to the combination of the probability of an hazardous event and its negative consequences (UNISDR, 2009), or in other words, the interaction between Hazards of natural or human induced origin and the Vulnerability of those exposed to potential harmful consequences or losses (Julião, Nery, Ribeiro, Branco, & Zêzere, 2009; Randolph, 2004; Rebelo, 2003; UNISDR, 2009; Wisner et al., 2004). It is usually represented by the conceptual formula ‘Risk = Hazard x Vulnerability’, meaning the product of a Hazard (likelihood of a damaging phenomenon) and Vulnerability (potential loss due to that phenomenon) (Jorn Birkmann, 2006a; Varnes, 1984; Zêzere, Pereira, & Morgado, 2006). Some consider the concept of Total Risk as the product of Hazards, Vulnerability and Exposed Elements (i.e. people, property): ‘Risk = Hazard x Vulnerability x Exposed Elements’ (Randolph, 2004; Tavares & Cunha, 2008; Varnes, 1984; Zêzere et al., 2006)
The concept of Hazards refers to a phenomenon, occurring independently, in a sequence or combination of different types, at different times, with a given degree of intensity and severity, that can cause variable losses (i.e. fatality, injury, property damage, socioeconomic
8
disruption, environmental degradation) and can be originated by natural or human processes, sometimes acting in combination (UNISDR, 2004, 2009; Wisner et al., 2004). They can be seen as the probability of occurrence of a phenomenon within a specified period of time and within a given area. Its potential negative consequences may have varying degrees of severity, depending not only on the intensity of the phenomena itself but also people and systems’ ability to deal with them (Ayala Carcedo & Olcina Cantos, 2002; Varnes, 1984; Zêzere et al., 2006). Hazards can be characterized by their location, intensity, duration, spatial extent, frequency and probability (UNISDR, 2004, 2009). The propensity of a given area to be affected by Hazards, due to its location and characteristics, is called Susceptibility (Ayala Carcedo & Olcina Cantos, 2002; Julião et al., 2009).
There are different types of Hazards. Natural Hazards are phenomena or processes of natural origin (i.e. floods, landslides, earthquake) and Technological Hazards are those where the source of danger is human activity (i.e. dam failures, technological accidents, urban fires) (Julião et al., 2009; UNISDR, 2004, 2009). When the event arises from natural processes whose intensity or frequency is amplified by human activity, they can be called Socio-Natural Hazards (i.e. forest fire, desertification) (UNISDR, 2009).
Vulnerability refers to conditions determined by physical, social, economic, and environmental factors that affect the potential impact of Hazards (UNISDR, 2009). It represents a potential or degree of lost endured by an element exposed to a hazardous phenomenon of a given intensity (Varnes, 1984; Zêzere et al., 2006). Exposed Elements include people, property and human or natural systems in areas susceptible to Hazards and subject to potential losses (Balica et al., 2009; Randolph, 2004; UNISDR, 2009; Zêzere et al., 2006). This potential of loss is paramount to the concept of Risk because it is this exposure of people and property to Hazard induced losses that completes the Risk equation (Lourenço, 2003). We only have Risk if due to a hazardous event someone or something is actually at risk (Castro, Peixoto, & Rio, 2005; Rebelo, 2003).
The ability of a system, community or society to (re)organize itself, adapt and learn with past events in order to withstand the impact of a Hazard, maintain or quickly recover its basic systems and structures and increase its ability to withstand future Hazardous events is called Resilience (Adger, Arnell, & Tompkins, 2005; Balica et al., 2009; Moret, 2014; UNISDR, 2004, 2009). There is some discussion whether it refers (mostly) to the capacity to absorb the impact of Hazards and resist to them, or the ability of a social system to learn and adapt from incremental or sudden changes and restore its major functions (Jorn Birkmann, 2006c).
9
To increase resilience and protect from Hazards, prevention and mitigation strategies should be applied. The first aims at (completely) avoiding negative impacts from Hazards by taking actions in advance, and the second, because more often than not it is impossible to completely avoid losses, refers to reducing the potential consequences as much as possible by using existing capacities, through structural (i.e. protective structures or systems) and non-structural (i.e. legal framework, public awareness, education, research, public participation) measures (UNISDR, 2004, 2009).
When extreme events occur, Response and Recovery measures should be put in place, respectively, to protect those exposed and care for basic immediate subsistence needs during and immediately after the impact of a Hazard, restore or improve living conditions and reduce future disaster Risk (UNISDR, 2004, 2009).
Even when adequate prevention strategies are put in place, the complete eradication of negative consequences from Hazards is hardly achieved, leading to Crises or even Disasters. A crises represents a situation where a threatening condition causes disruption to the normal functioning of existing systems and requires urgent action to prevent it from escalating into a more serious situation (UNISDR, 2009). When an event causes extensive losses and its impact exceeds the capacity of the affected community to cope using only its own resources, the situation represents a Disaster (Wisner et al., 2004).
Crises and disasters are not a function of only the intensity of the hazardous phenomenon but also the attributes of the exposed communities, and a same event can represent a crisis or disaster in one context, and not in another, due to local conditions (UNISDR, 2004, 2009; Wisner et al., 2004). Managing disasters requires an integrated approach to both Hazard and Vulnerability, covering: Risk assessment and analysis (i.e. susceptibility map), the implementation of strategies to Risk reduction and control (i.e. mitigation measures in Hazard susceptible areas), and transfer of the cost associated with Risk from individuals or communities (i.e. tax benefits for protective measures) (UNISDR, 2009).
Because disasters are spatial phenomena resulting from interactions between people and places, their analysis requires a spatial approach and ability to combine different layers of information, which makes disaster management adequate for the application of Geographic Information Systems (GIS) (Tomaszewski, 2014).
Disaster Risk Management, through the implementation of prevention, preparedness and mitigation strategies (i.e. institutional, legal, organizational, operational), should develop coping capacity, reduce the potential impact of extreme events and create safer societies
10
(UNISDR, 2004, 2009). Strategies should include promoting Risk awareness, Risk education and research, legislation, spatial planning, protection of critical facilities, weather forecasting and early warning systems (UNISDR, 2009).
2.3. Vulnerability and Social Vulnerability
Vulnerability is an elusive concept with different definitions, even within the context of Risk and Disasters, depending on the researchers’ focus, conceptual frameworks and background (Balica et al., 2009; Jorn Birkmann, 2006a; Cutter, 1996, 2001; Cutter et al., 2003; Guillard-Gonçalves, 2016; Moret, 2014). Geography, bridging between biophysical and human perspectives, allied with the use of Geographic Information Systems, is a driving force behind Vulnerability research (Cutter et al., 2003).
Vulnerability is broadly associated with the potential losses that an element can suffer from a hazardous event, of a given intensity, as well as the ability to resist and recover (Jorn Birkmann, 2006c; Cunha, Mendes, Tavares, & Freiria, 2011; Cutter, 1996; Cutter et al., 2003; Schmidtlein et al., 2008; Wisner et al., 2004). It considers the physical, social, economic and environmental characteristics or processes of an element or system, that make it susceptible to the impact of a Hazard (UNISDR, 2004, 2009), representing a predisposition to suffer losses (i.e. Injury, death, destruction, ecosystem disturbance), influenced by the systems characteristics (Cutter, 1996) and its ability to adapt (Adger, 2006; Balica et al., 2009). Vulnerability to Hazards manifest differently to different groups because the access to resources and the ability to resist is differentiated. Its study is widely accepted as important to the development of prevention and mitigation strategies (Cutter, 2001; Cutter et al., 2003). Some authors focus more on exposure to the Hazard itself, others on the characteristics of those exposed (Balica et al., 2009). Vulnerability to Hazards is a multidimensional construct that encompasses several dimensions that affect the ability to deal with Hazards (i.e. social, economic, demographic, institutional) (Cutter, 1996).
Vulnerability is sometimes divided into two perspectives: Biophysical Vulnerability, referring to Hazards, the biophysical context and its interaction with society that influence the likelihood of losses and the ability to recover and adapt; Social Vulnerability that considers the frailty of individuals or groups to potential losses from Hazards based on attributes (i.e. age, income, gender) that influence losses and a differentiated impact of a same event in
11
different individuals (Jorn Birkmann, 2006c; Cutter, 1996; Schmidtlein et al., 2008; WBGU, 2005)
The concept of Vulnerability has changed over the past decades (Balica et al., 2009) and encompassed several thematic areas, i.e. economic, environmental and institutional vulnerability (Jorn Birkmann, 2007). Initial studies focused mainly in the biophysical dimension, Hazards, the triggering factors, the people exposed and how to prevent or protect from hazardous events (Balica et al., 2009; Jorn Birkmann, 2006c, 2007; Cutter, 1996), providing the basis for the definition of prevention and mitigation strategies that aimed at control, or at least curb, Hazards (i.e. protective infrastructures, warning systems), while the Vulnerability dimension was often undervalued (Jorn Birkmann, 2006a; Cutter et al., 2013; Lewis, 1999).
Researchers have long acknowledged that human decisions influence the outcome of Hazards but the explicit focus on Vulnerability as a Social construct is more recent (Schmidtlein et al., 2008; Wisner et al., 2004). Thus, Vulnerability assessment and quantification is less advanced (Jorn Birkmann, 2007; Cunha et al., 2011). In recent years, a growing number of studies addressed Vulnerability assessment (Jorn Birkmann, 2007) with methodologies determined by the conceptual framework, including the specific definition of Vulnerability itself, and the objectives of the assessment (Moret, 2014).
In this dissertation we focus on Social Vulnerability, that refers to characteristics of individuals and communities that influence their sensitivity to Hazards, their (in)ability to cope with, resist to, and recover from their impact (Cutter et al., 2003, 2013; Cutter & Finch, 2008). It refers to ‘the Susceptibility of Social groups to potential losses from Hazard events or society’s resistance and resilience to Hazards’ (Cutter et al., 2000).
Although an area may be affected by a given natural phenomenon (almost) regardless of the Social context, the impact of that phenomenon is affected by the social conditions of those exposed. People affected by the same Hazard, may experience its impact differently, suffering varying degrees of loss, and it is this differentiated Vulnerability that Social Vulnerability addresses (Cutter, 1996; Cutter et al., 2003; Hummell, Cutter, & Emrich, 2016). People’s characteristics influence the capacity to anticipate, cope with, resist to, and recover from the impact of Hazards (Wisner et al., 2004). Therefore, identifying those more prone to suffer losses or that would find more difficult to recover is vital to Risk and Disaster management (Chen, Cutter, Emrich, & Shi, 2013; Cutter et al., 2013; Fuchs, 2009).
12
Despite being called ‘Social’ Vulnerability, it is a construct of different dimensions that amplify or reduce Vulnerability to Hazards, including social (i.e. poverty, racial discrimination), demographic (i.e. age, gender), economic (i.e. employment) and build environment (i.e. medical facilities) aspects, and Social Vulnerability assessment should include those dimensions (Jorn Birkmann, 2006a, 2006c; Chen et al., 2013; Cutter et al., 2003; Hewitt, 1997; Wisner et al., 2004). The factors that influence how Hazards impact individuals and communities and are, therefore, most often used in Social Vulnerability assessment include: age, race, gender, income, education attainment, professional activity and income levels, unemployment, population growth, family structure, special needs population (i.e. physical or mental impairments), behaviour and Risk perceptions, social or family support networks, house property, lack of access to resources (i.e. information, technology, political representation), social dependency, immigrants, homeless, prevalent economic sector, rural or urban area, buildings’ quality, infrastructure and lifelines (i.e. medical, police, transportation) (Birkmann, 2006; Cutter, 2001; Cutter, Boruff, & Shirley, 2003; Cutter et al., 2000; Hewitt, 1997; Schmidtlein, Deutsch, Piegorsch, & Cutter, 2008; Tierney, Lindell, & Perry, 2001; Wisner, Blaikie, Cannon, & Davis, 2004).
According to Cutter et al. (2003), there are three main Vulnerability research perspectives. The first, Exposure model, assumes Vulnerability as a pre-existing condition and focuses on the spatial distribution of Hazards and people and assumes that exposure and proximity to Hazards is determinant when considering Vulnerability and that those living in Hazard susceptible areas are inherently more vulnerable (Anderson, 1995; Cutter, 1996; Cutter et al., 2003, 2000). The priority is to reduce exposure and promote coping and recovery capacity by predicting Hazards and building protective infrastructures (Anderson, 1995; Cutter, 1996; Cutter et al., 2003). This model does not account for the fact that disasters impact differently people living in areas with the same level of exposure and, thus, socioeconomic context must also be considered (Anderson, 1995; Cutter et al., 2000; Hummell et al., 2016)
The second model views Vulnerability as a social response to Hazards (Cutter, 1996; Cutter et al., 2000). The nature of the Hazard event itself is usually taken as a given, and the focus is the social construction of Vulnerability rooted in the underlying historical, cultural, social and economic context, as well as people’s perceptions, behaviour and decisions, that create an unsafe context and greatly influence the individual or society's ability to deal with Hazards (Anderson, 1995; Cutter, 1996; Cutter et al., 2003; Wisner et al., 2004).
13
The third approach, Hazards-of-Place, integrates the previous two models and considers that both Exposure and Social response are relevant. Both Susceptibility to Hazards and Vulnerability are space specific, manifesting themselves geographically and can, therefore, be integrated to reveal the Place Vulnerability (Cutter, 1996; Cutter et al., 2003). Different combinations of different levels of Susceptibility and Exposure to Hazards and different degrees of Social Vulnerability result in a Place Vulnerability pattern that allows to prioritize areas of intervention (Cutter, 1996; Cutter et al., 2003). This is the same rationale of the concept of Risk, product of Hazards and Vulnerability, but in this dissertation we will refer to the result as Place Vulnerability, instead of Risk, as that is the nomenclature defined in the Hazards-of-Place model.
Social Vulnerability is a multidimensional construct, complex to measure (Cutter et al., 2003), not easily captured with a single variable nor easily quantifiable (Cutter & Finch, 2008). Being a relatively recent field of research, is still in the process of developing and consolidating methodologies to assess and compare different places with a comprehensive, robust, scale and context adjustable metric (Cutter et al., 2003; Rygel et al., 2006).
Vulnerability Science uses Qualitative and Quantitative methods to describe and operationalize Vulnerability (i.e. analytical approaches, contextual and statistical analyses, GIS and mapping techniques) (Jorn Birkmann, 2006b, 2007; Jorn Birkmann & Wisner, 2006; Cutter, 1996; Cutter et al., 2003; Cutter & Corendea, 2013; León, 2006; Lundgren & Jonsson, 2012; Moret, 2014). Qualitative methods are usually applied at local level but have been fundamental to identify and understand the influence of key Vulnerability drivers and better understand the process of Social Vulnerability construction (Jorn Birkmann, 2006a; Tate, 2011).
Quantitative methods have used the insight collected from qualitative studies to develop indexes of Vulnerability (Tate, 2011). Social Vulnerability assessment should include the context characterization, identification of drivers and implementation of a quantitative model (Polsky, Neff, & Yarnal, 2007).
An often used approach is simplifying the complexity of Social Vulnerability into a simple metric using indicators or indexes (Tate, 2011). Indicators may use one variable or a combination of variables, measuring the variable of interest directly or another that serves as a substitute, adjusted for statistical purposes (i.e. percentage), and aims to represent a characteristic of a system (Gall, 2007; Tate, 2011). Indexes are composite indicators, combining two or more indicators into one single score that represents an abstract
14
theoretical construct (Gall, 2007; Tate, 2011). Social indicators have been used for several decades, but more complex Vulnerability indexes are more recent, with different variable and scale selection. Subnational Social Vulnerability indexes are less prevalent (Tate, 2011). Vulnerability indexes attract growing interest as a tool to understand, measure and monitor Social Vulnerability, compare it over time and space, present a complex reality in simple terms, creating new information not easily perceptible otherwise and facilitating its communication (Gall, 2007; Rygel et al., 2006; Tate, 2013).
An index representing Social Vulnerability in a single metric, comparable across time and space and widely accepted, would be extremely valuable but also extremely difficult to obtain due to the difficulty of developing and validating indexes (Rygel et al., 2006; Tate, 2011). There are many practical and methodological challenges: subjectivity in variable selection and weighting; scale and data aggregation; data accuracy, aggregation and availability at different scales; difficulties validating the results because Social Vulnerability cannot be measured directly; simplify, without becoming over simplistic; not being so complex as to mask the underlaying structure and causes (Jorn Birkmann, 2007; Cutter et al., 2003; Eakin & Luers, 2006; Gall, 2007; Rygel et al., 2006; Tate, 2011).
Despite these issues, indicators and indexes have been developed to different scales, contexts and objectives, offering a way of reducing the complexity of Social Vulnerability, allowing to compare, map and communicate it (Jorn Birkmann, 2007; Fekete, Damm, & Birkmann, 2010; Gall, 2007; Tate, 2011).
The accuracy of Social Vulnerability indexes is paramount but the validation of such indexes is not a consolidated area (Rygel et al., 2006; Tate, 2011). While environmental models are often validated with an independent data set, with Social Vulnerability this is much more difficult because Social Vulnerability is not tangible or directly observable, and because there is no device to measure it, the use of proxy measures is required (Tate, 2011). Indicators often used for validating Vulnerability include mortality, injured, damage to buildings, economic losses, forced migration (Tate, 2011). These and other indicators do not account for all types of losses (i.e. trauma, impairing anxiety, loss of possessions with affective value, a child growing without its parents). In any case, those measures use the consequences of post-event as a validation of implicit Social Vulnerability, but indexes generally represent pre-event conditions (Tate, 2011).
15
Alternative approaches perform internal validation of indexes by examining how changes in the algorithm affect results (i.e. sensitivity analysis), analysing indexes’ inherent uncertainty, and comparing indexes (Beccari, 2016; Gall, 2007; Schmidtlein et al., 2008; Tate, 2011). SOVI should be seen as an algorithm for quantifying Social Vulnerability and is a particularly reliable, recognized and widely used index and the ability to replicate it using different scales and data unit aggregations, variables and regional contexts with similar performance, suggests it is a fairly robust algorithm (Armaș & Gavriș, 2013; Borden et al., 2007; Boruff et al., 2005; Burton & Cutter, 2008; Chen et al., 2013; Cutter et al., 2006; Cutter & Finch, 2008; Guillard-Gonçalves, Cutter, Emrich, & Zêzere, 2015; Hummell et al., 2016; Mendes, 2009; Schmidtlein et al., 2008). SOVI uses a Principal Components Analysis with variables representing different dimensions of Social Vulnerability, chosen based on empirical and theoretical studies and that should be adjusted to context specificities (Burton & Cutter, 2008; Chen et al., 2013; Cutter et al., 2003). It has evolved over the years benefiting from the use of the algorithm and growing understanding about the driver variables affecting Social Vulnerability (Chen et al., 2013; Mendes, Tavares, Freiria, & Cunha, 2009).
Social Vulnerability encompasses both the sensitivity of a population to Hazard and its ability to respond to and recover from its impact. These are two complementary but not equal dimensions. Some authors consider that it may not be adequate to join in the same Component individual (i.e. age, income, gender) and structural characteristics (i.e. lifelines like medical or police facilities) that influence Social Vulnerability (Eakin & Luers, 2006; Mendes et al., 2009; Prescott-Allen, 2001). In fact, SOVI algorithm’s result may aggregate in the same Component variables about both people’s sensitivity and proneness to suffer losses and characteristics that helps them to resist and recover. To address that, Mendes et al. (2009) created the Social Vulnerability Index to Natural and Technological Hazards (SOVI_NTH), replicating the rationale of SOVI but with a two stage process that allows to assess these two dimensions separately, Criticality (i.e. characteristics or behaviour that contribute to the disruption of the system) and Support Capacity (i.e. social resources that help to react, resist and recover) as well as a final overall Social Vulnerability score, thus also providing extra information for Risk governance (Cunha et al., 2011; Mendes, Tavares, Cunha, & Freiria, 2011; Mendes et al., 2009).
16
2.4. Hazards-of-Place
The model Hazards-of-Place was first proposed by Cutter and Solecki (1989) to examine the distribution of Hazards and processes that give rise to them. They questioned whether certain places are more at Risk only due to their geographic location (Cutter & Solecki, 1989). ‘Hazardousness’ was perceived as a function of both Risk factors (i.e. incident-specific and contextual variables that increase the likelihood of losses) and mitigation factors (i.e. that lessen the Hazard potential) (Cutter & Solecki, 1989). Additionally, they intended to explore Multi-Hazards analysis and intersect it with vulnerable populations (Vulnerability), which was not, at the time, a common approach (Cutter et al., 2000).
This approach build upon previous research, including Kasperson et al. (1988) that suggested that Risks interact with cultural, social, and institutional processes that reduce or amplify their impact and limit or heighten public response (Cutter et al., 2000; Kasperson et al., 1988). The results from practical applications showed that areas more biophysically susceptible to Hazards don’t always coincide with the more vulnerable populations (Cutter et al., 2000). Areas with higher Risk but significant mitigation capacity may be less hazardous than areas with lower Risk but no mitigation efforts (Cutter & Solecki, 1989). Areas of greater economic affluence may in the case of a disaster represent greater amount of economic losses, but that population may, simultaneously, have greater resources to absorb and recover (Cutter et al., 2000). Conversely, a moderate intensity Hazard may have devastating consequence if it affects an area of economically and socially deprived population (Cutter et al., 2000). As the model was subsequently developed (Figure 1), it proposed that Risk (i.e. likelihood of a Hazard event occurring, the consequences of the Risk itself, and an estimate of its frequency of occurrence) interacts with Mitigation (i.e. actions to reduce Risks or lessen their impacts such as planning or structural improvements in buildings) creating Hazard Potential, which can be reduced or amplificated by the Geographic Context (i.e. biophysical characteristics that affect phenomenon frequency and intensity) and the Social Fabric (i.e. contextual variables that affect the impacts of the phenomenon, including economic, demographic, and housing characteristics) (Cutter, 1996; Cutter et al., 2003, 2000).
17
Figure 1: Hazards-of-Place Model. Adapt. Cutter, et al. (2003)
The Geographic Context and Social Fabric interact with the Hazard Potential resulting respectively in Biophysical Vulnerability (i.e. underlying biophysical elements that contribute to Vulnerability) and Social Vulnerability (i.e. underlying Social elements that contribute to Vulnerability). These, in turn, combine in an overall Vulnerability of a specific place and the people who live there (Cutter et al., 2003, 2000).
Hazards-of-Place offers a method for assessing Place Vulnerability in spatial terms using both biophysical and social underlying elements, assess their interaction and intersection and how they affect places, highlighting those simultaneously socially vulnerable and exposed to Hazards (Cutter, 1996; Cutter et al., 2003, 2000)
Risk is seen as the product of the probability of an event (Hazards) and its potential negative consequences (Vulnerability) (UNISDR, 2004, 2009) and Risk analysis should, therefore, include the combination of information (i.e. data analysis, map overlaying) about Hazards, Exposed Elements and Vulnerability (Randolph, 2004). The Hazards-of-Place model offers a conceptual framework to this approach and is the one we adopt in this research.
To operationalize this model we calculated Social Vulnerability and used existing Hazards Susceptibility maps to combine into the overall Place Vulnerability (Cutter et al., 2000). This combination of Hazard and Vulnerability follows the rationale of the Risk equation, but we will refer to this combination using the terminology of this model – Place Vulnerability. The model can be applied to one Hazard or multi-Hazard to address several Hazards concurrently (Cutter et al., 2000).
2.5. Importance of Scale
The word scale is used with different meanings, to some extent contradictory (Longley, Goodchild, Maguire, & Rhind, 2005). There are different types of scales (i.e. spatial, temporal) and researchers also refer to scale of the phenomenon and scale of observation. The first
18
refers to the scale or extent at which the phenomenon or process manifests itself. The scale of observation refers to the way we measure or observe it and includes the extent (i.e. small or large area of observation) and spatial resolution (i.e. density or data aggregation)(Fekete et al., 2010). Spatial resolution includes finer scales (i.e. more detailed, small statistical units) and coarser scales (i.e. more aggregated data) (Longley et al., 2005).
The scale of a map refers to the ratio of distance on the map and the real distance. Large scale maps represent a small area but with many details (i.e. city block) and small scale maps illustrate a larger area but with little detail (i.e. continents)(Longley et al., 2005). In this research, the extension of the analysis is the island of Madeira and resolution includes three different data aggregation units, from the finer data aggregated by sub-block and block, to coarser aggregation by parish. We refer to each statistical spatial entity as data aggregation units.
Scale and data aggregation can potentially create some problems like the Modifiable Areal Unit Problem (MAUP) and the Ecological Fallacy. The MAUP happens when data measures of spatial phenomena are aggregated using artificial boundaries and the resulting patterns are influenced by the shape and size of the aggregation units. The same individual may be differently represented by the aggregated values depending on the shape and size of the aggregation unit (Fekete et al., 2010; Jenerette & Wu, 2000; Longley et al., 2005).
The Ecological Fallacy is a logical fallacy in the interpretation of statistical data that may occur when generalizing from observations made on one level to another. This happens when a statistical value that has been calculated for a group is assigned to a member of that group. Because when considering a statistical unit and a value that was assigned to it we cannot be sure that a given individual inside that unit has the same value, there is always some degree of uncertainty – the Ecological Fallacy (Fekete et al., 2010; Longley et al., 2005).
Parish is the smallest administrative level in Portugal. Block and sub-block are created by the National Institute of Statistics (INE) as smaller, homogeneous units representing agglomerates of residencies within a community. This, however, does not exclude the possibility of the results being affected by MAUP and Ecological Fallacy.
For Disaster Management and Social Vulnerability assessments scale is important because it affects both the level of detail of represented elements and the accuracy of data and should be adequate to the objectives (Fekete et al., 2010; Tomaszewski, 2014). Because systems operate at different scales, and systems at different scales interact, multi-scale analysis of
19
Social Vulnerability provides a more holistic approach and a way of simplifying the integration of scales is to analyse each scale separately (Fekete et al., 2010).
Different scales allow different levels of policy and decision making (Cunha et al., 2011; Eakin & Luers, 2006). A more coarse Social Vulnerability analysis and cartography (i.e. data aggregated by regions) informs decision makers’ strategic and structural decisions but the broader patterns obtained may sacrifice local patterns and asymmetries (Cunha et al., 2011; Gall, 2007; Mendes et al., 2009). A finer approach will show local patterns and asymmetries that can be used for more operational specific interventions (Cunha et al., 2011; Fekete et al., 2010; Gall, 2007).
An assessment model performing consistently at different scales and data aggregations, will allow to compare how Social Vulnerability expresses differently at each scale and use it to create specific Risk and disasters prevention and mitigation policies (Mendes et al., 2009). Retained components and variables may vary slightly at different scales because drivers of Social Vulnerability and their relevance at different scales also differs (Mendes et al., 2009), but if the same set of variables is used, the identification of Social Vulnerability drivers will not be greatly affected by the scale of data aggregation (Schmidtlein et al., 2008). Analysis at different scales can be used to compare and validate their performance and patterns (Fekete et al., 2010). SOVI was created for counties but SOVI analysis can be performed using data with other resolution, including smaller aggregation units (Cutter et al., 2000).
In Madeira, particularly in the case of floods, debris-flows and, in less degree, landslides, the affected areas have such a limited spatial expression, although the impacts can be great, that using a small size of unit analysis is necessary.
20
3. SOCIAL VULNERABILITY IN MADEIRA
3.1 Introduction
Social Vulnerability science emphasizes that disasters are not just a product of the intensity of the extreme event but also the underlying Social Vulnerability, resulting from different demographic, socioeconomic and build environment factors that influence the capacity to cope with, resist to and recover from Hazards (Chen et al., 2013; Cutter et al., 2003; Hewitt, 1997; Wisner et al., 2004). Methodologies to assess Social Vulnerability should include the characterization of the study area, identification of the Vulnerability drivers and the implementation of a quantitative model (Polsky et al., 2007).
In this chapter we illustrate the implementation of two Social Vulnerability indexes that provide a relative measure to compare between different areas and facilitate the identification of priority areas of intervention (Frazier, 2012; Mendes et al., 2009).
SOVI is a particularly reliable, recognized and widely used index that can be replicated with different scales, indicators and regional contexts with similar performance, having a proven track of successful application to different areas, which suggests it is a fairly robust algorithm (Armaș & Gavriș, 2013; Borden et al., 2007; Boruff et al., 2005; Burton & Cutter, 2008; Chen et al., 2013; Cutter et al., 2006; Cutter & Finch, 2008; Guillard-Gonçalves et al., 2015; Hummell et al., 2016; Mendes, 2009; Schmidtlein et al., 2008).
Some authors argue that SOVI may join in the same Components variables regarding people’s characteristics that make them vulnerable and the structural context that helps them to cope and resist, and that this is not the best approach (Eakin & Luers, 2006; Mendes et al., 2009; Prescott-Allen, 2001). SOVI_NTH addresses that issue with a two stage process that allows to assess these two dimensions separately: Criticality (i.e. characteristics or behaviour that contribute to the frailty and disruption of the system) and Support Capacity (i.e. social resources that help to react and resist), as well as a final overall Social Vulnerability score (Cunha et al., 2011; Mendes et al., 2011, 2009).
Different data aggregation when analysing Social Vulnerability produces different spatial patterns and using smaller units reveals spatial asymmetries that are not shown when using a coarser resolution. The indexes algorithms are sensitive to the number and size of data statistical units, thus creating some challenges regarding the algorithm’s performance (Schmidtlein et al., 2008). Testing index performance in the context of Madeira, as well as its sensitivity to scale and data aggregation, is an important step to validate and create acceptance for the subsequent results of the analysis of Social Vulnerability. Comparing the
21
performance of SOVI and SOVI_NTH will allow to validate the applicability, if not even preferability, of using the SOVI_NTH version.
The analysis of performance and results of both indexes, with each unit of data aggregation, will use a set of performance and statistical parameters. To compare both indexes we will use not only statistical performance parameters but also more conceptual aspects. If the analysis determines the indexes perform well and the resulting Social Vulnerability patterns are credible in this specific context, they can be a useful spatial planning tool for those responsible for managing disasters (Chen et al., 2013; Cutter & Finch, 2008; Mendes et al., 2009).
Mapping Social Vulnerability using a simple comparative map may be an important communication tool to illustrate the patterns, distributions, asymmetries, drivers as well as the interaction with Hazards Susceptibility (Chen et al., 2013).
In this chapter we assess Social Vulnerability in Madeira island using SOVI and SOVI_NTH and three different data aggregation units. The objective is not just to illustrate Social Vulnerability patterns in Madeira but also to compare the indexes’ performance and results, analyse the sensitivity to changes in scale and data aggregation and test the applicability in very small statistical units.
3.2 Study Area
The Archipelago of Madeira (Figure 2) is located between the 30º01’N and 33º08’N parallels and the 15º51’W and 17º16’W meridians, in the North Atlantic. It includes the Islands of Madeira, Porto Santo, Desertas’ islands and Selvagens’ islands.The archipelago is located to the Southwest of the Iberian Peninsula, North of the Canaries and the Southwest of Continental Portugal - 950 km Southwest of Lisbon (M. Ribeiro & Ramalho, 2007).
Madeira is the largest island of the archipelago with around 740 km2, an elongated, almost
rectangular form, with a length of about 58 km in the E-W direction and a width of 23Km in the N-S direction, with 10 municipalities that account forover 92% of the archipelago area and over 98% of its population (Brum da Silveira, Madeira, Ramalho, Fonseca, & Prada, 2010; M. Ribeiro & Ramalho, 2007; O. Ribeiro, 1985).
22
The island is constituted mainly by volcanic rocks, with some
sedimentary formations of
limited importance associated to the erosion of igneous rocks (A. Almeida et al., 2003; M. Ribeiro & Ramalho, 2007). The erosion and drainage characteristics of the basaltic rocks, the layers of basalt intercalated with pyroclastic materials, fractured basalt, existence of deposits of mass movements and alluvial fans, declivity of the landforms, slope instability and the frequent events of extreme precipitation, creates a combination of factors that favors the occurrence of rockfalls, topples, major landslides and debris-flows (Brum da Silveira et al., 2010; Quintal, 1999; Rodrigues, 2005). The island is distant from the Atlantic Rift (1600km to the East) and the Azores-Gibraltar Fault (500km to the South) and has no significative Risk of volcanic or seismic events, but seismicity, even if low intensity, can trigger landslides, particularly if occurring during or immediately after intense precipitation (Brum da Silveira et al., 2010). Although very unlikely, the volcanic and seismic events are not completely ruled out (Brum da Silveira et al., 2010; Prada, 2000).
Madeira’s landscape is marked by high peaks and deep and eroded valleys (Ribeiro, 1985). The average altitude is 646 m, about 95% of the territory is above 500 meters and about a quarter has an altitude above 1000m, being the percentage of area below 100 m of altitude only residual (A. Almeida et al., 2003; M. Ribeiro & Ramalho, 2007; P. Silva, 2007).
The average slope of the island is 56% and about two-thirds of its area has a slope higher than 25%. The morphology of the island, particularly the irregular relief, was influenced by the volcanic structures, the youth of its relief and the nature of its rocks, the presence of alternations, in varying thickness, of materials with very different characteristics - very strong basalts and extremely friable pyroclastic materials. Sea level variations, rainfall and time of exposure to erosion agents were also determinant in the creation of landforms (A. Almeida et al., 2003; Brum da Silveira et al., 2010; Carvalho & Brandão, 1991; M. Ribeiro & Ramalho, 2007; P. Silva, 2007).
23
Precipitation events create superficial drainage and rivers of torrential regime, that erode depressions, particularly in soft permeable pyroclastic materials, leaving abrupt slopes that often collapse due to gravity and slope instability (Carvalho & Brandão, 1991). Pyroclastic rocks, when in contact with the atmospheric agents, disintegrate rapidly, thus allowing their rapid transport by rainwater and rivers (M. Ribeiro & Ramalho, 2007). These characteristics contribute to the frequency of landslides, rockfalls and debris-flows, known locally as ‘Aluviões’.
On the coast, erosion produced high cliffs, interspersed by coves where small shingle beaches are formed and with vestiges of major topples and rockfalls, especially on the North coast of the island. The retreat of the coast depends on the energy of the sea and the resistance of the rocks. Rockfalls and topples are natural Hazards that occur frequently (Nascimento, 1990; Prada, 2000; M. Ribeiro & Ramalho, 2007). There are also records of major landslides in coastal cliffs causing tsunamis, including one in 1930 that killed 29 people (Rodrigues, 2005). The climate of Madeira is strongly influenced by the Azores Anticyclone, Latitude, atmospheric circulation, exposure and relief (Brum da Silveira et al., 2010). The great local variability in the distribution of precipitation and temperature values in the island is due to the irregular relief, differences in altitude, shape and orientation of the island approximately perpendicular to the direction of the prevailing North-easterly winds (A. Almeida et al., 2003; Prada, 2000). The East-West orientation of the central mountain range and plateaus, with altitudes above 1200m, almost perpendicular to the prevailing North-easterly winds, determines a protected and sunny South slope, and a more exposed and rainy North slope. Madeira's climate has similarities with Mediterranean climate (Ribeiro, 1985), though smoother, predominantly temperate with oceanic influence (A. Almeida et al., 2003; Machado, 1970). The Northern slope of the island, due to its exposure and prevailing winds, has more precipitation and lower temperatures than the Southern slope. The average annual air temperature varies between 9º C and 19º C and temperatures below 0ºc are rare and limited to high altitude areas (A. Almeida et al., 2003). The weighted average annual precipitation in Madeira is 1689 mm, with values between 600mm and 2900mm, concentrated mainly between October and April (A. Almeida et al., 2003). Northern and Northeasterly winds are prevailing, and the average maximum speed stays under 30 km/h. In Winter, the depression systems that cross the Atlantic, influenced by the anticyclone of Western Europe or the Polar Front, sometimes affect Madeira causing abundant precipitation in a short time, triggering flash floods and debris-flows as well as landslides and
24
rockfalls (A. Almeida et al., 2003). Occasionally, East winds from the Sahara accompanied by masses of hot dry air cause high temperatures and low Relative Humidity periods, favorable to severe forest fires (A. Almeida et al., 2003).
The rivers of Madeira Island present characteristics typical of mountain rivers, running in generally deep and narrow valleys flanked by enormous cliffs and diverge from the central peaks of the island flowing roughly perpendicular to the coastline (A. Almeida et al., 2003; M. Ribeiro & Ramalho, 2007). Almost all major streams have slopes greater than 1200m and extensions that rarely reach 20 Km (A. Almeida et al., 2003). The rivers of Madeira Island have torrential regime during the winter and dry in the summer, reflecting the relief of the islands and the precipitation regime (A. Almeida et al., 2003; M. Ribeiro & Ramalho, 2007).
Rivers with major longitudinal slopes and narrower valleys occur in areas of mostly non-altered basaltic mantles. Where there is a predominance of pyroclastic levels or deeply altered mantles, wider valleys occur. Extremely concentrated precipitation and very fast flow of water in steep narrow valleys, combined with basins with a small time of concentration and the abundance of eroded solid material in instable slopes, creates the conditions for the occurrence of very destructive floods, debris-flows and landslides that are among the most destructive Hazards in the island (Policarpo, 2012; Rodrigues, 2005; Sepúlveda, 2011). The island of Madeira has a diverse vegetation, from xerophyte vegetation on the coast, followed by transition forest and by Laurissilva forest, located between 600 and 1300m in altitude, to Urzal vegetation at higher altitude areas (Quintal, 1996). Large areas, about 2/3 of the island, are protected areas, including Laurissilva forest. Vegetation plays a very important role in the defense against erosion on the steep slopes of the Island and is a key aspect of managing geomorphological and hydrological Risks (i.e. erosion, landslides, floods, debris-flows) (Pimenta de França, 2003; Quintal, 1996; SRA, 2003). Forest area occupies a large part of the island, mainly Laurissilva forest. According to the Corine Land Cover 2012, forests occupy 44% of the island, urbanized areas 15%, agricultural areas 15% and natural pastures and moors 18%.
Madeira Island, with its ten municipalities (Figure 3), has a population of 262302 (47% are men), which is 98% of the archipelago population. The daily floating population, mainly due to tourism, is around 20000 people. Funchal is the most populated municipality with 111892 inhabitants (43%). The Southeast municipalities, Santa Cruz (43005), Câmara de Lobos (35666), Machico (21828) and Funchal concentrate 81% of the island’s population which is