ABSTRACT:Introduction: Tuberculosis remains as a global public health problem and its occurrence and distribution is associated with social inequalities. Itaboraí is among the priority Brazilian municipalities for tuberculosis control. The study aimed to combine social indicators into a composite indicator to measure differences in living conditions of the population in Itaboraí, as well as evidence of health inequalities related to tuberculosis. Methods: An ecological study, with spatial analysis of tuberculosis and its relation to socioeconomic and demographic status of households. Data were obtained from individuals declared in the Mortality Information System (SIM), notiied in the Notiication of Injury Information System – SINAN or Tuberculosis Special Treatment Information System – SITETB from 2007 to 2013. Results: Evidence indicates association between sociodemographic inequalities and occurrence of tuberculosis in the population. Findings point to a lower percentage of healing and a higher percentage of abandonment and death in areas with high social vulnerability, with a relative risk over twice as high than that found in areas of lower vulnerability. Conclusion: The study showed strong evidence that the inluence of unequal sociodemographic conditions have a negative impact on health conditions of the population in Itaboraí.
Keywords: Health inequalities. Epidemiological surveillance. Social vulnerability. Spatial analysis.
Socio-spatial inequalities related to tuberculosis
in the city of Itaboraí, Rio de Janeiro
Desigualdades socioespaciais relacionadas à tuberculose
no município de Itaboraí, Rio de Janeiro
Pedro Alves FilhoI, Alberto Pellegrini FilhoII, Patrícia Tavares RibeiroII,
Luciano Medeiros de ToledoIII, Anselmo Rocha RomãoIV, Luiz Carlos Maciel NovaesV
ISubsecretariat of Health Surveillance, State Health Secretariat – Rio de Janeiro (RJ), Brazil.
IICenter of Studies, Policies and Information about Social Determinands of Health, Escola Nacional de Saúde Pública Sergio Arouca,
Fundação Oswaldo Cruz – Manguinhos (RJ), Brazil.
IIIDepartamento de Endemias Samuel Pessoa, Escola Nacional de Saúde Pública Sergio Arouca, Fundação Oswaldo Cruz –
Manguinhos (RJ), Brazil.
IVGroup of Geoprocessing, Instituto de Comunicação e Informação Cientíica e Tecnológica em Saúde, Fundação Oswaldo Cruz –
Manguinhos (RJ), Brazil.
VDepartment of Collective Health, Universidade Federal Fluminense – Niterói (RJ), Brazil.
Corresponding author: Pedro Alves Filho. Rua Dr. Nelson de Sá Earp, 210/605, Centro, CEP: 25680-195, Petrópolis, RJ, Brasil. E-mail: [email protected]
INTRODUCTION
The World Health Organization (WHO)1 deines social determinants as social
con-ditions in which people live and work. Social determinants of health (SDH)2 are
eco-nomic, social, cultural, ethnic/racial, psychological and behavioral factors that interfere in the onset of diseases. Inequity in health is an inequality that should not exist, since it is avoidable, unfair and unnecessary3. The fundamental premise of equity is “social
jus-tice”, passing by the processes that reveal inadmissible disparities in health of socially unequal populations4,5.
Health problems related with infectious diseases, such as tuberculosis (TB) and the Acquired Immunodeiciency Syndrome (AIDS), still persist in the scenario of morbidity found in the country6. Some determinants of this scenario is the permanence of structural
problems, precarious life conditions and continuous harm to the environment.7,8
Recent studies reinforce the assumption that there is a socioeconomic gradient asso-ciated with the occurrence and distribution of TB, considered as a public health issue9,10.
An important indicator of inequity is the diiculty to access adequate and opportune treatment11. Itaboraí is among the priority Brazilian municipalities for TB control, since
it is in the area comprehended by the Petrochemical Complex of the State of Rio de Janeiro (COMPERJ)12.
The objectives of the study were:
1. to combine social indicators into a synthesized indicator to express the diferences in the life conditions of the population; and
RESUMO:Introdução: A tuberculose ainda é um problema de saúde pública mundial e sua ocorrência e distribuição estão associadas às desigualdades sociais. Itaboraí está entre os municípios brasileiros prioritários para o controle dessa doença. Os objetivos deste estudo foram combinar indicadores sociais em um indicador sintético para mensurar as diferenças nas condições de vida da população de Itaboraí, assim como evidenciar prováveis desigualdades em saúde relacionadas à tuberculose. Métodos:Estudo ecológico, com análise espacial da tuberculose e sua relação com a situação socioeconômica e demográica das famílias residentes. Os dados foram obtidos de indivíduos residentes, declarados no Sistema de Informação sobre Mortalidade (SIM), notiicados no Sistema de Informação de Agravos de Notiicação (SINAN) ou registrados no Sistema de Informação de Tratamentos Especiais de Tuberculose (SITETB), entre 2007 a 2013. Resultados:Evidências indicam associação entre desigualdades sociodemográicas e ocorrência de tuberculose na população. Achados apontam menor percentual de cura e maior percentagem de abandono e óbito em áreas com maior vulnerabilidade social, com risco relativo mais de duas vezes superior ao encontrado nas áreas de menor vulnerabilidade. Conclusão:O estudo demonstrou fortes evidências de que a inluência de condições sociodemográicas desiguais tem efeitos perniciosos nas condições de saúde da população em Itaboraí.
2. to show probable inequalities related with the epidemiological proile of TB between neighborhoods, using the technique of the environmental signature related with the incidence of TB in an environment of Geographic Information System (SIG).
METHODOLOGY
Ecological study whose units of analysis were 71 neighborhoods of Itaboraí, conducted a spatial analysis of cases of TB and the relationship with the socioeconomic status of the families living there, mapping vulnerabilities by socioeconomic status and measuring inequalities in the incidence rates between neighborhoods. Data were obtained from the inhabitants, declared in the Mortality Information System (SIM), notiied in the Information System for Notiiable Diseases (SINAN), or registered in the Information System of Special Treatments of Tuberculosis (SITETB), between 2007 and 2013.
Itaboraí belongs to the Metropolitan Region of Rio de Janeiro, with an area of 423.95 km² and population density of 514.42 inhab/km². From 2000 to 2010, its population grew at an average annual rate of 1.63% — in Brazil, this rate was 1.17%. The Human Development Index (HDI) was 0.693, in 2010, which places Itaboraí in the median range of development. The estimated population in 2016 was 230,786 inhabitants13. The city also has high
inci-dence rates of TB, with expressive changes in the urban area, coming from the installation of COMPERJ14.
INCLUSION AND EXCLUSION CRITERIA
A new case was the one whose notiication presented the ield “type of entry” as “new case” or “does not know”, in the period between January 1st, 2007, and December 31st, 2013.
The exclusion criteria were:
1. Cases of duplicity;
2. Cases of entry for recurrence, re-entry or transfer;
3. Cases whose outcome is “change in diagnosis”15.
STATISTICAL ANALYSIS
Linear regression models were used, according to similar studies,16,17 adjusted for the mean
of speciic incidence rates, in the period of implementation of COMPERJ (2007 – 2013). Secondary data from the Municipal Secretariat and State Secretariat of Health were used, as well as information about geographic and socioeconomic conditions from the Brazilian Institute of Geography and Statistics (IBGE).
1. construction of the Social Vulnerability Index (SVI);
2. linkage of databases; and
3. mapping of new cases with geoprocessing.
The theme map of SVI used the digital database per census sector18. Using
geoprocess-ing techniques, the tool Dissolve, SIG ArcGIS, census sectors and the set of attributes were aggregated to create a cartographic base per neighborhood (unit of analysis). The data of the census sectors were transferred to the respective neighborhoods, being used as a refer-ence both for analyses involving the cartographic base and those operating over socioeco-nomic and demographic elements.
Considering a probable variation in the age structure of the population, by an indirect method, the following were calculated: incidence rate of neighborhoods, adjusted by age, using the municipality’s rate as pattern. After the neighborhood stratiication, according to social vulnerability, the cumulative incidence of the population in the middle of the period (census 2010) was calculated19, examining the behavior of the rate and the stratum-relative risk.
SVI is the synthetic index of socioeconomic and demographic indicators per neighbor-hood. Like the Paulista Social Vulnerability Index (PSVI)20,21, the SVI identiies areas in
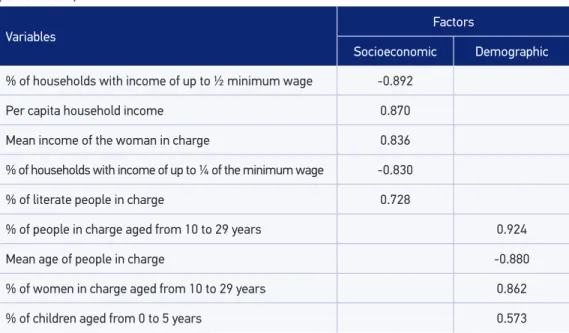
accor-dance with gradients in vulnerability in the population. The components of SVI are iden-tiied in Table 1. In the statistical data approach, the factor analysis was used and deined the main components, generating two scores — socioeconomic factor and demographic factor —, employed as independent variables in the regression.
Table 1. Variables associated with the subjacent dimensions and respective correlation values (factor loads).
Variables
Factors
Socioeconomic Demographic
% of households with income of up to ½ minimum wage -0.892
Per capita household income 0.870
Mean income of the woman in charge 0.836
% of households with income of up to ¼ of the minimum wage -0.830
% of literate people in charge 0.728
% of people in charge aged from 10 to 29 years 0.924
Mean age of people in charge -0.880
% of women in charge aged from 10 to 29 years 0.862
% of children aged from 0 to 5 years 0.573
The factor analysis followed these conditions22:
1. All variables were continuous;
2. Method of extraction of factors by main components; and
3. Rotation of factors using the Varimax orthogonal method.
The Kaiser criterion (KMO) of the sample was 0.744, higher to the critical threshold of 0.600. The Bartlett’s test (BTS) was statistically signiicant (p < 0.000). The choice was to analyze the main components because of the facility to sum up the set of data. The decliv-ity diagram was used to analyze the dispersion of factors (two were selected for the abrupt reduction in variance). The Varimax rotation tried to minimize the number of variables with high load in each factor.
The normality of continuous variables was assessed by the Kolmogorov-Smirnov test. Associations between independent variables and the mean incidence rate of TB were tested by simple and multiple linear regression. Explanatory variables that did not present collinearity, assessed by the VIF test (variance inlation factor) were introduced by the model and selected by the Backward Method. In the inal phase, it was possible to observe the normality of the residuals using the Shapiro Wilk test (p > 0.05), and absence of heteroskedasticity.
Relative risk (RR) and conidence intervals were used to assess the relationship between the strata, according to vulnerability and incidence. Categorical variables were compared between the groups by the χ2 test and the Fisher’s test. The signiicance level in the analyses
was 5%. The data were analyzed with the Statistical Package for the Social Sciences (SPSS) 21.0. The list of records used the software RecLink III23 to carry out the probability method,
based on the conjoined use of common ields of databases — for example, name, sex and date of birth —, in order to identify the probability that a pair of records is referring to the same person.
For the veriication of deaths, all of those that had as a basic or associated cause the codes A15 – A19 (10th review of the International Classiication of Diseases – ICD) were selected. Linkage was conducted in ive steps, according to a speciic blockage protocol24.
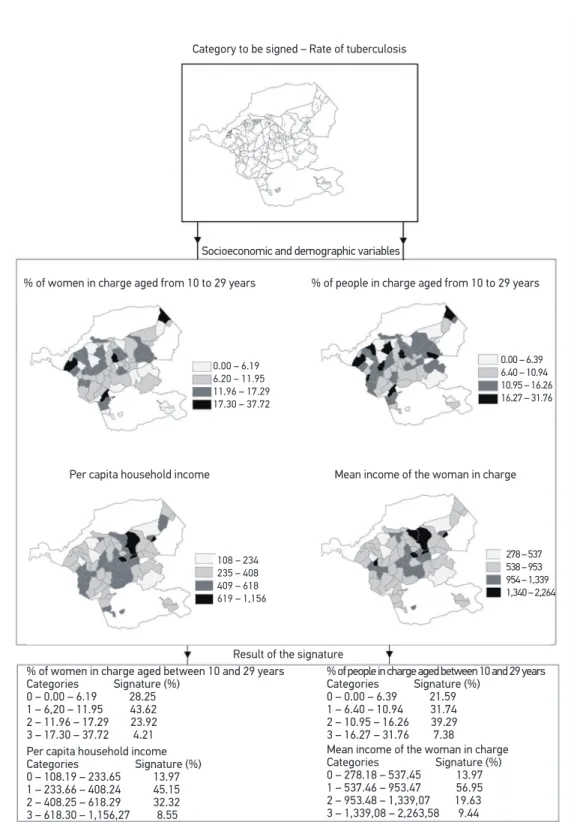
For the environmental signature, there were thematic maps referring to the variables of SVI and rates of TB (density of points), in which each point corresponds to one case per one thousand inhabitants. SIG ArcGIS 10.0 was used to create vectorial thematic maps, then transformed in images, exported to SIG Vista Saga and georeferenced in the raster format; the extraction of the environmental signature was conducted by using the signature tool of the system. With the environmental signature, based on the socioeco-nomic and demographic variables, it was possible to identify in which strata the TB rate was most expressive25.
The environmental signature looked for unique aspects of the incidence of TB in a SIG environment, using plans of georeferenced information, represented by socioeco-nomic and demographic variables of the SVI. It was possible to identify in which strata, represented by the scales of measurement of the diferent variables, the incidence was more representative. Being a heuristic procedure25 based on empirical proof about the
possible causal associations between the environmental variables, the use of this tech-nique allows associations between the variables expressed in the diferent scales of mea-surement, both numeric and categorical.
The environmental signature assumes that the event of interest is a target or a ground truth, with territorial expression and speciic socioeconomic characteristics. Therefore, a situation of health translates itself as a manifestation of the location28.
The attributable risk (AR) and the population attributable risk (PAR) were chosen because the former measures the excess risk in the group exposed associated with exposure, whereas the latter is the measurement of the association inluenced by the prevalence of the factor in the general population, measuring the percentage reduction of cases that can be pre-vented if the risk factor is removed. The AR in the total population is important because it allows knowing which percentage of the event will be reduced by eicient measures of prevention and control29.
This project was approved by the Research Ethics Committee (CEP) at the National School of Public Health (ENSP) (process n. 682.428/2014).
RESULTS
In Table 1, KMO is observed and used in the analysis of the main components, with two factors: the irst one with eigenvalue, of 4.17, and 46.37% of variance; and the second one with eigenvalue of 2.26, and 25% of the variance. These two factors explained 71.47% of the variability found among the original variables.
As to the number of cases, some authors22 suggest samples superior to 50 observations,
or a ratio between the number of cases and the number of variables exceeding ive to one. In this study, the number of neighborhoods accounted for 71 units, using nine variables in the factor analysis, leading to radio that exceeds seven cases to one.
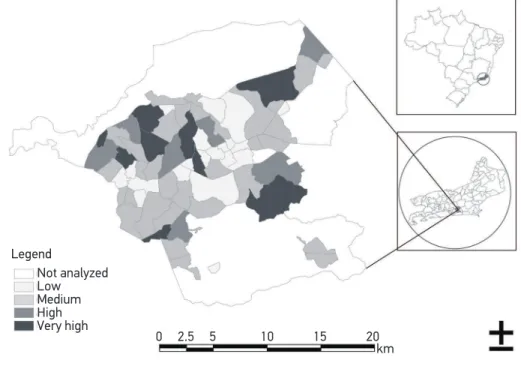
According to the SVI classiication, the number of categories was clustered in: low, mean, high and very high vulnerability (Figure 1), and that categorization identiied the groups of neighborhoods in this study. The limits of each neighborhood were deined by the gray line. Some areas did not have enough information in the Census and were not included in the analysis, especially the North area in the COMPERJ.
This study veriied 79 death records, and only 25 (31.6%) of these were found in SINAN notiications. By adding the 54 deaths declared in SIM to the 943 cases of SINAN, there were 997 records. Of these, 159 were excluded (88 with ignored address and 71 with incomplete information about the address). Among the excluded records, most (28.4%) were aged from 30 to 39 years and were male (68.0%). The cumulative incidence rate of the city was 442.8 cases per 100 thousand inhabitants.
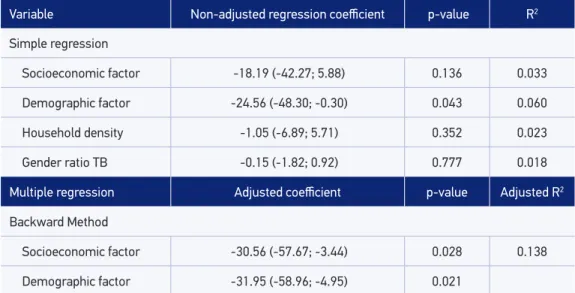
In multiple regression, the dependent variable was the mean incidence rate of TB. The independent variables were: socioeconomic factor; demographic factor; household density (ive or more people per household); and ratio of sexes in cases of TB. After the con-irmation by the Backward Method30, two factors of the analysis of the main components
remained (socioeconomic and demographic). The inal equation was: [Incidence Rate of TB = 95.57 – 30.6 (socioeconomic) – 31.9 (demographic)].
The resulting model (Table 2) presented an adjusted coeicient of determination (R2)
that explained 13.8% of the variability in the mean incidence rate of TB (R = 0.413 and adjusted R2 = 0.138). There was an inverse correlation between the rate of TB and
pre-dictive variables: socioeconomic (ß= -30.6; p < 0.05) and demographic factor (ß = -31.9; p < 0.05). That is, the higher the socioeconomic level, the lower the incidence of TB in the period. And the higher the proportion of children and young women in the household, the lower the incidence. In the model, the mean incidence rate is equal to 95.57 (general mean),
Not analyzed Low Medium High Very high
0 2.5 5 10 15 20 km Legend
Source: Map elaborated based on the data publicized by Census 2010 and the Brazilian Institute of Geography and Statistics (IBGE).
when predictive variables are equal to zero. For each increase of unit in the socioeconomic and demographic factors, there was a reduction of 30.6 and 31.9 points in the mean of the response variable.
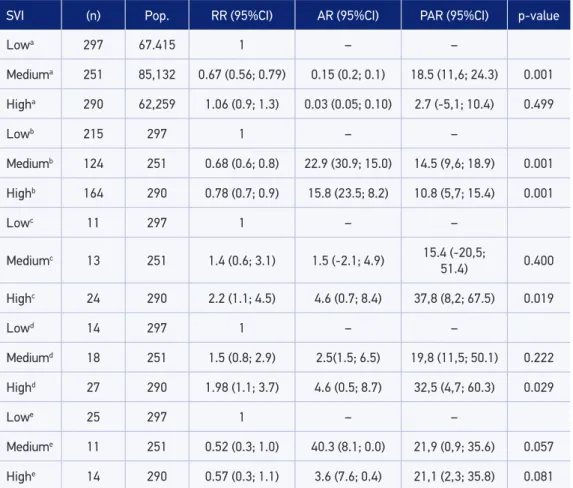
In Table 3, neighborhoods with “high” and “very high” vulnerability were combined in a single category (high). The inal coniguration of neighborhoods by SIV was: neighbor-hoods of low (20); medium (31) and high vulnerability (20). As to new cases, the risk of TB was 33% lower (RR = 0.67) in neighborhoods with medium SVI (p < 0.001) in relation to the group with low SVI. For the percentage of cure, relative risk was 32% lower (RR = 0.68) in neighborhoods of medium vulnerability (p < 0.001), whereas in neighborhoods with high vulnerability, the risk (RR = 0.78) was 22% lower (p < 0.001). As to the percent-age of abandonment there was twice as many risls (RR = 2.23) in the neighborhoods with high vulnerability (p < 0.05). The proportion of deaths showed risk almost twice as high (RR = 1.98) in neighborhoods with high vulnerability (p < 0.05) in comparison to those that are not exposed (low SVI).
There was no association for the percentage of HIV (Human Immunodeiciency Virus) among neighborhoods, but it is important to mention that almost half of the risk of the coin-fection TB/HIV was found in neighborhoods of medium and high vulnerability (RR = 0.52 and RR = 0.57). As to the risk of multi-resistant TB (MRTB), there was no signiicant asso-ciation between neighborhoods.
In the analysis of ARs (Table 3) the following stand out: lower population risk (18.5%) for new cases in neighborhoods with mean SVI; lower probability of attributable cure (AR = 22.9% and AR = 15.8%) to those exposed (medium and high SVI); percentage reduction of the number of healed cases in the population (PAR = 14.5 and 10.8%), with medium
Table 2. Analysis of simple and multiple linear regression between the mean rate of tuberculosis and socioeconomic and demographic factors in the neighborhoods of Itaboraí, 2007 to 2013.
Variable Non-adjusted regression coeicient p-value R2
Simple regression
Socioeconomic factor -18.19 (-42.27; 5.88) 0.136 0.033
Demographic factor -24.56 (-48.30; -0.30) 0.043 0.060
Household density -1.05 (-6.89; 5.71) 0.352 0.023
Gender ratio TB -0.15 (-1.82; 0.92) 0.777 0.018
Multiple regression Adjusted coeicient p-value Adjusted R2
Backward Method
Socioeconomic factor -30.56 (-57.67; -3.44) 0.028 0.138
Demographic factor -31.95 (-58.96; -4.95) 0.021
Table 3. Cases of tuberculosis coming from linkage and measures of association according to the social vulnerability of neighborhoods in Itaboraí, 2007 to 2013.
SVI (n) Pop. RR (95%CI) AR (95%CI) PAR (95%CI) p-value
Lowa 297 67.415 1 – –
Mediuma 251 85,132 0.67 (0.56; 0.79) 0.15 (0.2; 0.1) 18.5 (11,6; 24.3) 0.001
Higha 290 62,259 1.06 (0.9; 1.3) 0.03 (0.05; 0.10) 2.7 (-5,1; 10.4) 0.499
Lowb 215 297 1 – –
Mediumb 124 251 0.68 (0.6; 0.8) 22.9 (30.9; 15.0) 14.5 (9,6; 18.9) 0.001
Highb 164 290 0.78 (0.7; 0.9) 15.8 (23.5; 8.2) 10.8 (5,7; 15.4) 0.001
Lowc 11 297 1 – –
Mediumc 13 251 1.4 (0.6; 3.1) 1.5 (-2.1; 4.9) 15.4 (-20,5;
51.4) 0.400
Highc 24 290 2.2 (1.1; 4.5) 4.6 (0.7; 8.4) 37,8 (8,2; 67.5) 0.019
Lowd 14 297 1 – –
Mediumd 18 251 1.5 (0.8; 2.9) 2.5(1.5; 6.5) 19,8 (11,5; 50.1) 0.222
Highd 27 290 1.98 (1.1; 3.7) 4.6 (0.5; 8.7) 32,5 (4,7; 60.3) 0.029
Lowe 25 297 1 – –
Mediume 11 251 0.52 (0.3; 1.0) 40.3 (8.1; 0.0) 21,9 (0,9; 35.6) 0.057
Highe 14 290 0.57 (0.3; 1.1) 3.6 (7.6; 0.4) 21,1 (2,3; 35.8) 0.081
a%new case; b%cure; c%abandonment; d%death; e%HIV; (χ2/Fisher test)31; SVI: Social Vulnerability Index; RR: relative
risk; 95%CI: 95% conidence interval; AR: attributable risk; PAR: Population attributable risk.
and high SVI; increasing percentage of abandonment in neighborhoods with high SVI (PAR = 37.8%); and increasing percentage of deaths in neighborhoods with high vulnera-bility (PAR = 32.5%). All statistics were obtained by the χ2 test and by Fisher’s exact test31.
In Figure 2, the percentage of the main variables analyzed according to the environ-mental signature were veriied (vulnerability map). The levels of aggregation of the vari-ables, according with the incidence rate of TB, were deined by adapting the natural breaks method for the intervals.
0.00 – 6.19 6.20 – 11.95 11.96 – 17.29 17.30 – 37.72
Per capita household income Categories Signature (%) 0 – 108.19 – 233.65 13.97 1 – 233.66 – 408.24 45.15 2 – 408.25 – 618.29 32.32 3 – 618.30 – 1,156,27 8.55
% of people in charge aged between 10 and 29 years Categories Signature (%)
0 – 0.00 – 6.39 21.59 1 – 6.40 – 10.94 31.74 2 – 10.95 – 16.26 39.29 3 – 16.27 – 31.76 7.38 Category to be signed – Rate of tuberculosis
Socioeconomic and demographic variables
% of women in charge aged from 10 to 29 years % of people in charge aged from 10 to 29 years
Per capita household income Mean income of the woman in charge
0.00 – 6.39 6.40 – 10.94 10.95 – 16.26 16.27 – 31.76
108 – 234 235 – 408 409 – 618 619 – 1,156
278 – 537 538 – 953 954 – 1,339 1,340 – 2,264
Result of the signature % of women in charge aged between 10 and 29 years
Categories Signature (%) 0 – 0.00 – 6.19 28.25 1 – 6,20 – 11.95 43.62 2 – 11.96 – 17.29 23.92 3 – 17.30 – 37.72 4.21
Mean income of the woman in charge Categories Signature (%) 0 – 278.18 – 537.45 13.97 1 – 537.46 – 953.47 56.95 2 – 953.48 – 1,339,07 19.63 3 – 1,339,08 – 2,263,58 9.44
DISCUSSION
The results of the analysis suggest an association between sociodemographic inequal-ities and the occurrence of TB in the population of Itaboraí. The estimations found indi-cate that the higher socioeconomic status and the higher proportion of children and young women in the households, the lower the incidence of TB in the period. There is a lower percentage of cure and higher percentage of abandonment and death in areas with more social vulnerability, with relative risk values twice as high as those in the lower vulnerabil-ity areas. The results also show social and spatial inequalities related with the incidence of TB, which corroborate indings in other studies14,32.
Important information about government income transfer programs available um other studies14, contributed with the outcomes of the analyses in this study.
The WHO points out that the main social determinants responsible for the occurrence of TB at a global level are social inequality, AIDS and the constant migration between regions33,34. It was possible to predict that areas with worse life conditions presented with
higher number of cases of TB and diseases related with poverty. There was also prevalence of cases in adults and in the male sex, as reported in the global literature35.
However, some neighborhoods with low vulnerability showed high incidence rates of TB, even with adjustment by age. A possible explanation is that neighborhoods are not homogeneous clusters, with sectors in diferent socioeconomic conditions. Another pos-sibility is the implementation of COMPERJ, which generated social change for the search of better life conditions, with migration of workers to central neighborhoods, due to the higher level of urbanization, access to services and health care.
A recent study36 showed that 54% of the patients registered in the Tuberculosis Control
Program (PCT) never received a household visit from the professional following up the treatment. Also, 62% of the individuals claimed they paid for transportation until the health unit, revealing problems in the provision of transportation. This information indicates that aspects related with the surveillance of the condition and the management of health ser-vices are determinant to understand the epidemiological picture.
There was no association between the percentage of new cases of positive TB and HIV, however, the estimations found in neighborhoods of medium and high vulnerability repre-sent about half the risk of coinfection. These indings are in accordance with those in other studies, which suggest there is discrimination when seropositivity is diagnosed, inducing the patient to look for access and treatment in health units that are further from the household37,38.
Diferences regarding the access and the stigma coming from the HIV infection are prob-able sources of bias in epidemiological analyses, because the notiication depends on the proper investigation of the case. Also, the reception of these patients should consider pre-carious social conditions and the emotional impact generated by the TB/HIV comorbidity, usually greater than that experienced by TB individually39.
interruption of the chain of transmission40. Of the total of deaths, only 31.6% were
noti-ied in SINAN. That is, 68.4% were unknown by the PCT, and supposedly none of the contacts was assessed.
SIG allows the recovery of the location based on the selection of a piece of information, and vice-versa. This ability can be used to identify cases coming from primary or secondary data, allowing the elaboration of environmental signatures. Once the occurrence of inter-est is deined — probable association between sociodemographic determinants and occur-rence of TB —, the database can be consulted regarding the important characteristics of the target-area, deining its signature, recognizing the area of occurrence and the coverage of georeferenced information plans25.
The technique of environmental signature is diferent from multivariate analyses and SVI, since it is associated with the georeferenced data base (matricial structure) and because it can operate and identify attributes/topology, expressed in diferent scales (ratio, interval, ordinal, nominal). The technique enables the transit between diferent information plans at the location of the event, identifying its singularities.
The data of the environmental signature corroborate indings in several scientiic stud-ies16, in which the variables related with gender (male), age group (25 – 49 years), lower
income and schooling were associated with TB signiicantly, revealing inequality in the access to information and higher exposure of the male population.
An important limitation of the study refers to the adjustment by age. Adjustment by gender would also help correct possible biases related with the different strata. The gender ratio was used for cases of TB in the linear regression to overcome this limitation.
To use clustered data, ecological studies are limited by secondary sources, for exam-ple, quality control restriction and discrepancy of data coming from information sys-tems. The lack of information from the municipality of origin in SINAN, SITETB and SIM also prevent deeper analyses about migration. In other investigations11,41, the
collec-tion of complementary data in the TB Record Book and in the Laboratory Record Book contributed with monitoring and the feedback of systems.
By using AR and PAR, this study tried to measure the percentage of cases that could be prevented if the causal factor were neutralized, being an important measure to implement public health policies42.
CONCLUSION
1. World Health Organization (WHO). Commission on Social Determinants of Health. A conceptual framework for action on the social determinants of health. Geneva: WHO; 2007. [Internet]. Disponível em: http://www.who.int/social_determinants/ resources/csdh_framework_action_05_07.pdf ?ua=1 (Acessado em 27 de outubro de 2015).
2. Buss PM, Pellegrini Filho A. A saúde e seus determinantes sociais. Physis: Rev Saúde Coletiva 2007; 17(1): 77-93. DOI: 10.1590/S0103-73312007000100006 3. Whitehead M. A typology of actions to tackle social inequalities in health. J Epidemiol Community Health 2007; 61(6): 473-8. DOI: 10.1136/jech.2005.037242 4. Barata RB. Epidemiologia e políticas públicas. Rev
Bras Epidemiol 2013; 16(1): 3-17. DOI: 10.1590/ S1415-790X2013000100001
5. Kawachi I, Subramanian SV, Almeida-Filho N. A glossary for health inequalities. J Epidemiol Community Health 2002; 56(9): 647-52. DOI: 10.1136/jech.56.9.647 6. Carmo EH, Barreto ML, Silva JB. Mudanças nos
padrões de morbimortalidade da população brasileira: os desafios para um novo século. Epidemiol Serv Saúde 2003; 12(2): 63-75. DOI: doi.org/10.5123/ S1679-49742003000200002
7. Barreto ML, Carmo EH. Padrões de adoecimento e de morte da população brasileira: os renovados desaios para o Sistema Único de Saúde. Ciênc Saúde Coletiva 2007; 12(Suppl): 1179-90. DOI: 10.1590/ S1413-81232007000700003
8. Barreto ML, Teixeira MG, Bastos FI, Ximenes RAA, Barata RB, Rodrigues LC. Saúde no Brasil 3: sucessos e fracassos no controle de doenças infecciosas no Brasil: o contexto social e ambiental, políticas, intervenções e necessidades de pesquisa. The Lancet 2011; 6736(11): 47-60.
9. Acosta LM, Bassanesi SL. The Porto Alegre paradox: social determinants and tuberculosis incidence. Rev Bras Epidemiol 2014; 17(2): 88-101. DOI: 10.1590/1809-4503201400060008
10. San Pedro A, Oliveira RM. Tuberculose e indicadores socioeconômicos: revisão sistemática da literatura. Rev Panam Salud Pública 2013; 33(4): 294-301. DOI: 10.1590/S1020-49892013000400009
11. Pinheiro RS, Andrade VL, Oliveira GP. Subnotiicação da tuberculose no Sistema de Informação de Agravos de Notificação (SINAN): abandono primário de bacilíferos e captação de casos em outras fontes de informação usando linkage probabilístico. Cad Saúde Pública 2012; 28(8): 1559-68. DOI: 10.1590/ S0102-311X2012000800014
12. Brasil. Secretaria de Estado de Saúde do Rio de Janeiro, Gerência de Pneumologia Sanitária. Tuberculose. Rio de Janeiro (RJ), Boletim da Tuberculose 2014; 28. [Internet]. Disponível em: http://riocomsaude.rj.gov.br/Publico/ MostrarArquivo.aspx?C=wXJ%2BKouHyII%3D (Acessado em 27 de setembro de 2015).
13. United Nations Development Programme, Fundação João Pinheiro, Instituto de Pesquisa Econômica Aplicada. Atlas do Desenvolvimento Humano no Brasil.. Published 2013. [Internet]. Disponível em: http://atlasbrasil.org.br/2013/pt/peril_m/itaborai_ rj (Acessado em 10 de abril de 2017).
14. Pedro AS, Gibson G, Santos JP, Toledo LM, Sabroza PC, Oliveira RM. Tuberculosis as a marker of inequities in the context of socio-spatial transformation. Rev Saúde Pública 2017; 51: 9. DOI: 10.1590/ s1518-8787.2017051006533
15. Brasil. Ministério da Saúde. Secretaria de Vigilância em Saúde. Departamento de Vigilância das Doenças Transmissíveis. Vig ilância epidemiológ ica da tuberculose: Análise de indicadores operacionais e epidemiológicos a partir da base de dados do Sinan versão 5.0. Brasília: Ministério da Saúde; 2016. 53 p. [Internet]. Disponível em: http://portalsinan.saude. gov.br/images/documentos/Agravos/Tuberculose/ Apostila_Curso_Sinan_2016.pdf (Acessado em 29 de setembro de 2017).
16. Yamamura M, Santos Neto M, Freitas IM, Rodrigues LB, Popolin MP, Uchoa AS, et al. Tuberculose e iniquidade social em saúde: uma análise ecológica utilizando técnicas estatísticas multivariadas, São Paulo, Brasil. Pan American Journal of Public Health 2014; 35(4). [Internet]. Disponível em: http://iris.paho.org/xmlui/handle/123456789/8188 (Acessado em 29 de abril de 2016).
17. Guimarães RM, Lobo AP, Siqueira EA, Borges TF, Melo SC. Tuberculose, HIV e pobreza: tendência temporal no Brasil, Américas e mundo. J Bras Pneumol 2012; 38(4): 511-7. DOI: 10.1590/S1806-37132012000400014 18. Brasil. Instituto Brasileiro de Geograia e Estatística
(IBGE). Geociências. IBGE 2016. [Internet]. Disponível em: http://downloads.ibge.gov.br/downloads_ geociencias.htm (Acessado em 3 de junho de 2016). 19. Brasil. Instituto Brasileiro de Geograia e Estatística
(IBGE). Censo Demográfico 2010. Indicadores Sociais Municipais - Uma análise dos resultados do universo do Censo Demográfico 2010. [Internet]. Disponível em: ftp://ftp.ibge.gov.br/Censos/ Censo_Demograico_2010/Cadastro_Nacional_ de_Enderecos_Fins_Estatisticos/ (Acessado em 25 de setembro de 2015).
20. Kaztman R. Seducidos y abandonados: el aislamiento social de los pobres urbanos. Rev Cepal 2001; 75: 171-189.
21. Ferreira MP, Dini NP, Ferreira SP. Espaços e dimensões da pobreza nos municípios do Estado de São Paulo: índice paulista de vulnerabilidade social – IPVS. São Paulo em Perspectiva 2006; 20(1): 5-17.
22. Figueiredo Filho DB, Silva Júnior JÁ. Visão além do alcance: uma introdução à análise fatorial. Opin Publica 2010; 16(1): 160-85. DOI: 10.1590/ S0104-62762010000100007
23. Camargo Jr KR, Coeli CM. Reclink: aplicativo para o relacionamento de bases de dados, implementando o método probabilistic record linkage. Cad Saúde Pública 2000; 16(2): 439-47. DOI: 10.1590/ S0102-311X2000000200014
24. Coeli CM, Camargo Jr KR. Avaliação de diferentes estratég ias de blocagem no relacionamento probabilístico de registros. Rev Bras Epidemiol 2002; 5(2): 185-96. DOI: 10.1590/S1415-790X2002000200006 25. Silva JX. Geoprocessamento para análise ambiental.
Rio de Janeiro 2001; 1. [Internet]. Disponível em: http://www.viconsaga.com.br/lageop/. (Acessado em 3 de junho de 2016).
26. Rosa AN, Sano EE, Souza EB, Baptista GM, Brites RS, Meneses PR, et al. Sensoriamento Remoto: Princípios. Brasília: UnB; 2012. [Internet]. Disponível em: http://www.cnpq.br/documents/10157/56b578c4-0fd5-4b9f-b82a-e9693e4f69d8 (Acessado em 28 de outubro de 2015).
27. Silva JX. Sistema de Análise Geo-Ambiental. Análise Ambiental. Instituto de Geociências. Universidade Federal do Rio de Janeiro 2006. [Internet]. Disponível em: http://www.viconsaga.com.br/lageop/saga.php (Acessado em 27 de setembro de 2015).
28. Barcellos CC, Sabroza PC, Peiter P, Rojas LI. Organização espacial, saúde e qualidade de vida: análise espacial e uso de indicadores na avaliação de situações de saúde. Inf Epidemiol Sus 2002; 11(3): 129-30. DOI: 10.5123/S0104-16732002000300003 29. Schneider MC, Castillo-Salgado C, Bacallao J,
Loyola E, Mujica OJ, Vidaurre M, et al. Métodos de mensuração das desigualdades em saúde. Rev Panan Salud Publica 2002; 12(6): 398-414. DOI: 10.1590/ S1020-49892002001200006
30. Zimmer J, Anzanello MJ. A new framework for predictive variable selection based on variable importance indices. Prod 2014; 24(1): 84-93. DOI: 10.1590/S0103-65132013005000030
31. Sullivan KM, Dean A, Soe MM. OpenEpi: A web-based epidemiologic and statistical calculator for public health. Public Health Rep 2009; 124(3): 471-4. DOI: 10.1177/003335490912400320
32. Oren E, Koepsell T, Leroux BG, Mayer J. Area-based socio-economic disadvantage and tuberculosis incidence. Int J Tuberc Lung Dis 2012; 16(7): 880-5. DOI: 10.5588/ijtld.11.0700
33. World Health Organization (WHO). Global Tuberculosis Control 2011. WHO; 2011. [Internet]. Disponível em: http://a pps.who.int/iris/ bitstream/10665/44728/1/9789241564380_eng.pdf (Acessado em 27 de setembro de 2015).
34. Lacerda SN, Temoteo RC, Figueiredo TM, Luna FD, Sousa MA, Abreu LC, et al. Individual and social vulnerabilities upon acquiring tuberculosis: a literature systematic review. Int Arch Med 2014; 7(1): 35. DOI: 10.1186/1755-7682-7-35
35. Nava-Aquilera E, Andersson N, Harris E, Mitchell S, Hamel C, Shea B, et al. Risk factors associated with recent transmission of tuberculosis: systematic review and meta-analysis. Int J Tuberc Lung Dis 2009; 13(1): 17-26.
36. Lafaiete RS, Silva CB, Oliveira MG, Motta MC, Villa TC. Investigação sobre o acesso ao tratamento de tuberculose em Itaboraí/RJ. Esc Anna Nery 2011; 15(1): 47-53. DOI: 10.1590/S1414-81452011000100007 37. Pereira PP, Monteiro S, Villela W. Estigma e Saúde.
Editora Fiocruz 2013. Ciênc Saúde Coletiva 2015; 20(4): 1307-8. DOI: 10.1590/1413-81232015204.00092014 38. Monteiro S, Villela WV, Knauth D. Discrimination,
stigma, and AIDS: a review of academic literature produced in Brazil (2005 – 2010). Cad Saúde Pública 2012; 28(1): 170-6. DOI: 10.1590/S0102-311X2012000100018 39. Santos Neto M, Silva FL, Sousa KR, Yamamura M,
Popolin MP, Arcêncio RA. Peril clínico e epidemiológico e prevalência da coinfecção tuberculose/HIV em uma regional de saúde no Maranhão. J Bras Pneumol 2012; 38(6): 724-32. DOI: 10.1590/S1806-37132012000600007 40. Selig L, Kritski AL, Cascão AM, Braga JU, Trajman
A, Carvalho RM. Proposta de vigilância de óbitos por tuberculose em sistemas de informação. Rev Saúde Pública 2010; 44(6): 1072-8. DOI: 10.1590/ S0034-89102010000600012
41. Bartholomay P, Oliveira GP, Pinheiro RS, Vasconcelos AM. Melhoria da qualidade das informações sobre tuberculose a partir do relacionamento entre bases de dados. Cad Saúde Pública 2014; 30(11): 2459-70. DOI: 10.1590/0102-311X00116313
42. Denholm J, Trauer J, McBryde E. Smoking and tuberculosis risk: high attributable risk in a low-incidence environment. Glob J Epidemiol Public Health 2016; 2(1): 15-17. DOI: 10.12974/2313-0946.2015.02.01.2
Received on: 10/18/2016