A Work Project, presented as part of the requirements for the Award of a Master’s Degree in Management from the NOVA – School of Business and Economics
Social Impact Bond Feasibility Study Youth Employability: Faz-te Forward
Ana Rita dos Santos Casimiro 1898
A Project carried out under the supervision of:
Prof. António Miguel, Executive Director of the Social Investment Lab
Abstract
Youth unemployment is one of the most pressing social issues in Portugal, often associated to a lack of skills. Faz-Te Forward (FFWD), a Portuguese employability programme, has demonstrated great potential for impact in solving this issue, especially amongst a neglected segment of the population – those belonging to “sandwich families”.
The present thesis, integrated in the SIB Research Programme from the Social Investment Lab, evaluates the feasibility of this programme to be financed through a Social Impact Bond, an innovative outcomes-based financing model.
From a data analysis undertaken to FFWD’s historical information, a business case for a SIB was developed.
Keywords: social impact bond; feasibility study; youth employability; Faz-te
Forward case
Foreword
The author would like to sincerely thank Professor António Miguel and Joana Cruz Ferreira, not only for their help and support during this feasibility study, but also for the way they so warmly welcomed her into their Social Investment Lab’s team. A great appreciation goes also to the authors’ family and friends, who have always been there during her academic and life adventures.
Table of Contents
1. Methodology for this Thesis ... 4
2. Social Problem ... 5
2.1. Understanding the Issue of Youth Unemployment ... 5
2.2. Risk Factors that Lead Youth to Become NEET ... 7
2.3. What is Youth Lacking After All? ... 8
2.4. The Consequences of Youth Unemployment ... 9
2.5. Alignment of Public Policies ... 10
3. Identifying a Strong Intervention Model ... 10
3.1. TESE – Associação para o Desenvolvimento ... 11
3.2. Faz-‐Te Forward ... 12
3.3. Target Population ... 12
3.4. Innovation and Differentiating Factors ... 13
4. Data Analysis | FFWD Impact ... 14
4.1. Participants’ Characteristics ... 14
4.2. Overall Performance Analysis ... 14
4.3. Performance Analysis per Characteristic ... 15
4.4. Comparison to Control Group ... 16
5. Is a SIB is a Suitable Tool for Funding Faz-‐Te Forward? ... 17
5.1. SIB: An Alternative Financing Model ... 17
6. How can a SIB be Applied to Faz-‐Te Forward? ... 19
6.1. Service provider prepared for scaling ... 19
6.2. Quantifiable Outcomes and an Effective Measurement Framework ... 19
6.3. Quantifiable Economic Benefit ... 20
6.4. Alignment with Public Policies ... 20
7. Modelling Faz-‐Te Forward SIB ... 20
7.1. Intervention Scope ... 20
7.2. Intervention Costs ... 22
7.3. Outcomes Metrics ... 23
7.4. Payment Mechanism ... 24
7.5. Public Sector Value ... 25
7.6. Investment Structure ... 25
8. SIB Business Case and Sensitivity Analysis ... 26
8.1. Business Case ... 26
8.2. Scenarios ... 26
9. Limitations ... 28
10. Next Steps to be Undertaken ... 28
10.1. Application to Portugal Inovação Social ... 28
10.2. Legal Due Diligence ... 28
10.3. Develop FFWD’s Expansion Strategy ... 29
11. Concluding Remarks ... 29
12. Bibliography ... 30
13. Appendix ... 34
1. Methodology for this Thesis
The development of the present thesis was integrated within the recently developed SIB Research Programme by the Social Investment Lab. Its main goal was to develop a feasibility study to evaluate if TESE – Associação para o Desenvolvimento’s youth employability programme, Faz-Te Forward (FFWD), is a suitable and strategic project to be invested through a Social Impact Bond (SIB), an innovative outcomes-based payment social financing model. Therefore the structure of this thesis follows a SIB feasibility methodology: 1) an overview of the social problem, 2) a description of the proposed intervention model, 3) a performance evaluation of the intervention model, 4) the application of a SIB to the intervention model, 5) a business case for its SIB applicability and scenarios.
Throughout one semester the researcher had access to a close mentoring by her supervisor when developing the study (18 one-to-one meetings), and followed a structured training plan, which included 6 training sessions, in areas such as financial modelling.
A trustworthy and valuable collaborative relationship with TESE’s director, Helena Gata, and FFWD’s coordinator, Inês Oliveria e Carmo was developed, where five in-person meetings were held, and all the necessary data from FFWD was provided. In addition, the researcher was able to undertake an ethnographic approach, and therefore a more qualitative perception of the programme, by attending 6 out of the 12 FFWD’s training sessions since the beginning of the 4th edition. Although this method was not directly used as a scientific basis for the study due to its high subjectivity, being able to observe the engagement and attitude of participants towards the programme certainly provided an increased reassurance towards FFWD real impact. A chronogram illustrating the entire project development can be found in appendix 1.
2. Social Problem
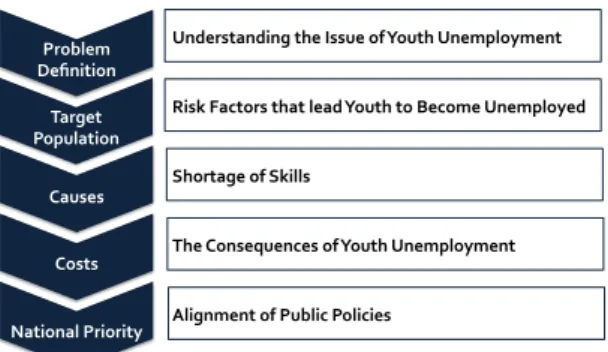
This section will develop the problem of youth unemployment in Portugal, following the structure below.
Figure 1 | Structure of Social Problem Section
2.1. Understanding the Issue of Youth Unemployment
In 2013, more than one out of three young people in the labour force were unemployed, placing Portugal as the country with the 4th highest youth unemployment rate in Europe (38,1%) (OECD, 2015) only surpassed by Greece (58.3%), Spain (55.5%) and Italy (40%), and well above the EU28 average (23.3%).1 Youth unemployment2 is associated to serious short, medium and long-term consequences, not only at an individual level but also at societal and economic ones. Nevertheless, by definition such a rate only considers the active youth, disregarding the inactive ones, this is, those who are not actively looking for a job. It thus becomes necessary to consider the NEET (Not in Employment, Education or Training),3 which includes both those actively looking for a job and the inactive ones (OECD, 2015). According to EuroStat (2015), in 2014, the NEET rate in Portugal represented 12.3% of the youth segment alone.
When analysing the problem of youth unemployment, one must delve deep into the roots of the problem. According to several studies (e.g.: Mourshed et al., 2014, Copps
1 People aged 15 to 24 years old
2Youth unemployment rate is the number of unemployed 15-24 year-olds expressed as a percentage of the youth labour force. 3 Young people aged 15 to 24, not in employment, education or training (NEET)
Problem( Definition( Understanding(the(Issue(of(Youth(Unemployment(( Costs( Causes( Target( Population( National(Priority( Risk(Factors(that(lead(Youth(to(Become(Unemployed( Shortage(of(Skills( The(Consequences(of(Youth(Unemployment( Alignment(of(Public(Policies(
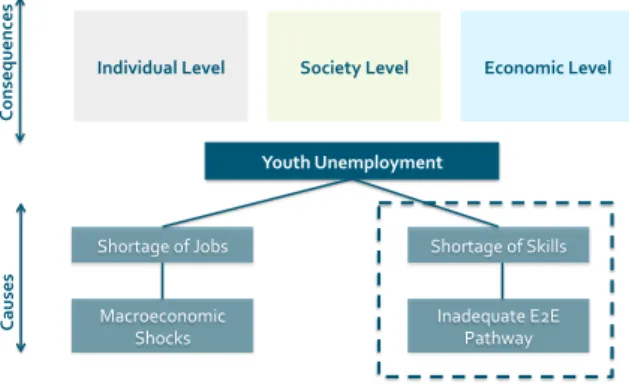
et al., 2014, Gata et al., 2014), there are two main causes for youth unemployment
that seem to present a market paradox. On the one hand, 1) there is a shortage of jobs due to the macroeconomic shocks of the recent years. On the other, 2) several job vacancies remain open because employers cannot find candidates with an adequate profile and in general adequately prepared to integrate the job market. If the first cause is intimately related to the macroeconomic situation, the second one suggests a shortage of skills – a problem essentially caused by an inadequate education-to-employment pathway. This is a problem mainly visible amongst the NEETs, those who are generally less qualified and thus more vulnerable to the current harsh employment market situation (Rowland et al., 2014).
Given that youth unemployment “was at a high level in many countries long before the financial crisis began to bite”and has traditionally been higher than rates for older age groups (Mourshed et al., 2014, p.16), the cause associated to a shortage of skills, i.e. a lack of employability,4 will be appointed as the main cause to be explored in this thesis, as it is illustrated in figure 2.
Figure 2 | Youth Unemployment Problem Tree
4 Employability refers to the state of being entirely prepared to enter the job market (Mourshed et al. 2014).
1 Youth&Unemployment& Shortage)of)Jobs) Macroeconomic) Shocks) Shortage)of)Skills) Inadequate)E2E) Pathway) Co ns eq ue nc es & Individual&Level& Society&Level& Ca us es & Economic&Level&
2.2. Risk Factors that Lead Youth to Become NEET
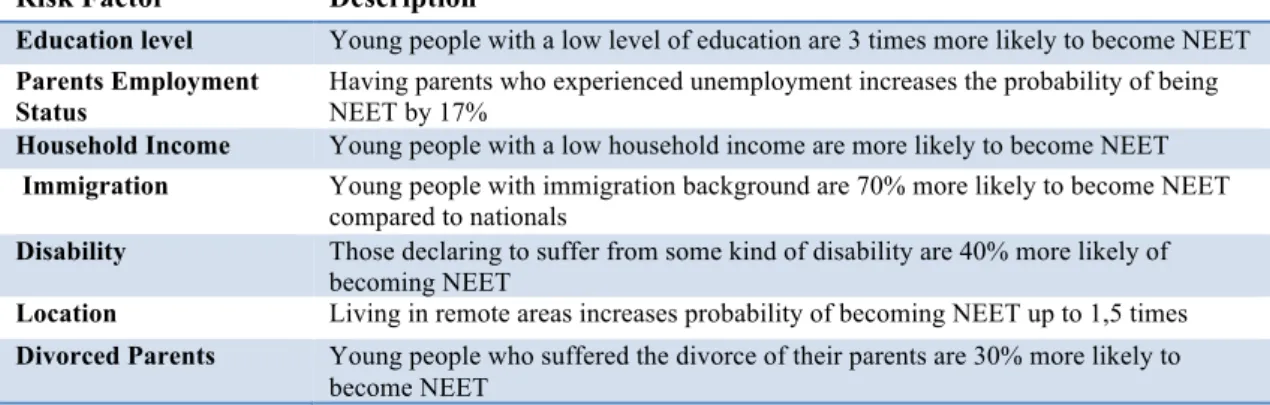
While there are several motivations for people to become NEET, from voluntarily NEETs or actively looking for a job to totally disengaged youth,5 there are characteristics that may indicate that a person is at a higher risk of suffering from this disruptive situation. Some of the characteristics, the so-called risk factors, are represented in figure 3 bellow, ranging from low levels of education to their familiar legacy towards the job market (Eurofound, 2015).
Risk Factor Description
Education level Young people with a low level of education are 3 times more likely to become NEET
Parents Employment
Status Having parents who experienced unemployment increases the probability of being NEET by 17%
Household Income Young people with a low household income are more likely to become NEET
Immigration Young people with immigration background are 70% more likely to become NEET
compared to nationals
Disability Those declaring to suffer from some kind of disability are 40% more likely of
becoming NEET
Location Living in remote areas increases probability of becoming NEET up to 1,5 times
Divorced Parents Young people who suffered the divorce of their parents are 30% more likely to
become NEET
Figure 3 | NEETs Risk Factors (adapted from Eurofound 2015)
The above risk factors are not only present in youth belonging to the poor population segments, but also to what Guerra et al., (2010) called, the “sandwich families”: 6 those households living just above the poverty line,7 who despite owning resources above the threshold for social support eligibility, do suffer from serious social and financial difficulties. These families in the Portuguese context represent 31% of the households as opposed to 20.1% poor families, which highlights the urgent need to support them overcoming their current difficulties and the potential social risks they face (Guerra et al., 2010).
5 NEETs can be conventionally unemployed, unavailable, disengaged, opportunity seekers, or voluntarily NEETs (Eurofound
2012)
6 Sandwich families correspond to households with net income between 60% and 125% of the median income gained by an equivalent adult (Guerra et al, 2010).
.
7 Poor families are considered with a net income below the poverty line (60% of the median income gained by an equivalent adult) (Guerra et al, 2010).
2.3. What is Youth Lacking After All?
In Portugal, in general, the level of skills that young people present tend to be considerably lower than the levels required and expected by employers (Gata et al.,
2014). Nowadays, due to globalisation and high competitiveness, transversal
competences (soft skills), such as team working, problem solving and communication skills, are considered as essential and as a differentiating factor amongst candidates (Hogan et al., 2013). However, these are the skills young people lack the most according to employers (Gata et al., 2014). One of the reasons is attributed to a mass-market approach undertaken by an increasingly commercial educational sector, not attentive to the market and thus not effective in adequately preparing students to the job market (Andrews and Higson, 2008). In turn, this is attributed to a lack of communication and alignment between the main stakeholders: educational institutions, employers and students (Mourshed et al., 2013) that currently have different perspectives on what the most significant skills for professional excellence are (Rosenberg et al., 2012).
In contrast, over-qualification is also responsible for contributing to this skills mismatch. According to McKinsey & Company’s study by Mourshed et al., (2014), in southern European countries, Portugal included, it is common for youth to undertake higher education in areas marked with high levels of unemployment.8 This situation forces youth to look for jobs in areas different from their specialisation, which can have damaging consequences in terms of productivity and job satisfaction (CEDEFOP, 2010).
In a nutshell, according to Mourshed et al., (2013) the main areas where action is most needed regarding this social problem are: 1) finding a job, 2) building skills and
3) enrolment in further training when necessary.
2.4. The Consequences of Youth Unemployment
Spending a long period of time inactively, especially at the initial stage of a person’s professional career, implies serious negative consequences at several levels.
• Individual level: being NEET may lead to a “wage scar”, i.e. a higher probability
for the individual to earn considerably less during his/her life, in comparison to others, and thus being more likely to depend on public benefits, and having “a greater chance of experiencing depression in early adulthood” (Copps et al., 2014).
• Societal level: according to Eurofound (2013), NEETs have a lower level of social,
civic and political participation than non-NEETs, as well as a level of institutional trust considerably lower than the rest of the young population.
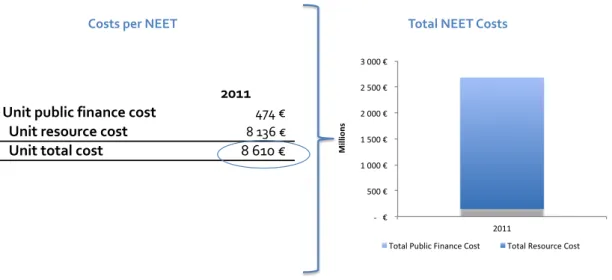
• Economic level: in 2011, the cost per NEET in Portugal was 8,610 euros per year,9
which, when considering the total costs of the national NEET population, accounted for a total of 2,680 million euros and 1.57% of the GDP (Eurofound, 2012) (figure 4).
Figure 4 | Cost of a NEET (Eurofound 2012)
9 The framework behind this cost includes 1) Public Finance Income and 2) Resource Income (Eurofound 2012). !"!!!€!! !!500!€!! !1!000!€!! !1!500!€!! !2!000!€!! !2!500!€!! !3!000!€!! 2011! Mi lli on s' Total!Public!Finance!Cost! Total!Resource!Cost! 2011 Unit(public(finance(cost #################### 474#€ Unit(resource(cost ################## 8#136#€ Unit(total(cost ################ 8#610#€ Total&NEET&Costs& Costs&per&NEET&
2.5. Alignment of Public Policies
Youth unemployment has become a strategic priority to be tackled, both at a European and national levels. The European Commission (EC), as part of its 2020 goals, aims to employ at least 75% of the population aged between 20 and 64, by then. Aligned with this is the Agenda for New Skills and Jobs, which reinforces across members states the need to promote better anticipation of youth’s future skills needs as well as the need to provide support in their development (EC, 2014).
The Youth Employment Initiative was proposed at a European level with a budget of 6,000 million euros for the period of 2014-2020 to reinforce and accelerate measures outlined in the December 2012 Youth Employment Package.10 These include the Youth Guarantee Programme, an innitiative to tackle youth unemployment, aimed at ensuring that “all young people under 25 get a good-quality, concrete offer within 4 months of leaving formal education or becoming unemployed” (EC, 2014).
3. Identifying a Strong Intervention Model
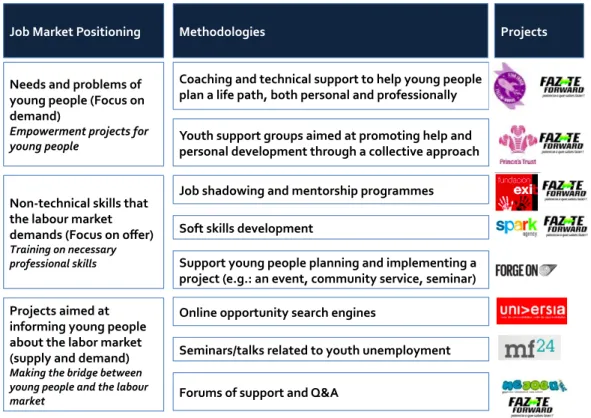
In Portugal, the public educational system tends to offer a “one size fits all” approach that, as explained above, has proven to be insufficient in preparing young people to enter and succeed in the job market (Almeida et al, 2012). Nevertheless, there are programs in place that aim to close this market gap. Rico (2013) in partnership with TESE developed a benchmarking study that identified the main national programmes, illustrated in the table below.
Figure 5 | Adapted from Benchmarking (Rico and TESE 2013)
Faz-te Forward, a Portuguese intervention model developed by TESE – Associação para o Desenvolvimento, stands out as having the broadest and most complete approach in complementing the national educational scenery. It offers a tailored and intensive capacity building programme aimed at fostering employability, especially in what regards building soft skills and finding a job. It not only maximises chances of youth entering the job market, but focus highly in making such a shift the most sustainable possible.
3.1. TESE – Associação para o Desenvolvimento
TESE – Associação para o Desenvolvimento (herein referred to as TESE) is an organisation with a strong reputation in the Portuguese social sector, having been actively working to solve the problem of youth employment since 2008, with both valuable research and impactful and diverse programmes.11
11 In addition to FFWD, TESE runs employability programmes such as Link2Jobs, Orienta.Te E5G.
Needs%and%problems%of% young%people%(Focus%on% demand)% Empowerment*projects*for* young*people* Non6technical%skills%that% the%labour%market% demands%(Focus%on%offer)% Training*on*necessary* professional*skills* Projects%aimed%at% informing%young%people% about%the%labor%market% (supply%and%demand)%% Making*the*bridge*between* young*people*and*the*labour* market* Job%Market%Positioning* Methodologies* Coaching%and%technical%support%to%help%young%people% plan%a%life%path,%both%personal%and%professionally* Youth%support%groups%aimed%at%promoting%help%and% personal%development%through%a%collective%approach% Job%shadowing%and%mentorship%programmes%% Soft%skills%development% Support%young%people%planning%and%implementing%a% project%(e.g.:%an%event,%community%service,%seminar)% Online%opportunity%search%engines% Seminars/talks%related%to%youth%unemployment% Forums%of%support%and%Q&A%% Projects*
3.2. Faz-‐Te Forward
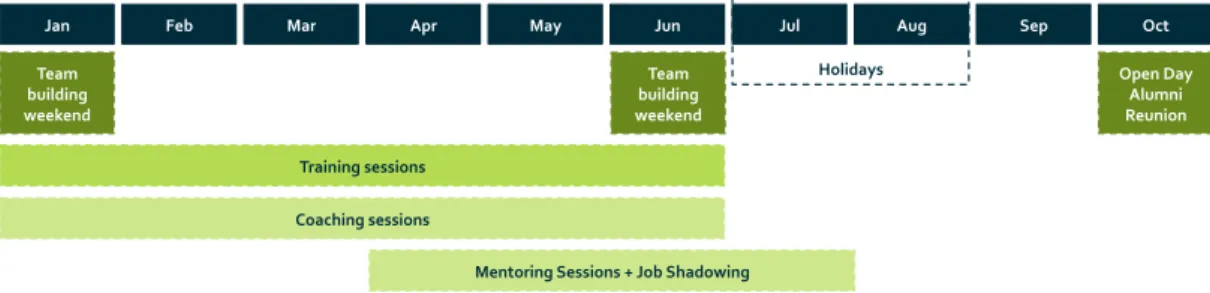
FFWD’s design was carefully based on TESE’s work experience with unemployed youth and on a 6-month research and benchmark held during 2009/10 as mentioned above. More recently the programme was adjusted taking into account the results of an intensive study of the youth unemployment situation in the country, “Faz-te ao Mercado” promoted by TESE (2014), which deeply analysed the main causes of the underlining problem and identified the main strategic areas that require improvement. FFWD, during its 6 months per edition, achieves its theory of change mainly by acting on three main fronts: self-knowledge, soft skills, and networking. Specifically, the programme is based on the provision of two team building weekends, weekly four-hours training sessions on the most valued soft skills by the employers (6 months), individual coaching sessions (10 to 12 sessions throughout 6 months) and individual mentoring sessions (up to 4 sessions) as it is illustrated in the following diagram. In order to preserve its high-customised approach and dynamic non-formal training sessions, the number of participants is restrained to around 30 per edition. To date, since its start in 2011, TESE has only held three editions of FFWD, considering that the 4th is currently taking place since January 2015.
Figure 6 | FFWD's Timeline (TESE 2015)
3.3. Target Population
FFWD’s target population includes young people aged 18 to 25, both students (undergraduate or postgraduate) and NEET. In addition, in order to maximise its
Jan$ Feb$ Mar$ Apr$ May$ Jun$ Jul$ Aug$ Sep$ Oct$
Holidays$ Team$ building$ weekend$ Training$sessions$ 30$young$ people$ Coaching$sessions$ Team$ building$ weekend$ Mentoring$Sessions$+$Job$Shadowing$ Open$Day$ Alumni$ Reunion$
social impact, FFWD’s selection criteria prioritise those who face increased barriers in entering the labour market and whose chances of becoming NEET are highest, by belonging to the aforementioned “sandwich families” and having at least one of the above-described risk factors (figure 3).
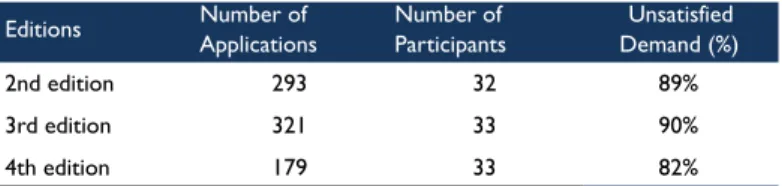
To ensure the fit between the programme’s offer and the participants' expectations as well as to reduce the risk of dropouts and increase attendance, the selection process is extensive. It is composed of five phases that screen, in addition to the main selection criteria, characteristics such as the level of self-awareness, motivation and team working skills. This also allows them to maximise the utility from the high number of applications per edition (on average 87%12 of the applicants are not selected) (figure 7).
Figure 7 | FFWD'S Unsatisfied Demand (TESE 2015)
3.4. Innovation and Differentiating Factors
According to TESE, FFWD’s main differentiating factors amongst other initiatives are:
• Adopting a very close relationship with participants throughout the programme in order to adequately co-create and tailor the programme to their needs and interests; • Actively involving a varied range of experienced professionals and partners in
structuring and developing the programme (especially in the training and mentorship activities) in order to effectively decrease the current market mismatch
12 Figure excludes the first edition
Editions Number of Applications Number of Participants Demand (%)Unsatisfied
2nd edition 293 32 89%
3rd edition 321 33 90%
4th edition 179 33 82%
between supply and demand;
• The provision of individual coaching sessions delivered by certified coaches;
• The specificity of the selection criteria focuses the programme to a particular layer of the population, identified as neglected.
4. Data Analysis | FFWD Impact
An extensive analysis to the available historical data of FFWD’s previous editions13 was undertaken in order to provide an overview of the type of people participating and how certain characteristics such as number of risk factors and situation towards the job market, can impact their personal progress. In general, this analysis tried to quantify FFWD’s impact and inform certain necessary operational changes that can maximise its potential.14
4.1. Participants’ Characteristics
The data used for this analysis represented 65 participants that joined FFWD’s 2nd and 3rd editions. This population encompasses a heterogeneous group in what concerns gender and risk factors. Around half of the participants are still studying an undergraduate or graduate degree, while the other half is NEET; in addition, the majority was aged 21 to 25 (appendix 2).
4.2. Overall Performance Analysis
Entrance in the job market | On average, 43% of FFWD’s participants entered the
job market until the end of the intervention (1st batch), while 17% of participants entered the job market until 6 months after the intervention was concluded (2nd batch), as shown in figure 8.
13 Given that the first edition followed a pilot purpose and thus served for further restructuring of the programme, it cannot be
comparable to the other editions. For this reason, the first edition was excluded from the analysis. 14 Only data from 2nd and 3rd edition was considered.
Figure 8 | FFWD’s Performance based on Entrance in Job Market
Maintenance of employment | Participants from the 1st batch that maintained their
job for at least 12 months correspond on average to 18% of total participants, while participants from the 2nd batch that maintained their job for at least 6 months correspond on average to 9% of total participants.
Figure 9 | FFWD’s Performance based on Maintenance of Employment
Integration in area of interest | From the entire universe of participants that started the programme, 43% were employed in their areas of interest, which accounts for 52% of those who entered the job market.
Figure 10 | FFWD's Performance based on Integration in Area of Interest
4.3. Performance Analysis per Characteristic
Impact of risk factors in entrance in the job market | One can observe that the number of risk factors per participant was relatively well distributed throughout the two analysed editions. Indeed, when looking at the impact that the number of factors had in performance, there does not seem to be a significant difference.
43%$ 17%$ 13%$ 27%$ <=$until$end$of$edition$ <=$6$months$after$end$of$edition$ >$6$months$after$end$of$edition$ N.A.$ 18%$ 9%$ 12%$ 60%$ First$Batch$>$12$months$ Second$Batch$>$6$months$ Left$Job$ N.A.$ 43%$ 11%$ 46%$ Yes$ No$ N.A.$
Figure 11 | Impact of Nr of Risk Factors in Entrance in the Job Market
Impact of initial job market situation in entrance in the job market | From looking specifically at the NEET participants who account for 42% of the population,15 it was possible to observe that 75% entered the job market until the end of the programme. Regarding those studying during the start of the edition, only 34% entered the job market within the end of the intervention. This suggests that focusing on NEETs may lead to a higher performance rate for FFWD in the future, given their availability, which may also indicate a higher efficiency of the programme.
Figure 12 | Impact of Initial Job Market Situation in Entrance in the Job Market
4.4. Comparison to Control Group
Unfortunately, TESE has not been comparing FFWD’s performance of participants with a control group, which could provide a more realistic indication of their impact.
15 Considering merely 2nd and 3rd editions 0" 2" 4" 6" 8" 10" 12" 14" 0" 1" 2" 3" 4" 5" Num ber' of 'Part icipant s' Number'of'Risk'Factors'per'Participant' Quit" Working" Student" Looking"for"1st"job" 0%# 10%# 20%# 30%# 40%# 50%# 60%# 70%# 80%#
Quit# Working# Student# Looking#for#
1st#job#
NEET# Student#
Furthermore, no access to information on other control groups measured by comparable programmes was possible to attain, which limits the total interpretation of the present analysis.
5. Is a SIB is a Suitable Tool for Funding Faz-‐Te Forward?
Despite the performance analysis limitations, it is possible to conclude that this innovative intervention does deliver impact, especially amongst the target population NEETs. Nevertheless, until today, Faz-Te Forward’s structure only allows to reach around 30 participants per year, which is a quite modest number in comparison to the large dimensions of this problem and its demand in previous editions. Scaling seems therefore the most strategic approach to follow. However it requires a significant investment not easily available through the current financing model: corporate donations. Furthermore, as already mentioned, FFWD’s impact has not been measured in the most sophisticated and scientific way, leaving room for improvements in the future that may inform about its most realistic impact.
5.1. SIB: An Alternative Financing Model
Due to the above-mentioned reasons, the concept of a Social Impact Bond (SIB) could present a strong alternative financing method to FFWD.
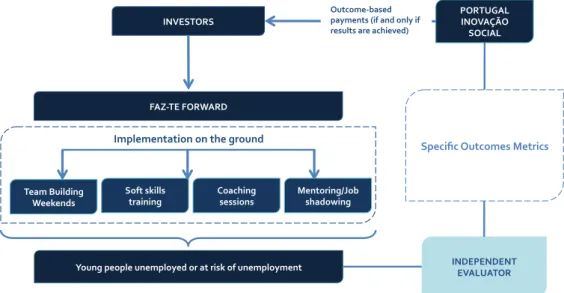
Through a SIB, private investors would finance FFWD’s scaling, delivered by TESE (the service provider). If initially agreed outcomes are reached, which ideally should result in saving costs to the government, the latter will share savings with investors, i.e. pay back their principal and possibility a financial return as well (Rose et al., 2012). Important is to say that a robust impact measurement must be applied. Under a
SIB, an independent evaluator, usually an academic institution, is responsible for evaluating whether outcomes have been achieved or not.
Figure 13 | FFWD's SIB Structure
To the government, this method brings great benefits by providing a risk-free solution with high potential to decrease the number of people suffering from a NEET situation and thus decreasing the current costs associated with such a problem. To TESE, the benefits encompass an opportunity for scaling their programme and a capacity building programme to improve their impact measurement methodologies, which may become a basis for a continuous improvement of FFWD. Finally, private investors, despite bearing the risk, have the possibility of recovering the amount invested, shifting from donors to investors (Goodhall, 2014).
Although SIB is still a relatively recent concept, it has been given a great level of attention by many governments globally. Today, there are over 100 SIBs being developed and implemented in more than 12 countries, in very distinct social areas (Instiglio, 2015). Specifically in the area of youth unemployment, SIBs have proved to be a considerably appropriate financing model. There are several effective programmes aimed at tackling employability that have been scaled by the use of a SIB around the world, each with different targets, components and sizes as it is possible to see in the benchmarking table below (please see appendix 3).
INVESTORS) FAZ-TE)FORWARD) Young)people)unemployed)or)at)risk)of)unemployment) Team)Building) Weekends) Soft)skills) training) INDEPENDENT) EVALUATOR) PORTUGAL) INOVAÇÃO) SOCIAL) Specific)Outcomes)Metrics) Mentoring/Job) shadowing) Outcome-based) payments)(if)and)only)if) results)are)achieved)) Implementation)on)the)ground! Coaching) sessions)
Figure 14 | Benchmarking: International Youth Unemployment SIBs (Tomkinson, 2014)
*PPP: Public Private Partnership
6. How can a SIB be Applied to Faz-‐Te Forward?
6.1. Service provider prepared for scaling
After extensive discussions with TESE, it became clear that the organisation is committed and prepared to extend their impact to further geographies. In order to facilitate the scalability of FFWD, adaptations to the programme’s structure and budget were initially undertaken during IES – Social Business School‘s Scaling4Impact,16 a competition to support the scaling social organisations, from which they were awarded the first place.
6.2. Quantifiable Outcomes and an Effective Measurement Framework
TESE is able to effectively maintain contact with participants in order to track record of outcomes and has the appropriate measures in place, although as mentioned there is room for improvement. Currently, TESE measures impact by tracking the participants’ employment situation through telephone questionnaires during three phases: after the end of the programme, 6 months after the end of the programme and finally 12 months after the end of the programme.
16 http://www.ies-sbs.org/empreendedores-sociais/scaling-4-impact/
Programme Country Structure € Term
Remove3 Barriers3 (structural) Hard3Skills3 (academic/3 technical) Soft3 Skills3 (social) Links3to3 Employers3 (social3 capital)
Thinkforward UK SIB 4%200%000%€ 3%years ✔ ✔ ✔ ✔
Teens3&3Toddlers UK SIB 4%620%000%€ 3%years ✔ ✔ ✔
Energise UK SIB 5%180%000%€ 3%years ✔ ✔ ✔ ✔
Duo3For3a3Job Belgium SIB 3%years ✔ ✔
Buzinezzclub Netherlands SIB 680%000%€ 3%years ✔ ✔ ✔
ROCA,3Inc USA SIB 16%560%000%€ 7%years ✔ ✔ ✔ ✔
Year3Up USA Non7Profit ✔ ✔ ✔ ✔
6.3. Quantifiable Economic Benefit
By increasing participants employability and supporting them in finding a sustainable and adequate job, FFWD is preventing or decreasing the number of NEETs in Portugal, thus directly resulting in current or future costs savings to the government considering the above-mentioned costs per NEET.
6.4. Alignment with Public Policies
At a national level, an ecosystem around the concept of social investment has started being created, greatly supported by the recently announced 150 million euros fund from Portugal Inovação Social. From the total amount, 15 million euros will be allocated to finance, through SIBs innovative, preventive and cost effective programmes in the area of youth employment, such as FFWD (Diário da República, 2014). In the following section, it will be shown how in practice, FFWD could benefit from a SIB, i.e. FFWD’s SIB Business Case.
7. Modelling Faz-‐Te Forward SIB
From the data analysis undertaken described above, the following strategic and operational decisions could be developed.
7.1. Intervention Scope
Target Population | From the performance analysis, recommendations to improve
the target population of FFWD were formulated.
• Job market risk factors: the current selection criteria regarding the risk factors of participants were analysed and proved to be well applied,17 resulting in a heterogeneous group of people, where risk factors do not actually have a strong influence on outcomes (figure 11). It is thus recommended to maintain such
criteria.
• Initial situation towards the job market: participants already looking for a job have higher success rates than those studying (figure 12). Based on such conclusions it is recommended to restrain future FFWD participants to those either already looking for a first job or almost finishing their studies, in order to maximise outcomes.
Cohort Delivery Model | It is recommended to maintain the number of participants
per edition in order to preserve its close relationship with each one of them and high customised approach. However, following the structural changes recommended before, FFWD will be able to run two editions per year, now reaching a total of 60 participants per year as opposed to the previous 30. Considering a SIB with a duration of 3 years,18 it would finance 5 editions, and consequently a minimum of 150 participants.
Structure Adaptations | Without compromising the quality of the programme,
FFWD’s adaptations for the SIB require compressing its duration from 6 to 5 months in total, leveraging on a more efficient usage of resources. This will allow the team to undertake two editions per year instead of one merely located in Lisbon – alternating between Lisbon and Porto (figure 15).
18 More precisely 2.5 years.
Figure 15 | FFWD's adapted timeline for SIB (TESE, 2015)
7.2. Intervention Costs
The intervention costs are intimately dependent on the intervention scope. The costs estimated for the SIB are based on previous and current budgets and adapted to the proposed scope changes. According to TESE, currently the intervention costs around €100,000 per edition. However, with the proposed adaptations for the SIB, each edition will cost approximately 84,303 euros resulting in a total cost of 421,515 euros for the 5 editions during the 3 years (figure 16).
Figure 16 | FFWD's Costs (TESE, 2015)
May$
Applications$
Jun$ Jul$
2016%
$Selection$
Aug$ Sep$ Oct$ Nov$ Dec$ Jan$ Feb$ Mar$ Apr$ May$ Jun$ Jul$
$Soft$skills$training$sessions$ G1# G1# Coaching$sessions$ Mentoring$+$$ job$shadowing$ G1# G1# G1# Star*ng%teambuilding%
weekend% Closing%teambuilding%weekend%
Applications$ G2# $Final$ evaluation$ G1# $Selection$ $Soft$skills$training$sessions$ Star*ng%teambuilding% weekend% Closing%teambuilding% weekend% Coaching$sessions$ Mentoring$+$$ job$shadowing$ G2# G2# G2#
Aug$ Sep$ Oct$
Applications$ $Selection$ G3# G3# Star*ng%teambuilding%weekend% $Soft$skills$ training$…$ G3# $Coaching$ sessions$(…)$ G3# $Final$ evaluation$ G2# Group%1%=%30%young%adults% G1# Label%
G2# Group%2%=%30%young%adults% G3# Group%3%=%30%young%adults% Gn# 30%young%adults%per%group% 2017%
Cost%Category Total%Cost%per%Edition Total%Cost%for%SIB%Proposal%(5%editions)
Direct'Costs'with'Participants 3'670'€ 18'350'€ Training 7'550'€ 37'748'€ Opening'and'Closing'Weekends 5'030'€ 25'150'€ Coaching 11'225'€ 56'125'€ HR 40'528'€ 202'640'€ Communication 2'250'€ 11'250'€ TOTAL'DIRECT'COSTS 70'253'€ 351'263'€ Indirect'Costs'(overheads)'20% 14'051'€ 70'253'€ TOTAL%COSTS 84%303%€ 421%515%€
7.3. Outcomes Metrics
As argued by Social Finance (2015), the selection of outcomes metrics to measure success is an essential step during the development of a SIB. It is crucial to ensure the chosen metrics are not only reflecting the success and impact of the project but are also easily available or accessible. In FFWD’s case, in line with the best practices in the area of employability, the most appropriate outcome metrics to consider are: 1) Entrance in the job market, which only considers paid professional experiences, such as a contractual job, an internship or a PhD;
2) Whether the job is in the participants’ area of interest/training;
3) Maintenance of job for a certain period of time (6 and 12 months), which considers maintenance of a participants’ ‘employed’ status, thus not differentiating between those who maintain their jobs within one company or those who accept new professional opportunities.
These metrics are not only relevant but they are also already being measured by TESE, which obviously improves their practical effectiveness. It is fundamental, however, to compare performance with a control group in order to create a basis for more appropriately measuring FFWD’s impact.
During the performance analysis, a performance lag between two groups of participants (the two different batches) was identified, which suggests that, while some participants succeed quite promptly to the intervention (enter the job market), others may take longer, nevertheless still succeeding. For this reason, for modelling and estimation purposes, two different batches based on the time to “entrance to the job market” are recommended to be considered. Those who enter the job market until
one month after the end of the respective edition19 are considered the first batch represented with a success rate estimate of 55%, while those that take at least 6 additional months are called the second batch, with a success rate of 15%, both estimates informed from the performance analysis undertaken. Even though, by starting to accept more NEETs than students may increase performance, the condensing of the programme may also have some negative implications in the programme’s current performance rate, which is why the estimated success rates are comparable to FFWD’s current rates, as shown in figure 17.
7.4. Payment Mechanism
Under a SIB, once outcomes are achieved, cash flows in from the government as investors’ repayment. However, it is important to consider that the service provider will be paid yearly, i.e. receive the necessary upfront cash to run the two yearly editions.
For each outcome metric, a payment was considered, taken into account that the total paid per participant must be below the cost of a NEET to the government – 8,610 euros (Eurofound, 2013) – a maximum of 8,000 euros per participant. This ensures an appealing cost savings to the public sector of a maximum of 610 euros per participant per year (figure 17). The different payments are illustrated below.
Figure 17 | FFWD's Outcome Metrics and Payments
19 6 months after the start of the respective FFWD edition
Payment Success,Rate,(1st,batch) Success,Rate,(2nd,batch)
Entrance,in,the,Job,Market 1,800,€ 55% 15%
Integration,in,Area,of,Interest 200,€ 43% 52%
Maintenance,of,Employment,>,6,months 2,500,€ 30% 10%
Maintenance,of,Employment,>,12,months 3,500,€ 20% 2%
7.5. Public Sector Value
The value of the current SIB proposal to the public sector comprises the actual savings it can achieve with this risk-free model, by considering the current costs the government bears associated to NEETs and the payments for the outcome metrics achieved. This SIB has the potential to represent a total of 827,970 euros in savings to the public sector, as illustrated in graph below.
Figure 18 | SIB Savings (Social Finance, 2013)
7.6. Investment Structure
• Timing of investor capital commitment | It is recommended that cash flows in
from investors at the beginning of every year;
• Working capital contingency | The model includes a working capital contingency
totalling 63,227 euros, i.e. three months of the intervention. This amount, given its contingency purpose, shall not be used unless a eventuality, and is to be returned to investors at the end of the intervention.
• Repayment | The model considers a three-month delay between outcomes are measured until payment is processed to investors, in order to account for the necessary time of the process.
€ Government) Savings 827)970)€ Investor)Surplus 42)015)€ Status'Quo SIB Costs)of) Government 1)291)500)€ Costs)of) Intervention 421)515)€
8. SIB Business Case and Sensitivity Analysis
8.1. Business Case
The proposed SIB structure, taking into account all the factors and considerations above detailed, results in the following financial outline, which represents a surplus of 42,015 euros to investors and an IRR of 4,3%.
Figure 19 | FFWD's SIB Business Case
8.2. Scenarios
The proposed business case is calculated based on estimations, which may or may not materialise, thus having the potential to profoundly impact the business. Therefore, in order to understand the sensitivity of the present model and prepare against any unforeseen events, six different scenarios were tested: the most optimistic and the most pessimistic scenarios, from changing one of the following key factors, ceteris
paribus. Figure 20 presents the impact of such scenarios in the model’s financials. Success rate % | Success rates are an essential factor to ensure the investors’ payments. Since the entrance in the job market is a necessary condition for the remaining metrics to materialise, this will be the only metric tested in this analysis.
484#742#€# 540#902#€# #0#€# 100#000#€# 200#000#€# 300#000#€# 400#000#€# 500#000#€# 600#000#€#
Year#1# Year#2# Year#3# Year#4# Year#5#
Delivery#costs# Revenues#(outcome#payments)# Cumulative#delivery#costs# Cumulative#revenues#(outcome#payments)#
The considered base case scenario (70% success rate) refers to the sum of the estimate percentage of successful participants in the first (55%) and second (15%) batches.
Outcome Payments | The total amount an investor can receive per participant will influence the project surplus and the investors’ return. In this analysis the impact of the total outcome payments equalling below or above the 8,000 euros mark, chosen in order to maximise the savings of the government, was tested. In practice there is a trade-off between pleasing investors or the government. While if total payments equal 8,500 euros, investors would benefit greatly, the government would only benefit from a maximum of 160 euros per participant, which is not a greatly appealing amount when compared to 610 euros from the base case scenario.
Cohort | The number of participants per edition has implications on the financials of
this model, due to the inherent fixed costs. Two scenarios were considered, one where the number of participants was 25 and another where it was 40, even though in practical terms the most optimistic scenario may have negative externalities for the participants, given the extensive number of participants per group.
Figure 20 | FFWD's SIB Scenario Analysis
Success Rate Worst Case Scenario Base Case Scenario Best Case Scenario
Entrance in the Job Market 43% 70% 90%
Maximum Contract Value 387 147 € 463 530 € 520 110 €
Project costs 484 742 € 484 742 € 484 742 €
Surplus -34 368 € 42 015 € 98 595 €
IRR -3,4% 4,3% 10,5%
Outcome Payments Worst Case Scenario Base Case Scenario Best Case Scenario Total Possible Payment 7 500 € 8 000 € 8 500 €
Maximum Contract Value 434 559 € 463 530 € 492 501 €
Project costs 484 742 € 484 742 € 484 742 €
Surplus 13 044 € 42 015 € 70 986 €
IRR 1,3% 4,3% 7,3%
Cohort Worst Case Scenario Base Case Scenario Best Case Scenario
Number of Participants per group 25 30 40
Maximum Contract Value 386 275 € 463 530 € 618 040 €
Project costs 464 827 € 484 742 € 524 573 €
Surplus -17 923 € 42 015 € 161 890 €
9. Limitations
One must acknowledge the data limitations of this analysis. Firstly, only data from two editions (2nd and 3rd) was analysed, involving merely a total of 65 participants, given that the 1st edition followed a very distinctive and thus incomparable structure. In addition, it must be stated that most of the performance data is self-reported by the participants, which increases the level of uncertainty in what concerns the impact measurement, given that it is harder to guarantee the necessary regular contact with participants once the edition ends.
Finally, the limitations related to the evaluation should also be considered. Although a performance analysis was undertaken, it was not compared to a control group, which would have enhanced the level of information regarding the impact of FFWD.
10. Next Steps to be Undertaken
Following the present feasibility study, the next steps to be undertaken must be defined, in order to guarantee the fruition of this project.
10.1. Application to Portugal Inovação Social
Under this SIB, Portugal Inovação Social will act as the public sector, being responsible for the payments of the outcome metrics achieved. This implies a process of applications and their consequent improvement. Nevertheless, the process is still being developed and not enough information has been released yet, both regarding content and timings. It is important that TESE and the Social Investment Lab are alert in order to meet all the necessary requirements once they become available.
10.2. Legal Due Diligence
A legal due diligence will need to be undertaken in order to understand what legal framework and contractual architecture are required for the present proposed SIB model.
10.3. Develop FFWD’s Expansion Strategy
The current financing model underlines an expansion that implies strategic and operational adaptations, which must be extensively planned once approval by Portugal Inovação Social is guaranteed.
11. Concluding Remarks
The current feasibility study aimed at tackling youth unemployment, one of the most pressing social issues in Portugal, shows a great potential for impact and thus a high potential of value for money to the public sector. Likewise, it represents an invaluable opportunity to learn from an appropriately monitored experience, deepening the current knowledge existent about the impact of a specific intervention and the social issue as a whole. Although this study is a key stage of the process, great effort shall be applied in the coming future in order to make this SIB a reality.
Overall, the implementation of this proposal will represent the first SIB in the area of employability in Portugal, which may not only have a positive impact in enhancing Portugal’s privileged position within the area of social innovation globally, but may also promote a higher involvement from a larger number of stakeholders in tackling social issues, thus opening doors to new structures and contexts.
12. Bibliography
• Almeida, Leandro et al. 2012. “Democratização do acesso e do sucesso no ensino superior:uma reflexão a partir das realidades de Portugal e do Brasil”. Campinas; Sorocaba, SP, v. 17, n. 3, p. 899-920
• Andrews, Jane and Higson, Helen. 2008. “Graduate employability, “soft skills” versus “hard” business knowledge: A european study”. Higher Education in Europe, 33 , 411-422.
• Brooks, Richard. 2014. “Out of Sight”. Fabian Ideas 639.
• Callanan, Laura, Law, Jonathan and Mendonca, Lenny. 2012. “From Potential to Action: Bringing Social Impact Bonds to the US”. McKinsey & Company
• Cedefop – European Centre for the Development of Vocational Training. 2010.” The skill matching challenge: analysing skill mismatch and policy implications”. Luxembourg: Publications Office of the European Union.
• Copps, John and Plimmer, Dawn. 2014. “The Journey to EmploymenT (JET) framework”. Inspiring Impact.
• Diário da República. 2014. “Presidência do Conselho de Ministros - Resolução do Conselho de Ministros n.º 73-A/2014”. Diário da República, 1.ª série — N.º 242 — 16 de Dezembro de 2014
• EC. 2014. “Youth Guarantee”. European Commission.
<http://ec.europa.eu/social/main.jsp?catId=1079>
• EC. 2014. “Agenda for new skills and jobs”. European Commission.
<http://ec.europa.eu/social/main.jsp?catId=958>
• Eurofound. 2012. NEETs Young people not in employment, education or training- Characteristics, costs and policy responses in Europe - Luxembourg: Publications Office of the European Union
• Eurofound. 2015. “Young people and 'NEETs'”. <https://www.eurofound.europa.eu/emcc/labourmarket/youth>
• Falcão, Catrina. and Costa, Andreia. 2014. “A União Europeia tem solução para a geração perdida?” Observador. <http://observador.pt/2014/05/21/a-uniao-europeia-tem-solucao-para-a-geracao-perdida/>
• Gata, Helena, Oliveira, Ana and Silva, Rita. 2014. “Faz-te ao Mercado: estudo sobre o (des)encontro entre a procura e a oferta de competências no mercado de trabalho e a sua relação com a empregabilidade jovem”. TESE – Associação para o Desenvolvimento
• Goodhall, Emilie. 2014. “Choosing Social Impact Bonds - A Practitioner's Guide”. Bridge Ventures
• Guerra, Isabel et al. 2010. “À Tona de Água: Retratos de um Portugal em Mudança”. Lisboa: Tinta da China.
• Hogan, Robert, Chamorro-Premuzic, Tomas, and Kaiser, Roberts. 2013. “Employability and career success: Bridging the gap between theory and reality”. Industrial and Organizational Psychology, 6 , 3-16
• Instiglio. 2015. “Social Impact Bonds and Development Impact Bonds Worldwide”.
o < http://www.instiglio.org/en/sibs-worldwide/>
• Jornal i. 2013. “Portugal tem a taxa de desemprego de arquitetos mais elevada da Europa”. <http://www.ionline.pt/368507>
• Lusa. 2015. “OIT diz que o desemprego em Portugal situar-se-á nos 10,1% em 2019”. Expresso <
http://expresso.sapo.pt/oit-diz-que-o-desemprego-em-portugal-situar-se-a-nos-101-em-2019=f907264>
Bond Feasibility Study”. Social Finance and MaRS.
• Mourshed, Mona, Farrell, Diana and Barton, Dominic. 2013. “Education to Employment: Designing a System that Works”. McKinsey Center for Government. • Mourshed, Mona, Patel, Jigar and Suder, Katrin. 2014. “Education to employment:
Getting Europe’s Youth into Work”. McKinsey Center for Government. • OECD. 2015. Unemployment rate (indicator). (Accessed on 04 May 2015) • OECD. 2015. Youth unemployment rate (indicator). (Accessed on 04 May 2015) • OECD. 2015. Youth not in employment, education or training (NEET) (indicator).
(Accessed on 23 April 2015)
• Rico, Cristina. 2013. Empregabilidade Jovem e Integração dos Jovens na Vida Activa: análise de respostas sociais e identificação de oportunidades de actuação. TESE – Associação para o Desenvolvimento.
• Rosenberg, Stuart, Heimler, Ronald and Morote, Elsa-Sofia. 2012. “Basic employability skills: a triangular design approach”. Education & Training, 54 , 7-20.
• Social Finance and The Young Foundation. 2012. “A social impact bond for entrenched rough sleepers: outline business case.” Social Finance and The Young Foundation.
• Social Impact Investment Task Force (2014). Impact Investment: The Invisible Heart of Markets. Harnessing the Power of Entrepreneurship, innovation and capital for public good. <www.socialimpactinvestment.org>
• Symons, Tom. 2015. “Technical guide: Designing Outcome Metrics”. Social Finance.
• Tomkinson, Emma. 2014. “A Stream of Social Consciousness” <http://emmatomkinson.com>
• Torres, Sonia. 2014. “Estatísticas do Emprego – 3º trimestre de 2013. Os jovens no mercado de trabalho – indicadores de medida em confront”. INE. p. 35 – 50 <https://www.ine.pt/xportal/xmain?xpid=INE&xpgid=ineestudos&ESTUDOSestb oui=226307141&ESTUDOSmodo=2>
13. Appendix
Appendix 1: Research process chronogram
Appendix 2: Participants’ Characteristics
Gender 2nd 3rd 4th Total 2nd 3rd 4th Total
F 18 21 23 62 56% 64% 70% 63%
M 14 12 10 36 44% 36% 30% 37%
Total 32 33 33 98 100% 100% 100% 100%
Age 2nd 3rd 4th Total 2nd 3rd 4th Total
<=21 6 3 5 14 19% 9% 15% 14% 21<X<=23 13 14 9 36 41% 42% 27% 37% 23<X<=25 12 10 14 36 38% 30% 42% 37% 25<X<=27 1 6 5 12 3% 18% 15% 12% >27 0 0 0 0 0% 0% 0% 0% Total 32 33 33 98 3% 18% 15% 100%
Level of Education Finished at the beginning of the edition 2nd 3rd 4th Total 2nd 3rd 4th Total
Still Studying 22 13 13 48 69% 39% 39% 49%
Basic Education (9th grade) 0 0 0 0 0% 0% 0% 0%
Secondary Education (12th grade) 1 6 3 10 3% 18% 9% 10%
Undergraduate 7 9 10 26 22% 27% 30% 27%
Postgraduate 2 5 7 14 6% 15% 21% 14%
Total 32 33 33 98 100% 100% 100% 100%
Level of Education Frequenting at the beginning of the edition 2nd 3rd 4th Total 2nd 3rd 4th Total
Finished Studies 10 20 20 50 31% 61% 61% 51%
Basic Education (9th grade) 0 0 0 0 0% 0% 0% 0%
Secondary Education (12th grade) 3 1 0 4 9% 3% 0% 4%
Undergraduate 13 7 7 27 41% 21% 21% 28%
Postgraduate 6 5 6 17 19% 15% 18% 17%
Total 32 33 33 98 100% 100% 100% 100%
Initial Situation towards the Job Market 2nd 3rd 4th Total 2nd 3rd 4th Total
Student 22 13 13 48 69% 39% 39% 49%
Employed 2 0 0 2 6% 0% 0% 2%
NEET 8 20 20 48 25% 61% 61% 49%
Looking for 1st job 5 13 12 30 16% 39% 36% 31%
Unemployed 3 7 8 18 9% 21% 24% 18%
Total 32 33 33 98 100% 100% 100% 100%
Number of Risk Factors per Participant 2nd 3rd 4th Total 2nd 3rd 4th Total
0 3 4 7 14 9% 12% 22% 14% 1 13 7 11 31 41% 21% 34% 32% 2 9 11 6 26 28% 33% 19% 27% 3 3 6 6 15 9% 18% 19% 15% 4 4 2 2 8 13% 6% 6% 8% 5 0 3 0 3 0% 9% 0% 3% Total 32 33 32 97 100% 100% 100% 100% Number of Participants % Month Jun,)3rd Weeks 1 2 3 4 1 2 3 4 1 2 3 4 1 2 3 4 1
Task SCENARIOS)&)RECOMMEND
ATIONS DATA)
COLLECTION
FINAL) REMARKS
Feb Mar Apr May
INTERVENTIO N)MODEL)D)FazD Te)Forward)+) SUCCESS) STORIES? SIB)BIZ)CASE)D)METRICS;)INVESTMENT) STRUCTURE;)PAYMENT)MECHANISM; SOCIAL) IMPACT) BONDS)D) WHAT;)WHY;) HOW PROBLEM) OVERVIEW)D) WHAT;)WHO;) HOW)MUCH
Appendix 3: International Benchmarking | Youth Employability Programmes 3.1. Thinkforward (UK)
Target Population: 14 years old at risk of becoming NEET
Theory of Change: provision of targeted and intensive support over a 4 to 5 years period to ensure participants experience positive school to work transitions.
Services/Activities Offered:
• In-school ‘super’ coaches provide 1 to 1 activities tailored to support young people as part of an action plan
• Third party interventions to support personal development and engagement with support services e.g. local housing authorities, citizen advice bureau, etc. • Brokering access to the world of work including progression planning, full
employment preparation, career preparation and progression support
3.2. Teens & Toddlers (UK)
Target Population:14-15 years old young people at risk of becoming NEET Theory of Change:
• Develop participants’ self esteem, interpersonal skills and sense of responsibility to help them make positive decisions about their education, health and future.
Services/Activities Offered:
• 18-week intensive intervention along with regular support combing hands-on community experience, classroom time
• Involves teenagers acting as role models to vulnerable toddlers in a safe and supervised nursery environment, who share practical experience of work • Classroom sessions in anger management, communication skills, and SRE
• An accredited NCFE Level 1 Award in Interpersonal Skills • Support with individual work plans right through until GCSEs.
3.3. Energise (UK)
Target Population:
• 14-15 years old at risk of becoming NEET
• Family issues, young offenders, young people in care, care leavers, substance misusers, those with mental health issues and young carers
Theory of Change:
• Building resilience, confidence and aspiration enables vulnerable young people to progress in their lives as they move through their teenage years into adulthood and working life
• Mentoring combined with structured activity days and residential courses designed to foster re-engagement with school, build self-esteem and to improve interpersonal skills
Services/Activities Offered:
• 1-to-1 guidance and group work, residential activities and mentoring • Work experience
• Additional training is provided to approx. 30% of clients to support reintegration into mainstream education
3.4. Duo for a Job (Belgium)
Target Population:Young jobseekers (aged 18 to 30) from the immigrant community (outside the EU)
Theory of Change:
• Through a 6 month program of mentoring from older retirees, ideally with experience in the relevant sector, can increase integration rate of target population
Services/Activities Offered:
• Individual mentoring sessions between young job seekers and experienced retired professionals
3.5. Businezzclub (Netherlands)
Target Population: Young people aged 17 to 27 years old, not in school and without basic qualifications
Theory of Change:
• Helps youths get into work or back to school by giving them insight into their ambitions and teaching them steps to convert them into reality
Services/Activities Offered:
• Workshops and guidance from business people
3.6. ROCA, Inc (USA)
Target Population: Male youth aged from 17 to 23 years old, in the Commonwealth’s probation system or exiting the juvenile justice system. Theory of Change:
• Reintegration and employability achieved through Transformational.
Relationships that Roca’s Youth Workers built along with relentless outreach and stage-based programming.