Página | 56
https://periodicos.utfpr.edu.br/rbgeo
Geomatics data management system
ABSTRACT
Diego de Oliveira Martins
[email protected] orcid.org/0000-0003-4462-3675
Universidade de São Paulo (USP), São Carlos, São Paulo, Brasil.
Gabriel Jurado Martins de Oliveira
[email protected] orcid.org/0000-0002-8621-3845
Universidade de São Paulo (USP), São Carlos, São Paulo, Brasil.
Francisco Roza de Moraes
orcid.org/0000-0002-7413-6467
Universidade de São Paulo (USP), São Carlos, São Paulo, Brasil.
Irineu da Silva
orcid.org/0000-0001-5775-6683
Universidade de São Paulo (USP), São Carlos, São Paulo, Brasil.
André Luiz Barbosa Nunes da Cunha
orcid.org/0000-0002-0520-0621
Universidade de São Paulo (USP), São Carlos, São Paulo, Brasil.
The efficient storage and processing of raw dataset from topographic and geodetic surveys are preponderant factors. Currently, the collection of such information is performed through different types of sensors, and each sensor presents its own raw data in different formats. It is therefore important to develop a data management system that would be able to properly manage these different data, allowing the user to retrieve and apply them conveniently, at any time, simply and quickly. For this purpose, this article proposes a data management system for this type of application, based on a set of control indexes of a representative primary key common to all elements of the database. The quality of the proposed data management system was proven by a dataset of a geodetic structural monitoring project.
Página | 57
INTRODUCTION
Civil engineers, as well as other engineers, have been facing new challenges in their professions due to new technologies and market demands, such as the need to use and process large volumes of data, that have forced them to adapt or develop new ways to carry out their work. As pointed out in ASCE (2010), fast-track development and technology deployment based on information technology and data management have significantly improved how facilities are designed, engineered, built and maintained.
The requirements presented by software engineers, based on principles of information technology, tends to challenge the specific knowledge of engineering professionals, such as to work with a new type of data and their structured (PRESSMAN, 2005). This new technological scenario, on many occasions, forces engineers to develop knowledge that was once exclusive to technician and technologists. How engineers will react to this new reality is still a matter of concern.
Focusing on the area of Geomatics, the same concerns are a reality. As a basic discipline in data collection, processing, and visualization required in many engineering projects, Geomatics professionals face the problem of big data management and the extensive use of engineering software that requires high rates of speed, variety, variability, and complexity inside a database. Real-time data acquisition, data modelling, data storage and data availability, along with the use of high-performance robotic instruments, have made Geomatics data an essential element to ensure the efficiency and good management of various projects in this area.
In short: spreadsheet, such as Microsoft Excel files, is no longer a solution. Users should pay attention to ensuring a data format where it is possible to understand structures and perform standardized and structured handling. Linking data from multiple sources, at different times with different attribute values for the same element, is a concern to be considered for developing a Geomatics database consisting of the possibility of expansion, according to new needs or scenarios of use (CÂMARA et al., 1996).
Based on the importance of the subject, considering the different areas and the needs of Geomatics activities, this article intends to present an initial approach to a Geomatics data structuring system.
The digital information system proposed initially has the objective of assisting in the processes of manipulation of Geomatics data, from topographic equipment. This initial proposal aims only to define a structure of data storage that allows the manipulation and facilitates the use of these data in Geomatics activities, according to the authors' needs.
CONCEPT OF THE PROBLEM
The fundamental data of a topographic or geodetic survey with specific equipment are identifiers of measured points, values of horizontal directions, vertical angles, distances, 3D coordinates and other information related to the instrument, environment, object features, timing, point precision, measurement method and so on, depending on the instrument type and equipment
Página | 58
manufacturer. As an example, a raw data file obtained by a total station, common to brands available on the market today, can present more than 30 different pieces of information about the measurement process and other measurement values. However, what is available to the user will always be a set of information, listed and sorted according to predefined needs on the device.
To be properly used, raw data information will certainly be handled by the user, through an application software specific to the collecting equipment, which will generate a new set of information to be added to the database, such as computed coordinates, for instance. Conversely, as the complexity of the project increases, new raw data will be available, new control points are added to the project and more recent computed data may change the data structure. Hence, forging a structure to achieve the solution to this complex mass of information is highly advisable.
Turning basic raw data into information, regardless of application, would be the safest way to integrate Geomatics data into the project, rather than simple geometric information as distances and angles.
The aim of the scientific project in this area, which is being developed at the University of São Paulo (USP) at São Carlos School of Engineering (EESC), is to develop a database system which, regardless of the application, will make all the stored information automatically available to the user at any time. This system, which is being developed in the Python programming language, will allow the user to make any calculation from the data and combine different pieces of information, with the visualization process directly related to the database. Instead of a simple set of data, the project aims to generate a Geomatics Data Information System.
In this paper, the authors present the first step of development of such a data storage system, which paired with more advanced data handling under development by the research group will definitively form the Geomatics Data Information System.
PROPOSED SYSTEM MANAGEMENT
According to Cormen et al. (2009), any computational system must be developed considering the needs and choices of the project in development. In that sense, due to the complexity of the data handling and the rigor required for the development of such a system, the authors decided to develop a new data management system, rather than directly applying a Structured Query Language (SQL) and Data Base Management System (DBMS). The purpose of this choice is to meet the initial storage needs of a Geomatics project and allow subsequent actions to be consistently processed regardless the data capturing device, time, the processing software and the data release options.
The proposed computational structure corresponds to a storage structure based on layers of distinct attributes, similar to a Geographic Information System (GIS), which allows the system to store different levels of information. The use of attribute layers to store the data will allow the management of large amounts of data in view of future modification and development of new functionalities for the system. Data management efficiency, as well as GIS, will occur due to the use of attributes common to all elements to determine user access intuitively. It is
Página | 59
considered that by using a geographic vector data model, all elements referenced by different geographic coordinates, are expressed as points, lines, or polygons linked to its original and processed data management. It is clearly understood that Geomatics data handling and graphical data release is greatly facilitated by a geographic vector data model.
The basics of this data organization resemble the concepts of indexing by primary key, used in database systems. It promotes a unique identification for each element of the system, in order to guarantee the efficiency and to allow the discovery of restrictions and limitations related to the development of a Computational System in the area of Geomatics. The constraints, observed at this stage of development, will be of great help to assist in the development of a more comprehensive and efficient system that will also have an effect on the structural choices of the final design (ELMASRI; NAVATHE, 2016).
The storage of attribute layers, organized according to the control indexes defined by the user, is performed through a one-dimensional vector of layers. Each vector cell is responsible for archiving a single layer of elements, and therefore the vector must initially have the same number of cells as the number of attributes present in the initial raw data table. Afterwards, new cells can be added based on what the user wants, provided that the established rules for the layers are followed. Based on this principle, access to data stored in the proposed system’s structure must be done by means of the layer position, in the layer vector and the control index values. Access to the values can be accomplished both for a single value and by retrieving any information found in the layer. Having filled up the structure with the reorganized data, the user will be able to carry out any Geomatics data manipulation activities that can be performed with the data, according to user need (SILBERSCHATZ et al., 2010)
Figure 1(a) shows (generically) the proposed management system. The Z-axis represents the vector of layers, responsible for controlling access to each set of attributes. The X and Y-axes represent the referencing system, within the layers of information, responsible for providing specific access to the information. Figure 1(b) presents the computational approach of the proposed system with an attribute set vector, where each cell contains a specific table of elements. The elaboration of these tables must take place in order to create structures with the same dimensions and the same primary keys of control, only differentiating by its contents referring to the attributes represented by each table.
Figure 1 – General graphic design of the proposed management system
Página | 60
STRUCTURE OF THE PROPOSED DATA MANAGEMENT SYSTEM
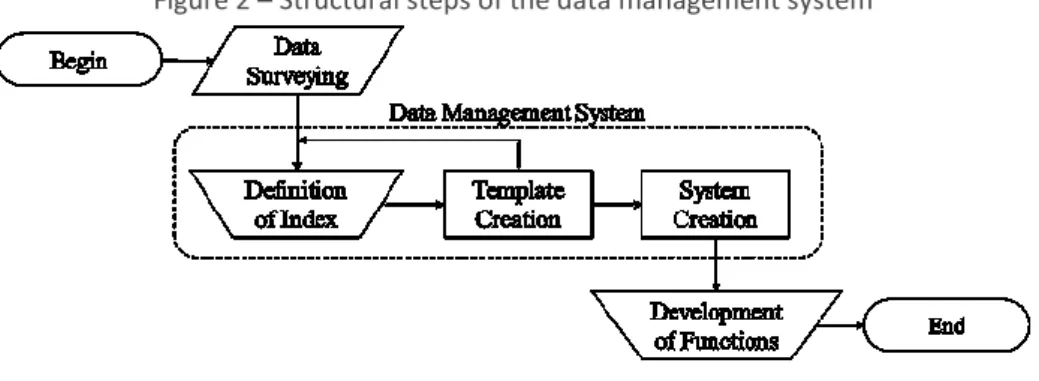
In this section, in order to help in the understanding of the proposed system, it is presented the choices, the organizational and the computational structures of the project. Figure 2 shows the three steps proposed in this work to structure the Data Management System for Geomatics Processes.
Figure 2 – Structural steps of the data management system
Source: Own authorship (2020).
The first step comprises structuring the data collection, according to the user's preference and making the raw data available, according to the capacity of the instruments used in the data collection. For this activity, it is considered that the user has and will continue to have the control to perform the data formatting and structuring the layers of the attributes, as needed for the project.
Before importing the raw data into the system, the user must define the attributes that form the indexing system of the attribute layers. Then, the raw data can be imported.
The attribute layers are the core of the system. The project members led by a Geomatics engineer must define them. It comprises the planning phase that must include all the data format, data correspondence, envisaged applications, computation methods and software manipulation. In short, this is the planning phase of all the elements that must be used throughout the project lifecycle in order to ensure a controlled environment for the whole project’s data management.
The proposed data structure is based on the assumption that the system can be described at least by two attribute layers, which allow (in a unique way) access to each element of the other attributes. According to Yeung and Hall (2007), this organization has the objective to establish geographic attributes that allow access to all other attributes of the dataset in a unique way, in order to manage the entire search and manipulation system present in the geographical system to be developed. Thereby, this setting is an essential step as the entire data management system will be structured from that choice.
Step 2 consists of automatically validating the activities of the previous step by checking the possible values of the selected attributes and their ability to access all elements of the raw data set. Based on this validation, the system must be conditioned to go back to Step 1 to choose new control attributes, every time a case of failure is detected.
In case of validation success, based on the selected attributes, the system must establish a double indexed table, which will be used as a template for the
Página | 61
layers to be created. Each of the selected attributes must necessarily be responsible for controlling one dimension of the table, with the elements present in those attributes controlling specific access to the system information. On the other hand, in case of validation failure, the user must return to the raw data and verify its integrity.
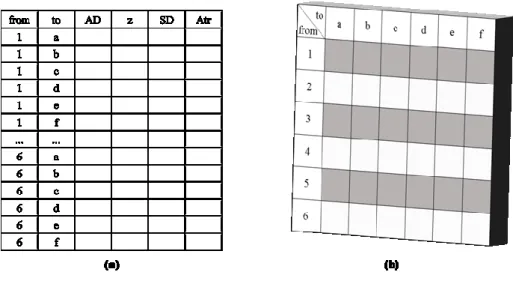
Figure 3 illustrates, in a simplified way, the development of the template using control index organization. Figure 3(a) presents the raw data table from a total station, organized according to the user's choice. In this case, a simple raw data table comprising the station point id (from), aimed point id (to), horizontal direction (AD), vertical angle (z), slope distance (SD) and point attribute (Atr).
Figure 3(b) presents the structural data organization where the From and To attributes of the previous table were selected as control indexes for the template of the system. The attributes are stored in the Z-axis of layers, retrieved from the raw data presented in Table 3(a).
Figure 3 – Template organization system
Source: Own authorship (2020).
Step 3 consists of restructuring the raw data set. Thus, having created the data storage template, the system must initiate restructuration and populate it with the elements of the raw data table. Each attribute value must only fill a single instance of the template. Filling these attribute values must comply with and follow the control index values established for the project.
After the filling process of each instance is completed, the system will add the validated structures to the control vector of information layers. The control vectors will be responsible for organizing all data access, and therefore the system must produce a list of data with the placement of each instance to allow users to understand the structure of data storage, as shown in Figure 4. The positioning list or mapping attributes produced by the system will allow users to have visual control of the data structure to facilitate future data manipulation.
Figure 4 – List of positioning or mapping vector
Página | 62
At the end of the 3 steps, the basic structure of the data management system will be complete. From this point on, the user will be able to efficiently access each element of the attributes for different purposes according to the project´s needs. As examples, the proposed geodetic database management can be used to monitor geodetic structures in the field.
SYSTEM VALIDATION
The application test of the proposed data management system was carried out based on a set of information from a geodetic structural monitoring project, using robotic total stations. In the work of Martins (2013) an analytical study was carried out, with the objective of monitoring structures, which consisted of continuous processes of obtaining elements belonging to a geodetic network.
As shown in Figure 5, the geodetic monitoring project is based on a topographic reference network, where points 1 and 2 correspond to the locations of the total station, points 3 to 5 are the control points and GPRC is the monitoring point. GPRC01 stands for GPRC measurement at time 1.
The raw data collected in the field are point identifiers, directions, angles, distances and point attributes for measurement indexing. The supplementary information stored by the total station was kept in the raw database for further applications.
Figure 5 – Topographic network used in the project at the instance (t01)
Página | 63
The purpose of the measurement is to control the positioning of the GPRC point over time. This means that the GPRC coordinates are expected to change over time and this information must be considered in the data management system.
As repetitive surveying, the same kind of information will be selected at measurement stages, which means that layering is always the same.
The control index values for this type of data collection project must be alphanumeric and represent the current position of the instrument (point ID) and the position of the targets observed by the total station during the measurement sessions.
SYSTEM ORGANIZATION
Based on the type of application used as an example for the proposed data management system, the following aspects of the system must be controlled.
RAW DATA INPUT
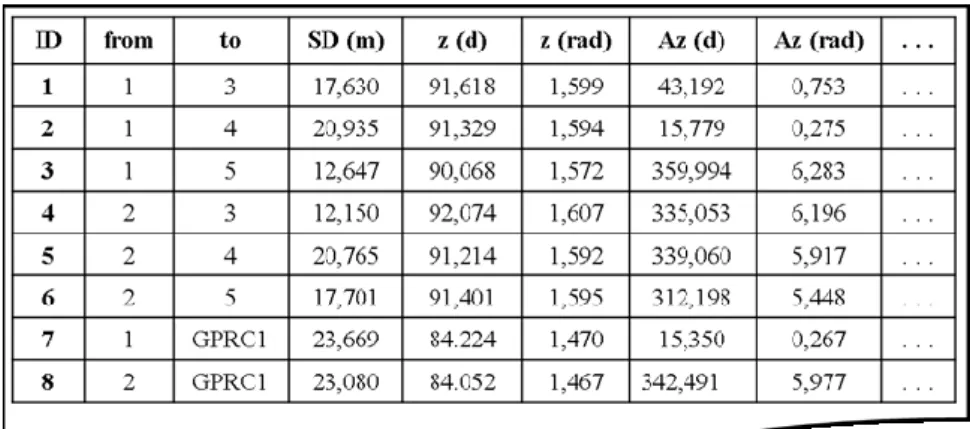
After data collection in the field, with Robotic Total Station (Leica TCRA 1201+ and Leica TCA 1201+), the user must previously perform data processing, directly using the equipment or a proprietary application, to tabulate the information in order to facilitate the reading and storage in the database. In the testing case, proprietary software made available by the equipment producer performed the raw data processing. The data format chosen in the proposed system is indicated in Figure 6. It is possible to observe some of the elements obtained using total stations. However, the raw data set to be used can take the form of a large array, both for rows and columns of geodetic attributes.
As indicated in Figure 6, the most relevant group of information was placed in the first columns of the table and the remaining in the subsequent ones.
Figure 6 – Raw data Input
Página | 64
SYSTEM STRUCTURATION
According to the raw data formatting step, the system structuration was performed, that is, creating the storage template for the selected data for this example, as presented in Table 7. At this stage, the user must establish the project indexes, which in this case were the from and to attributes. The template model established in this step will be repeated whenever necessary, based on the number of attributes stored in the raw database.
Figure 7 – Example of Template created for the project
Source: Own authorship (2020).
After template modeling, the system starts defining the structure instances, that is, the number of times the template will be repeated in the database. Afterwards, it performs the automatic filling of each template with its attributes, depending on the control indexes adopted. Figure 8(a) and 8(b) shows two instances filled with the values of the raw data table shown in Figure 6. Figure 8(a) shows the template filled with the table row ID and Figure 8(b) the template filled with the values of the slope distances.
Figure 8 – Storage structure for Point ID and Slope Distance attributes
Source: Own authorship (2020).
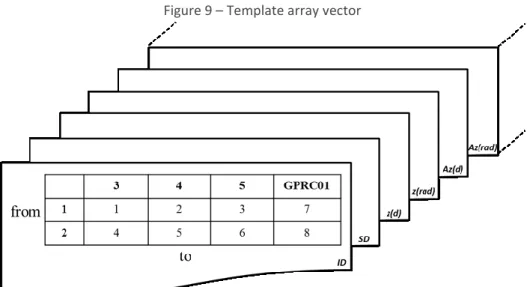
According to the structure designed for the system, after filling all the templates, the array vector automatically adds them, following the order of the attributes defined in the table in Figure 6. The number of attributes used in the project defines the size of this vector organized computationally as shown in Figure 9.
Página | 65
Figure 9 – Template array vector
Source: Own authorship (2020).
Having established the database structure, the system starts the mapping phase, that is, the indication of the positions of the templates, which in the case of the example in question corresponds to the information presented in Figure 10. That information is automatically made available to the user after completion.
Figure 10 – Template mapping
Source: Own authorship (2020).
Access to specific information is based on accessing two elements of the system, which are the position of the template in the array vector and the components of the indexing key. Based on this information, the user will be able to perform content manipulations according to the needs of his projects, such as performing calculations or expanding storage for new attributes.
In the current example, for instance, in a certain stage of the topographic network computation, the user will need information regarding the internal angle values of the triangle network. In this case, based on the system mapping, user will need to indicate the positioning of the template corresponding to the horizontal directions and the indexes of the information (From / To), which will allow the user to calculate the corresponding value. The same procedure should be repeated for the other calculations and manipulations required for the project. In addition, when the data collection is temporal, the number of vectors should be expanded, creating a new vector structure comprising vectors of vectors, with their corresponding mapping. Accesses, in this case, are also expanded. This is the case of the current example, where this occurs due to the need to evaluate the positioning variation of the GPRC point. Likewise, the temporal coordinates of this point must be added as a new template in their respective vectors, with corresponding mapping updates.
Página | 66
CONCLUSIONS AND RECOMMENDATIONS
The need for developing a robust and more comprehensive database for geomatics data management is a fact. The individual datasheet is no longer adequate to meet the growing needs of integrated or large engineering projects.
It is clearly necessary to standardize the storage structures and data management of this kind of dataset in order to provide mass storage and easy access to the users, mainly in big database cases. At same time, it is clearly understood by the research group that the amount of work to completely accomplish the task of developing a Geomatics Data Storage system is huge, reason why the proposed work must be developed by pieces in a long-term research project, where acquired knowledge is the driver for future developments.
Thus, this article has presented a first overview of the problem, proposing data management based on a set of control indexes and array vectors of templates enabling users to retrieve any stored information automatically, as presented in Section 4 of the paper.
For its validation, the system was submitted to a Geomatics dataset generated from a geodetic structural monitoring project, using robotic total stations. The results showed that the presented proposal is able to manage data of this nature in a fast, effective and reliable way, as well as being an open platform for several manipulations, according to the users' needs.
Although without the rigor of a DBMS, the system proposed in this article is efficient for the activity of managing geodetic data sets. According to the results obtained, it is evident the possibility of the expansion of the proposed system for specific functionalities of the Geomatics area. Even though the author has not identified direct system limitations, it is known that the proposed systems expansion will face it, since every expanding system has limitations, such as obsolete programming language and new data type.
It was also possible to observe the possibility of adapting the system to an application based on efficient and well-known computing structures, in order to develop an efficient system to compose the Geomatics Data Information System project. The efforts made in this paper made it possible to analyze and comprehend, albeit superficially, the needs and organizations of raw Geomatics data and thus establish an initial structure for a data management system.
This knowledge will be used in future stages to expand the uses and scope of the proposed system. The whole project is intended to be an open source system in order to allow modification and expansion of its structures and functionalities according to the needs of each user.
In its final format, the proposed system may still have external routines that will allow users and developers to implement special applications in conjunction with the information made available in the database.
Overall, the contribution of this paper is the creation of a Geomatics Data Storage System dedicated whose main attribute is to obtain an end-to-end control of the process by the user. Although there are well-structured data management systems, such as SQL, this database system, still in the initial phase, is a new possibility to address the problem. Thus, for future work, it is
Página | 67
recommended to evolve the system for the formality of a DBMS and perform comparative analysis among other existing systems, such as SQL.
Página | 68
Sistema de gerenciamento de dados de
geomática
RESUMO
O armazenamento e processamento eficientes de conjunto de dados brutos a partir de levantamentos topográficos e geodésicos são fatores preponderantes. Atualmente, a coleta dessas informações é realizada por meio de diferentes tipos de sensores, e cada sensor apresenta dados brutos em diferentes formatos. Portanto, é importante desenvolver um sistema de gerenciamento de dados que permita o manuseio adequado desses diferentes dados, permitindo ao usuário recuperá-los e aplicá-los de maneira conveniente, a qualquer momento, de forma simples e rápida. Para este propósito, este artigo propõe um sistema de gerenciamento de dados, baseado em um conjunto de índices de controle de uma chave primária comum a todos os elementos de um banco de dados. A qualidade desse sistema de gerenciamento de dados proposto foi comprovada por um conjunto de dados de um projeto de monitoramento estrutural geodésico.
Página | 69
BIBLIOGRAPHY
ASCE - American Society of Civil Engineers. American Society of Civil Engineers:
The vision for engineering in 2025. Virginia, 2010.
CÂMARA, G.; CASANOVA, M. A.; HERMELY, A. S.; MAGALHÃES, G. C.; MEDEIROS, C. M. B. Anatomia de sistemas de informação geográfica. Campinas: Editora da UNICAMP, 1996. 193p.
CORMEN, T. H.; LEISERSON, C. E.; RIVEST, R. L. ; STEIN, C. Introduction to
algorithms. 3 ed. Cambridge: The MIT Press, 2009. 1292p.
ELMASRI, R., NAVATHE, S. B. Fundamentals of database systems. 7 ed. Texas: Pearson, 2016.
MARTINS, D. O. Determinação de coordenadas espaciais a partir do método das
distâncias mínimas. 2013. 256p. Dissertação (Mestrado em Engenharia de
Transportes) - Escola de Engenharia de São Carlos – Universidade de São Paulo, 2013.
PRESSMAN, R. S. Software engineering: a practitioner's approach. 6 ed. New York: McGraw-Hill, 2005.
SILBERSCHATZ, A.; KORTH, H. F.; SUDARSHAN, S. Database system concepts. 6 ed. New York: McGraw-Hill, 2010.
YEUNG, A. K. W.; HALL, G. B. Spatial database systems: Design, implementation and project management. 1 ed. Dordrecht: Springer, 2007. 553p.
Recebido: 24 mai. 2019
Aprovado: 29 jun. 2020
DOI: 10.3895/rbgeo.v8n1.10141
Como citar: MARTINS, D. O.; OLIVEIRA, G. J. M.; MORAES, F. R.; SILVA, I.; CUNHA, A. L.. Geomatics
data management system. R. bras. Geom., Curitiba, v. 8, n. 1, p. 056-069, jan/mar. 2020. Disponível em: <https://periodicos.utfpr.edu.br/rbgeo>. Acesso em: XXX.
Correspondência: Diego de Oliveira Martins
Rua Vicente Pelicano, 940, CEP 13571-000, São Carlos, São Paulo, Brasil.
Direito autoral: Este artigo está licenciado sob os termos da Licença Creative Commons-Atribuição 4.0