Functional biogeography of oceanic islands and the
scaling of functional diversity in the Azores
Robert J. Whittakera,b,1, François Rigalc, Paulo A.V. Borgesc, Pedro Cardosoc,d,e, Sofia Terzopoulouc,f, Fernando Casanovesg, Laura Plah, François Guilhaumonc,i, Richard J. Ladlea,j, and Kostas A. Triantisa,c,f
aSchool of Geography and the Environment, University of Oxford, Oxford OX1 3QY, United Kingdom;bCentre for Macroecology, Evolution and Climate, Department of Biology, University of Copenhagen, Copenhagen, Denmark;cAzorean Biodiversity Group, Centro de Investigação e Tecnologias Agrárias dos Açores (CITA-A), and Platform for Enhancing Ecological Research and Sustainability (PEERS), Departamento de Ciências Agrárias, Universidade dos Açores, São Pedro, 9700-042 Angra do Heroísmo, Terceira, Azores, Portugal;dNational Museum of Natural History, Smithsonian Institution, Washington, DC 20560; eFinnish Museum of Natural History, University of Helsinki, 00014, Helsinki, Finland;fDepartment of Ecology and Taxonomy, Faculty of Biology, National and Kapodistrian University of Athens, GR-15784 Athens, Greece;gHeadquarters, Centro Agronómico Tropical de Investigación y Enseñanza, CATIE 7170, Cartago, Turrialba 30501, Costa Rica;hComplejo Docente el Hatillo, Universidad Nacional Experimental Francisco de Miranda, Apartado 7434, Coro 4101, Venezuela; i“Rui Nabeiro” Biodiversity Chair, Centro de Investigação em Biodiversidade e Recursos Genéticos, Universidade de Évora, 7000-890 Évora, Portugal; and jInstitute of Biological Sciences and Health, Federal University of Alagoas, Maceió, Alagoas, Brazil
Edited by Cyrille Violle, Centre National de la Recherche Scientifique, Montpellier, France, and accepted by the Editorial Board January 3, 2014 (received for review October 17, 2012)
Analyses of species-diversity patterns of remote islands have been crucial to the development of biogeographic theory, yet little is known about corresponding patterns in functional traits on islands and how, for example, they may be affected by the introduction of exotic species. We collated trait data for spiders and beetles and used a functional diversity index (FRic) to test for nonrandomness in the contribution of endemic, other native (also combined as indigenous), and exotic species to functional-trait space across the nine islands of the Azores. In general, for both taxa and for each distributional category, functional diversity increases with species richness, which, in turn scales with island area. Null simu-lations support the hypothesis that each distributional group con-tributes to functional diversity in proportion to their species richness. Exotic spiders have added novel trait space to a greater degree than have exotic beetles, likely indicating greater impact of the reduction of immigration filters and/or differential historical losses of indige-nous species. Analyses of species occurring in native-forest remnants provide limited indications of the operation of habitat filtering of exotics for three islands, but only for beetles. Although the general linear (not saturating) pattern of trait-space increase with richness of exotics suggests an ongoing process of functional enrichment and accommodation, further work is urgently needed to determine how estimates of extinction debt of indigenous species should be adjusted in the light of these findings.
island biogeography
|
saturation|
arthropods|
assembly rules|
habitat destructionI
n comparison with less-isolated settings, the biotas of oceanic island archipelagos are species poor, disharmonic, endemic-rich, and particularly sensitive to disturbance (1). Founded by strongly dispersal-filtered sets of colonists, some of which have since diversified, their precontact biotas represent the dynamic outcome of immigration, speciation, and extinction processes. Following human contact, they have experienced waves of an-thropogenic species immigration, ecosystem transformation, in-digenous species population reductions, and extinction (1). We may sustain such broad generalizations by reference to many case studies but, in so doing, disregard some intense debates within island biogeography: for instance, whether prehuman contact biotas can be regarded as equilibrial, what rules govern disassembly of precontact assemblages and the assembly of the novel combinations of indigenous and exotic species, how long it will take for the many ecological adjustments to play out before the tally of extinctions of declining indigenous species is clear, or indeed whether the net effect of anthropogenic interference (land-use change, species introductions, etc.) may be higher levels of species diversity (1, 2).Although traditional island biogeographic analyses sensu MacArthur and Wilson (3) have identified notable differences between the emergent diversity patterns of endemic, other na-tive, and exotic species across islands (4–6), they have so far failed to resolve the questions posed above. This failure may in part be because they mostly rely upon analyses in which species are treated as equivalent (but see, e.g., ref. 7). In contrast, case-study evidence suggests that the introduction of particular species possessing novel trait characteristics (e.g., mammalian predators, large herbivores) can have dramatic and dispropor-tionate impacts on island ecosystems and assemblages (1, 8, 9). Such observations suggest that analyses based on functional traits (“components of an organism’s phenotype that influence ecosystem level processes”; see ref. 10, p. 742) may provide especially valuable insights for island biogeographic theory (and perhaps vice versa).
Herein, we assess the scaling of functional diversity (FD) with island area and species richness (SR), testing for nonrandomness in the contributions of differing distributional groups of species. For exploratory purposes, we used the following distributional categories: endemics, natives (excluding endemics), indigenous (endemics plus natives), exotics, and all species, noting that the overlaps between categories renders certain tests nonindependent.
Significance
Biogeographic theory builds upon a long history of analyzing species-diversity patterns of remote islands, but no previous studies have attempted to investigate corresponding patterns in functional traits on islands. Our analyses of functional di-versity (FD) for spiders and beetles in the Azorean archipelago reveal that FD increases with species richness, which, in turn scales with island area regardless of the taxa and distributional group considered (endemics, natives, and exotics). Our results also support the hypothesis that each group contributes to FD in proportion to their species richness and that, being domi-nant, exotic species have significantly extended the realized trait space of the Azorean islands. Further analyses in other archipelagos are needed to establish whether our findings are representative of oceanic islands.
Author contributions: R.J.W., F.R., and K.A.T. designed research; P.A.V.B., P.C., S.T., and K.A.T. performed research; F.R., P.C., F.C., L.P., and F.G. analyzed data; and R.J.W., F.R., P.A.V.B., F.G., R.J.L., and K.A.T. wrote the paper.
The authors declare no conflict of interest.
This article is a PNAS Direct Submission. C.V. is a guest editor invited by the Editorial Board.
1To whom correspondence should be addressed. Email: [email protected]. This article contains supporting information online atwww.pnas.org/lookup/suppl/doi:10. 1073/pnas.1218036111/-/DCSupplemental.
ECO
LOGY
SPECIAL
archipelago, a uniquely well-specified oceanic island system. The Azores were originally almost fully forested, but, since human colonization (ca. A.D. 1440), native-forest cover has been reduced to<5% (11). Spiders are top predators among invertebrates and present an array of potentially important traits related to habitat structure and resource use. Beetles are the most diverse insect Azorean order (as they are globally), include a wide range of feeding ecologies and are prevalent in most habitats. Current estimates are that 22 spider species are endemic, 17 native, and 85 exotic, with respective values for beetles being 65, 134, and 325 (12, 13). It is likely that several endemic species are already globally extinct (14) and analyses of the Azorean “extinction debt” based on calibrated species-area models predict further extinctions to follow (2). However, the logic of those extinction-debt analyses is based on reductions in habitat area of native forest without adjustment for the role of exotics.
Several FD indices have been developed for the analysis of interspecific variation in functional traits for whole assemblages (15, 16). However, there have been few applications of these methods to island faunas (but see, e.g., ref. 8). More specifically, we are not aware of any work quantifying at island scale how functional-trait space of invertebrates has been changed, and with what consequences, by anthropogenic alteration of oceanic islands. Our goal is thus to explore the absolute and relative contribution of endemic, native, and exotic invertebrate species to functional-trait space at island and archipelagic scales in a system of nine oceanic islands spanning from 17 to 757 km2in area. We also test for nonrandomness of FD contributions at finer resolution within the remaining native-forest enclaves.
To estimate FD, we use FRic (a measure of functional rich-ness) (17) calculated from input data based on seven traits for spiders and three traits for beetles. Given the broad differences in ecology (encompassing trophic status, flight ability, etc.) be-tween these groups, the traits selected necessarily differ: the spider traits relate to size, feeding behavior, and habitat use whereas the beetle traits relate to size, feeding guild, and flight capabilities (Materials and Methods). We test for evidence of trait-space saturation with increasing island area and species richness for each distributional group and for all species (Materials and Methods and SI Appendix, Table S1). We also test for the contribution made by, and degree of overlap between, each dis-tributional group by means of null-model simulations. We thus address a question of fundamental island- and conservation-bio-geographical interest (e.g., refs. 18 and 19): Are the exotic species occupying and thus competing within essentially the same func-tional space as indigenous groups, or are they serving to expand the functional biodiversity of the archipelago?
Island species–area relationships (ISARs) typically show a positive trend, with slopes (z values) indicative of the process(es) establishing species richness and composition patterns (1, 5, 20). As we move from speciation-dominated systems (e.g., oceanic islands) to immigration–extinction dynamics (e.g., continental-shelf islands) and then to systems of little dispersal-limitation (e.g., inland islands), we generally observe lower values of z, as is also the case when comparing narrowly endemic species (higher z) to nonendemic natives (lower z) within oceanic archipelagos (5, 20). Recent work on functional traits has shown that FD, when measured as functional richness, is typi-cally strongly related to SR (10, 17). Combining these insights, we next consider the implications for patterns of FD in an oce-anic archipelago. As remote oceoce-anic islands have strongly colo-nization-filtered (“disharmonic”) biotas, we predict that, in the absence of large-scale trophic collapse driven by ecosystem transformers (9), anthropogenic introductions should add FD disproportionately with reference to native species and endemics and should therefore significantly expand the occupied func-tional-trait“space” of the archipelago. Because of the expected
lands, possessing the fewest indigenous species, will see the greatest proportional gains in FD through the introduction of exotic species even if (compared with larger islands) compara-tively few exotic species manage to arrive (less economic activity, less transport to the island) and establish (smaller human set-tlements) on those small islands. Higher proportional gains in smaller islands are expected because, with increasing richness (larger islands, more introductions), the chances of each new arrival adding truly novel trait combinations to the system diminishes. Therefore, the expansion of FD space by the addi-tion of exotic species is predicted to decrease with island size. Based on the foregoing, we would predict that (i) log–log ISARs should increase in slope (z values) from exotics to natives and especially to endemics whereas (ii) the equivalent island functional diversity–area relationships (IFDARs) should increase in slope from exotics to indigenous species, with little difference between natives and endemics, as the latter groups experienced the same colonization filter in reaching the archipelago. By contrast, the rank order of “intercepts” (c values) may not be so readily pre-dicted as a function of distributional groups, as much depends on the age and isolation of the islands and the extent of human transportation (1, 5).
Our analyses provide no support for the saturation of trait space at island level: Exotic species add FD approximately in proportion to increasing SR. This result holds for both spiders and beetles although exotic spiders appear to contribute more functional novelty than exotic beetles. Our predictions for the form of ISARs and IFDARs met with only equivocal support (for spider ISARs and beetle IFDARs). Finer scale analyses, restricted to species occurring in native-forest remnants, provide some intriguing indications of habitat filtering on particular is-lands for beetles, but not for spiders. Our results indicate that anthropogenic habitats and species introductions are combining to permit the persistence in these highly altered oceanic islands of much higher SR than might be anticipated from traditional applications of island theory while processes connected with habitat loss nonetheless continue to drive the attrition of the indigenous fauna (2, 14, 21).
Results
We first established that the significant log–log ISARs previously established for both spiders and beetles (2) hold, with some variation, for the distributional subsets (Fig. 1 andSI Appendix, Tables S2 and S3). For spiders, endemics display a steep ISAR, and natives a flat (nonsignificant) ISAR, but when the two cat-egories are combined as “indigenous” species, the resulting ISAR is indistinguishable in slope from that of the exotic cate-gory whereas exotics have a higher intercept, reflecting their greater SR (Fig. 1 andSI Appendix, Table S3A). For beetles, the distributional subsets have indistinguishable slopes but differing intercepts [analysis of covariance (ANCOVA)] (SI Appendix, Table S3B). Having established that the traits we used are mostly complementary rather than redundant with one another (SI Appendix, Tables S1 and S4), we tested for the equivalent island functional diversity–area relationships (IFDARs). The IFDARs show that FD generally increases with island area, with the ex-ception of the endemics subsets, for which no significant re-lationship was obtained (Fig. 1 andSI Appendix, Table S3A). For spiders, the slopes of the IFDARs for different subsets are in-distinguishable, but the intercepts differ, whereas the between-group differences for beetles involve both intercept and slope (Fig. 1 andSI Appendix, Table S3B). Thus, in general, SR and FD each scale with island area, consistent with classic island theory (1, 3, 20) while statistical support for our specific pre-dictions regarding ISAR and IFDAR form was limited to spider ISARs and beetle IFDARs.
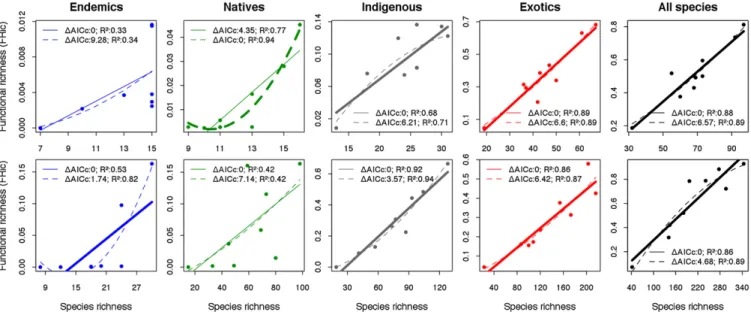
Comparison of linear and polynomial model fits for the FD–SR relationship provides a test for saturation in trait space with increasing SR across the nine islands (eight for endemics)
(Fig. 2). Linear models are preferred [based on small sample size-corrected Akaike information criterion (AICc) values], with the following exceptions: for endemic spiders and native beetles, neither model is adequate (F statistic tests, P> 0.05); for endemic beetles, theΔAICcbetween the linear and polynomial models is <2, indicating equivalence in fit, and, for native spiders, the fitted polynomial indicates increasing FD with higher SR rather than a tendency toward asymptote. Comparison with a sensitivity analysis indicates the patterns for endemics to be equivocal and unstable (Fig. 2 andSI Appendix, Fig. S1); in addition, a sepa-rate sensitivity test established that linear models are preferred for each distributional group of spiders upon reduction of the number of traits from seven (main analyses) down to three (as for beetles) (SI Appendix, SI Materials and Methods, and Table S5).
We next used a simulation approach to create null dis-tributions of expected FD per island for each observed SR value. We report two such simulations (SI Appendix, Table S6). First, based on the entire archipelagic species pool, we found no de-viation from the null expectation for either taxon for any dis-tributional grouping; i.e., observed FD is simply a function of SR. Our second simulation was restricted to species occurring in the native forest (SONF), to assess the outcome of species assembly processes in the habitats where most remaining threatened en-demic species occur. In this case, spider values did not depart from expected, but significantly lower than expected values were observed for six islands for native beetles (Faial, Pico, S. Jorge, S. Maria, S. Miguel, and Terceira) and for three islands for exotic beetles (S. Maria, S. Miguel, and Terceira). Lower values imply that, for the given SR, the FRic value is lower than expected were these species a random draw from the archipelagic SONF pool.
To further interrogate the trait-space occupancy and overlap among endemics, natives, and exotics, we undertook analyses of the whole archipelagic species pool (rather than per island) and estimated FRic as before, but using a slightly lower proportion of the derived trait data (Materials and Methods and SI Appendix, Fig. 1. Island species–area relationships (ISARs) and island functional
diversity–area relationships (IFDARs) for Azorean spiders and beetles per island; n= 9 islands, except for the IFDAR endemics (n = 8), for which Corvo Island could not be included (SI Appendix, Table S2). FRic was computed based on six PCoA axes (81% total inertia) and seven PCoA axes (92%) for spiders and beetles, respectively. Dashed lines indicate nonsignificant regressions, all others being significant at P< 0.05 (seeSI Appendix, Table S3for details). Note that overplotting obscures some data points.
Fig. 2. The relationship between functional richness values (FRic, ref. 17) and species richness (SR) for Azorean spiders (Upper) and beetles (Lower) for each distributional category, where each data point represents an island (n= 9, except for endemics, where n = 8 as Corvo Island was excluded). Linear (full lines) and polynomial (dotted lines) fits and their respectiveΔAICcand R2values are given. Bold lines indicate that the model is significant (F statistic test P< 0.05) and has the lowestΔAICcvalue. In all cases, apart from endemic beetles, this is also the single“best” model and the preferred model (based on ΔAICc). Note that the polynomial model for endemic beetles is unrealistic in indicating negative FRic values, meaning that, even in this case, the linear model is pref-erable on grounds of ecological realism. FRic was computed based on six PCoA axes (81% total inertia) and seven PCoA axes (92%) for spiders and beetles, respectively.
ECO
LOGY
SPECIAL
occupied by exotic species, 36.24% by natives, and 20.64% by endemics (Table 1). The endemic trait space is nested within that of natives, and natives within the exotics. By contrast, endemic (83.1%) and native (89.8%) beetles occupy far larger pro-portions relative to exotics (95.8%) although, again, the space occupancy is largely nested. The null simulations indicate that each distributional category contributes to the overall trait space as expected as a simple function of their SR. There are two marginal exceptions: First, endemic spiders occupy less func-tional space than expected and, second, the overlap between endemic and exotic spiders is less than expected. One corollary is that spider mean body size increases from endemic to native to exotic spiders (although only endemic body size is statistically distinct) whereas, for beetles, the three distributional categories are not distinguishable by body size (SI Appendix, SI Results, Body Length). These results indicate that the emergent patterns in FD can be related back to the underlying functional-trait data (compareSI Appendix, Fig. S2). Moreover, even when analyzing a single, common trait, there are differences between the two taxa in the relative contribution to FD made by endemics, natives, and exotics. The patterns in body size are also broadly as expected as larger bodied spiders are relatively unlikely to reach such remote islands naturally by ballooning, but may readily do so by human transportation (cargo in boats and planes). In contrast, beetles are less likely to demonstrate such a strong body size-related filter due to their active flight capability.
As the within-island habitat occupancy of the different groups may be crucial to the ecological interpretation (e.g., ref. 21), we undertook a further randomized simulation analysis of the spe-cies occurring in native forest, analyzing the degree of overlap in FD between exotic SONF and indigenous SONF and how this overlap compares with that expected if the exotic SONF were a random draw from the overall set of exotic species. This test showed only one deviation from the null expectation across the nine islands (Table 2). Only for beetles on Terceira Island is the overlap marginally lower than expected by chance, implying a de-gree of functional divergence between exotic SONF and indigenous
SONF (Table 2). Thus, based on the traits assessed here, the as-semblage of exotic species that has been observed in native-forest habitat in each island is (with that one exception) essentially a random subset of the exotics pool and not a pool of species fil-tered with respect to their similarity with indigenous species. Discussion
For most distributional groups, we obtained a strong positive relationship between island area and species richness (SR), with exotic SR exhibiting a similar but elevated ISAR to indigenous species, while FD also increases in proportion to both island area and SR across the nine islands of the archipelago. Thus, the principal effect of increasing SR by the addition of exotics is to generate a corresponding increase in FD, with no evidence of saturation. Whereas the ISARs vary mostly in their intercepts, the form of the IFDARs indicates that exotic spiders contribute an increasingly large proportion of FD with increasing island log-area. The pattern for beetles differs, with indigenous species showing comparable FD to exotics across the larger islands (Fig. 1).
Our analyses of functional space occupancy and overlap show that exotic spiders have contributed much more to the increase in functional trait-space occupancy than have exotic beetles, both in absolute terms and in proportion to increasing SR (Table 1, Fig. 1, andSI Appendix, Fig. S3). Exotic spiders have added new taxonomic diversity to the Azores. For example, 13 of the 26 spider families now found on the archipelago are wholly com-prised of exotics (13), including species bringing completely new foraging strategies to the regional functional space. For beetles, a rather lower proportion—18 of 54 families—are represented only by exotics (13), consistent with their making a lesser con-tribution to functional space across the archipelago. In summary, the most striking emergent pattern is that, for both taxa, FD scales up with the area and number of species per island, in-dicating that the present-day Azorean fauna appears to be largely unsaturated in terms of functional-trait space and con-sequently remains vulnerable to further colonization by newly introduced exotics (22).
These observations of expanding“biodiversity” contrast with claims (2, 14) of past and impending extinctions as a result of habitat alteration, yet these scenarios may be easily reconcilable with reference to the massive anthropogenic changes since col-onization ca. A.D. 1440. The native habitats, on which many indigenous arthropods are dependent (23), have been reduced across the archipelago to <5% of their original cover, and an array of new agricultural, forestry, urban, and semiurban habitats have been created in their place. Concurrently, large numbers of exotic species have been introduced by anthropogenic means,
Table 1. Functional-space occupancy and overlap per distributional group, for all Azorean species (n values inSI Appendix, Table S2) based on FRic estimated from the first four PCoA axes using a Gower distance matrix
Distributional groups Spiders Beetles
Functional space Endemics 20.64 (−1.873)* 83.1 (0.550) Natives 36.24 (0.567) 89.8 (−0.290) Exotics 99.74 (0.687) 95.8 (−3.032)* Overlap Endemics–natives 19.01 (−0.047) 76.3 (0.148) Endemics–exotics 20.55 (−1.917)* 79.9 (0.263) Natives–exotics 36.04 (0.696) 88.3 (−0.409) Endemics–natives–exotics 18.98 (−0.019) 75.9 (0.123)
PCoA axes 1–4 account for 71% and 77% of the total inertia for spiders and beetles, respectively. Results were standardized by the full volume ex-pressed as (Endemics+ Natives + Exotics) − (Endemics ∩ Natives + Endemics ∩ Exotics+ Natives ∩ Endemics – Endemics ∩ Natives ∩ Exotics), to sum to 100%, where∩ is the intersection between pairs of volumes or among the volumes. In parentheses: deviation from the null expectation (given observed SR) for the functional-space overlap between categories and among the three categories measured by the standardized effect sizes (SESs), i.e., (O− M)/S, where O is the observed value and M and S are the mean and SD, respectively, of 1,000 randomizations of the trait distribution for that plot. Negative SESs mean functional spaces and overlaps are lower than expected by chance and positive SESs mean the opposite, where * indicates 0.01< P < 0.05 and, in all other cases, P> 0.05.
(SESs) from the null expectation (given observed SR) for the functional overlap between exotic species occurring in native forest (SONF) and indigenous SONF for Azorean spiders and beetles species, based on the PCoA analyses reported in Table 1
Island Spiders Beetles
Corvo 0.237 −1.212 Faial 0.019 −1.045 Flores 0.702 0.279 Graciosa 1.290 −1.544 Pico 0.243 0.740 São Jorge 0.457 −0.736 São Miguel 0.691 −1.863 Santa Maria 0.538 −0.377 Terceira −0.423 −2.416*
many of which occur wholly or predominantly in novel, anthro-pogenic habitats (24). The resulting ecological relationships be-tween indigenous and exotic species must span the full gamut from closely co-occurring and interacting, to nonexistent, depending on the ecology and habitat occupancy of the particular species under consideration.
Previous work has shown evidence of source–sink dynamics operating between native and anthropogenic habitats in these islands. This process operates in both directions, with some en-demic spiders and very few enen-demic beetles (see, e.g., ref. 23) spilling into novel sink habitats surrounding native forest whereas intensive pasture is the main habitat source of exotic species invading native forest (25). The success (i.e., abundance and spread) of such exotic“invasive” species has been found to vary between soil and canopy habitats. In particular, the canopies of Azorean endemic trees seem to be a specialized habitat, and few exotic insects and spiders maintain“source” populations there (12, 25, 26). These findings suggest that there may be assembly rules determined by a combination of functional traits and characteristics of the habitat template at local scales of analysis. In the present coarser-scaled analyses, we found no evidence for saturation at the island scale, and, when analyzing overlap be-tween exotic and indigenous species occurring in native forest (SONF), we again found no deviation from expected, apart from the single case of beetles on Terceira (for which functional di-vergence was found). We did find slightly more extensive indi-cations of lower FD than expected as a function of SR for native SONF in six islands and exotic SONF for three islands for beetles (Table 2 andSI Appendix, Table S6). These findings are intriguing. However, when endemic and native species are recombined to represent the whole indigenous assemblage of SONF, no departure from random is evident. The three islands showing lower than expected FD for exotic SONF are S. Maria, S. Miguel, and Terceira. These islands are the three richest is-lands in terms of exotic species and, on the basis of this test, would appear to show some evidence of saturation of native forest for exotics. Alternative explanations are possible; for example, these results might reflect the existence of large numbers of urban beetle species, or of recent arrivals that have yet to reach and enter the remaining native-forest fragments (24). It thus appears that multiscale analyses will be necessary, assessing species abundances and population trajectories, to determine how exotic species are influencing survival prospects of indigenous species in the remaining forest patches.
We recognize that FD values can be sensitive to properties such as the number and range of traits considered and that the outcome of certain FD analyses can also be sensitive to how the species pool is defined (15, 27). In the present analysis, we nec-essarily began by using the archipelagic species pool, as we lack a more realistic basis for defining a regional species pool. It is also important to note that we cannot be certain of the number, or trait selectivity, of extinctions of indigenous species that may have occurred without record, and which may have impacted on the functional trait-space occupancy and FD of indigenous groups (2, 13, 14) (SI Appendix, SI Materials and Methods). Moreover, a fuller picture of trait occupancy requires the use of additional FD indices that in essence interrogate the occupancy of the convex hull space analyzed herein (e.g., functional evenness or functional divergence) (17), and which make use of species-abundance data: unfortunately such data are lacking at a whole-island scale.
To conclude, it is apparent that exotic species have signifi-cantly expanded the realized trait space and FD of the Azorean islands, generating emergent FD patterns strikingly consistent with those of the indigenous fauna (compare ref. 4), while remaining largely dependent on the extensive anthropogenic habitats that have replaced the native forests. These findings suggest that, whereas island area strongly constrains both species
richness and FD, the diversity levels observed are not indicative of a fixed area-dependent species carrying capacity. Rather, the capacity attainable has increased as the biological isolation of the islands has been progressively diminished by human agency. Although there is no evidence of saturation of the anthropogenic habitat space, endemic species are threatened in their native-forest enclaves (2), in which a degree of habitat filtering is ap-parent, at least for beetles. Further analyses of the functional biogeography, for other taxa and archipelagos, at multiple scales of analysis, are needed to establish whether the findings reported herein are representative of oceanic islands (compare ref. 28). In addition, long-term monitoring data are required to determine the extent to which indigenous species of the Azores can persist within the now much larger pool of species present on the islands.
Materials and Methods
In all cases, we undertook and reported separate analyses for spiders and for beetles, conducting statistical analyses implemented within the R pro-gramming environment (29) and the software FDiversity (30). Where sig-nificance tests are reported, the critical value used was<0.05.
Study Area. The Azores are volcanic, oceanic islands spanning the mid-Atlantic ridge, roughly 1,600 km from the European mainland. Humid evergreen broadleaf laurel forest (laurisilva) covered most of the land area before human colonization ca. A.D. 1440. Around 95% of these forests have since been destroyed by humans (11). The current major vegetation habitats across the archipelago comprise native forest, exotic forest, seminatural pasture, and intensively managed pasture (2, 21, 23, 25).
Functional Traits and Distributional Data. Data on the occurrence of species in each island and categorizations as endemic, native, or exotic were drawn from the latest compilations (13). We collated and/or recorded information for each spider species for (i) body length (average between females and males), (ii) web use, (iii) web architecture, (iv) foraging strategy, (v) prey range, (vi) vertical stratification, and (vii) circadian activity; and for each beetle species (i) body length, (ii) feeding guild, and (iii) wing morphology (seeSI Appendix, SI Materials and Methods for details). Except for body length, all traits were coded as nominal variables. For analyses focused on species occurring in native forest (hereafter SONF), we used our distribu-tional data (SI Appendix, SI Materials and Methods) to denote exotic SONF and indigenous SONF. As some of the exotic SONF may have been“tourists” or“sink populations,” we avoided terming this group “invasive species.” Computing FD. Functional diversity (FD) was computed using the functional richness index FRic (17), which measures the multidimensional volume of trait space defined by using a convex hull volume. FRic does not require abundance data (which are unavailable in this study) and is not sensitive to species splitting; it is also effective for discriminating assembly rules (e.g., ref. 15) (seeSI Appendix, SI Materials and Methodsfor details). First, Gower’s distance was used to calculate multivariate distances between species based on the raw trait data. To avoid negative eigenvalues, the Gower’s distance matrix was subject to primary square-root transformation (31). These dis-tance data were then subject to principal coordinates analysis (PCoA)s and the resulting PCoA axes were used as new composite functional traits. FRic is then based on the minimum convex hull volume that contains all of the species selected for analysis (e.g., all endemics, exotic species on Faial Island, etc.). As the index requires that there are more species than there are traits (17) and in certain categories we have small numbers of species, we used only the first six (spiders, 81% total inertia) and seven (beetles, 92% total inertia) PCoA axes to estimate FRic for the island-by-island analyses. For endemics, as Corvo island has only three endemic spider and four endemic beetle species, we ran these analyses without Corvo (for subsidiary analyses including Corvo, seeSI Appendix, SI Results). Due to computational restric-tions, for analyses at the archipelago level (where very large numbers of species are involved), we used only the first four PCoA axes. We calculated FD (i.e., FRic) for five species groups: (a) endemics, (b) natives (i.e., excluding endemics), (c) indigenous (i.e., a plus b), (d) exotics, and (e) all species. Relationships with Island Area. We estimated the log–log island species–area relationship (ISAR) and the equivalent island functional diversity–area re-lationship (IFDAR) for each distributional category. The significance of both linear and quadratic models was assessed using the F statistic. Differences
ECO
LOGY
SPECIAL
analysis of covariance (ANCOVA), first considering endemics, native non-endemic, and exotics and, second, indigenous and exotic species.
Testing Redundancy. Potential presence of saturation/redundancy, for each grouping, was analyzed by means of the interisland SR–FD relationship. We used linear modeling and evaluated the relevance of a quadratic term (polynomial) to account for potential curvilinear relationships (i.e., indica-tions of saturation) (32, 33). The significance of both linear and quadratic models was assessed using the F statistic. The additional information pro-vided by the quadratic model was assessed on the basis of percentage of explained variance (R2) and the small sample size-corrected AICc. The most parsimonious model has the lowest AICc, and thusΔAICc= 0. Models with ΔAICcbetween 0 and 2 were considered to have equivalent empirical support, and models withΔAICc> 2 were considered to have less support (34). Second, to distinguish whether FD was simply a product of SR, we used a simulations approach to create null distributions of FD for each observed SR value. Keeping SR constant for each island and category, we randomly selected species from the global pool of species without distinction between endemic, native, and exotic species. We repeated this procedure 999 times to produce a distribution of null FD values. The final null distribution included the 999 random values plus the observed value. Based on this null distribution, we computed the stan-dardized effect size (SES) for each island to measure deviation of the observed FD from the null distribution. The P value associated with our null hypotheses, i.e., no deviation from a random assortment for species, was estimated per island. To avoid type I errors, we applied a false discovery rate analysis (FDR) (35) to account for multiple test comparisons.
Estimating Functional Space and Overlap. Overlap between endemic, native, and exotic functional space at the archipelago scale was estimated following ref. 36. The multidimensional volume (i.e., convex hull) for each set of spe-cies was estimated, allowing quantification of the intersection between two (or more) species assemblages. The overlap is maximal when the two func-tional spaces are equally similar or one is nested in the other and minimal (zero) when assemblages do not intersect in their functional spaces. Due to
cies were run using only the first four PCoA axes (see Computing FD), summarizing 71% and 77% of the total inertia present in the initial Gower distance matrix for spiders and beetles, respectively, and for each pairwise comparison of endemics, natives, and exotics. To determine whether out-comes are simply a function of SR variation between categories, two dif-ferent hypotheses were tested: (i) Does the functional space for each category differ significantly from a random expectation for the given SR? (ii) Does functional pairwise overlap differ significantly from a random expec-tation for a given difference in SR? Expected distributions were obtained by 999 randomizations of the label of the distributional categories for each species (i.e., endemics, natives, and exotics) keeping SR constant. Statistical significance of the observed values was estimated by calculating the P value from the null distributions.
Functional Overlap Between Exotic and Indigenous Species Occurring in Native-Forest Habitat. To test whether the exotic species co-occurring with in-digenous species in native-forest habitat are a random draw from the overall set of exotic species, we undertook a further test focusing only on species occurring in native forest (SONF). Expected distributions of the overlap be-tween exotic SONF and indigenous SONF were obtained by measuring the overlap between indigenous SONF and random selections of all exotic species 999 times, keeping richness of the exotic SONF per island in the native habitat constant. Statistical significance was estimated as above.
ACKNOWLEDGMENTS. For contributing beetle-trait data and measurements, we thank Volker Assing, Andrés Baselga, Marina Blas, Simone Fattorini, Rafael García, Maria Kamilari, Elena Gotsi, Jorge Lobo, Pedro Oromí, Wolfgang Rücker, José Serrano, António O. Soares, Peter Sprick, Zdenek Svec, and Dmitry Ternov. We thank the journal reviewers and editor for comments. This study was partly financed by Fundação para a Ciência e a Tecnologia (FCT) Project FCT-PTDC/BIA-BEC/100182/2008. K.A.T., F.R., and P.C. were supported by FCT Fellowships SFRH/BPD/44306/2008, FCT-PTDC/BIA-BIC/119255/2010, and SFRH/ BPD/40688/2007, respectively; F.G. by“Range Shift” Project FCT-PTDC/AAC-AMB/098163/2008, cofinanced by the European Social Fund; and S.T. by an Azorean Biodiversity Group grant.
1. Whittaker RJ, Fernández-Palacios JM (2007) Island Biogeography: Ecology, Evolution, and Conservation (Oxford Univ Press, Oxford), 2nd Ed.
2. Triantis KA, et al. (2010) Extinction debt on oceanic islands. Ecography 33:285–294. 3. MacArthur RH, Wilson EO (1967) The Theory of Island Biogeography (Princeton Univ
Press, Princeton, NJ).
4. Sax DF, Gaines SD, Brown JH (2002) Species invasions exceed extinctions on islands worldwide: A comparative study of plants and birds. Am Nat 160(6):766–783. 5. Triantis KA, Mylonas M, Whittaker RJ (2008) Evolutionary species–area curves as
vealed by single-island endemics: Insights for the inter-provincial species–area re-lationship. Ecography 31:401–407.
6. Price JP, Wagner WL (2011) A phylogenetic basis for species-area relationships among three Pacific Island floras. Am J Bot 98(3):449–459.
7. Borges PAV, Hortal J (2009) Time, area and isolation: Factors driving the di-versification of Azorean arthropods. J Biogeogr 36:178–191.
8. Blackburn TM, Petchey OL, Cassey P, Gaston KJ (2005) Functional diversity of mam-malian predators and extinction in island birds. Ecology 86:2916–2923.
9. Terborgh J (2010) The Trophic Cascade on Islands: The Theory of Island Biogeography Revisited, eds Losos JB, Ricklefs RE (Princeton Univ Press, Princeton), pp 116–142. 10. Petchey OL, Gaston KJ (2006) Functional diversity: Back to basics and looking forward.
Ecol Lett 9(6):741–758.
11. Gaspar C, Borges PAV, Gaston KJ (2008) Diversity and distribution of arthropods in native forests of the Azores archipelago. Arquipél Life Mar Sci 25:1–30.
12. Borges PAV, Wunderlich J (2008) Spider biodiversity patterns and their conservation in the Azorean archipelago, with description of new taxa. Syst Biodivers 6:249–282. 13. Borges PAV, et al. (2010) A List of the Terrestrial and Marine Biota from the Azores
(Princípia, Oeiras, Portugal).
14. Cardoso P, Arnedo MA, Triantis KA, Borges PAV (2010) Drivers of diversity in Maca-ronesian spiders and the role of species extinctions. J Biogeogr 37:1034–1046. 15. Mouchet MA, Villéger S, Mason NWH, Mouillot D (2010) Functional diversity
mea-sures: An overview of their redundancy and their ability to discriminate community assembly rules. Funct Ecol 24:867–876.
16. Schleuter D, Daufresne M, Massol F, Argillier C (2010) A user’s guide to functional diversity indices. Ecol Monogr 80:469–484.
17. Villéger S, Mason NWH, Mouillot D (2008) New multidimensional functional diversity indices for a multifaceted framework in functional ecology. Ecology 89(8):2290–2301. 18. Lambdon PW, Lloret F, Hulme PE (2008) Do non-native species invasions lead to biotic homogenization at small scales? The similarity and functional diversity of habitats compared for alien and native components of Mediterranean floras. Divers Distrib 14:774–785.
19. Ladle RJ, Whittaker RJ, eds (2011) Conservation Biogeography (Wiley-Blackwell, Oxford).
20. Triantis KA, Guilhaumon F, Whittaker RJ (2012) The island species–area relationship: Biology and statistics. J Biogeogr 39:215–231.
21. Cardoso P, et al. (2009) A spatial scale assessment of habitat effects on arthropod communities of an oceanic island. Acta Oecol 35:590–597.
22. Borges PAV, et al. (2006) Invasibility and species richness of island endemic arthro-pods: A general model of endemic vs. exotic species. J Biogeogr 33:169–187. 23. Meijer SS, Whittaker RJ, Borges PAV (2011) The effects of land-use change on
ar-thropod richness and abundance on Santa Maria Island (Azores): Unmanaged plan-tations favour endemic beetles. J Insect Conserv 15:505–522.
24. Borges PAV, et al. (2013) New records of exotic spiders and insects to the Azores, and new data on recently introduced species. Arquipél Life Mar Sci 30:57–70. 25. Borges PAV, Ugland KI, Dinis FO, Gaspar C (2008) Insect and spider rarity in an oceanic
island (Terceira, Azores): True rare and pseudo-rare species. Insect Ecology and Con-servation, ed Fattorini S (Research Signpost, Kerala, India), pp 47–70.
26. Ribeiro SP, Borges PAV (2010) Canopy habitat area effect on the arthropod species densities in the Azores: Pondering the contribution of tourist species and other life histories. Terrestrial Arthropods Of Macaronesia: Biodiversity, Ecology And Evolution, eds Serrano ARM, Borges PAV, Boieiro M, Oromí P (Sociedade Portuguesa de En-tomologia, Lisbon), pp 89–114.
27. Lessard J-P, Belmaker J, Myers JA, Chase JM, Rahbek C (2012) Inferring local ecological processes amid species pool influences. Trends Ecol Evol 27(11):600–607.
28. Gillespie RG, Claridge EM, Roderick GK (2008) Biodiversity dynamics in isolated island communities: Interaction between natural and human-mediated processes. Mol Ecol 17(1):45–57.
29. R Development Core Team (2011) R: A Language and Environment for Statistical Com-puting (R Foundation for Statistical ComCom-puting, Vienna, Austria). Available at www. R-project.org.
30. Casanoves F, Pla L, Di Rienzo JA, Díaz S (2011) FDiversity: A software package for the integrated analysis of functional diversity. Methods Ecol Evol 2:233–237. 31. Legendre P, Legendre L (1998) Numerical Ecology (Elsevier Science, Amsterdam), 2nd Ed. 32. Bihn JH, Gebauer G, Brandl R (2010) Loss of functional diversity of ant assemblages in
secondary tropical forests. Ecology 91(3):782–792.
33. Mayfield MM, et al. (2010) What does species richness tell us about functional trait diversity? Predictions and evidence for responses of species and functional trait di-versity to land-use change. Glob Ecol Biogeogr 19:423–431.
34. Burnham KP, Anderson DR (2002) Model Selection and Multimodel Inference: A Practical Information-Theoretic Approach (Springer, New York).
35. Benjamini Y, Yekutieli D (2001) The control of the false discovery rate in multiple testing under dependency. Ann Stat 29:1165–1188.
36. Villéger S, Novack-Gottshall PM, Mouillot D (2011) The multidimensionality of the niche reveals functional diversity changes in benthic marine biotas across geological time. Ecol Lett 14(6):561–568.