Capital Structure and Firm’s Life Cycle: An Iberian
Study
Bruno Alexandre Rua Valente
[email protected]Dissertation
Master in Finance
Supervisor
Júlio Fernando Seara Sequeira da Mota Lobão, PhD
i
Biographical Note
In 1993, Bruno Alexandre Rua Valente was born in Lisbon. Graduated in Finance and Accounting in ISCTE-IUL, also in Lisbon in 2014. In the same year, he left for Porto, and started his Master's Degree in Finance from the School of Management and Economics at the University of Porto, because of his passion on financial markets. During this period, he was a member of the finance department of AIESEC in FEP and worked for a month as a phone banking assistant at Caixa Geral de Depósitos. In September of 2015, he moved again to Lisbon in order to join KPMG, more precisely in the transfer pricing department. In April 2017, still within KPMG, he moved to the corporate tax department.
ii
Acknowledgments
As a very special thanks, I would like to say a word of strong appreciation to my family, especially my parents, for all the support during all my life. To my girlfriend, for her motivation, never allowing me to give up. To my tutor for all the guidance and expertise that made me available to carry out this work. To Eduardo Brunaldi and to Tanveen Ahsan, both specialist in my research theme, for their help in the empirical part of my dissertation.
iii
Abstract
Although there are a variety of capital structure determinants studied in the literature, the life cycle seems to be considered of peripheral importance. In fact, capital structure overlooks that firms have different capital requirements across their life cycle. In addition, the finance literature highlights various theoretical models that explain how the firms’ life stages influence capital structure decisions, such as the Pecking Order, Trade-Off, Agency Cost and Diamond’s Theories. Therefore, our study analyzes a set of 117 Iberian non-financial listed firms over the period of 2001 to 2016 with the main aim of assessing the sample companies’ capital structure adjustment along their life cycle stages. We found a leverage adjustment rate for growing firms of 74%, 72% and 30% for short-term, long-term and total leverage, respectively, and a leverage adjustment rate for mature firms of 54%, 52% and 30% for short-term, long-term and total leverage, respectively. Also, we evidenced that Iberian companies in decline stages are going away from their target short-term and long-short-term leverages, but adjust their total leverage with a rate of 72%. For the total leverage, our results support the evidence of Ahsan et al. (2016) and Rehman et al. (2016). However, for the short- and long-term leverage, our results were not consistent with the literature. Additionaly, we verified a low-high-low pattern for short-term leverage consistent with the Trade-Off Theory and in accordance with the studies of Ahsan et al. (2016) and Rehman et al. (2016). For the remaining proxies of leverage (long-term and total), the patterns found were high-low-low.
Key-words: Capital structure; life cycle stages; leverage; adjustment rate; panel data. JEL Classification: G32, C23, M21.
iv
Resumo
Embora existam vários estudos sobre determinantes da estrutura de capital na literatura, o ciclo de vida parece ser considerado de importância periférica. De fato, a estrutura de capital negligencia que as empresas tenham requisitos de capital diferentes ao longo dos seus ciclos de vida. Além disso, a literatura financeira destaca vários modelos teóricos que explicam como as fases de vida das empresas influenciam as decisões da estrutura de capital, como as Teorias de Pecking Order, Trade-Off, Agency Cost e Diamond. Assim, o presente estudo analisou um conjunto de 117 empresas ibéricas não financeiras listadas no período de 2001 a 2016, com o principal objectivo de avaliar o ajustamento da estrutura de capital das empresas da amostra ao longo das suas fases do ciclo de vida. Observámos para empresas em crescimento uma taxa de ajustamento de 74%, 72% e 30% para a leverage de curto prazo, longo prazo e total, respetivamente, e para as empresas em fase de maturidade uma taxa de ajustamento de 54%, 52% e 30% para a leverage de curto prazo, longo prazo e total, respetivamente. No entanto, as empresas em fases de declínio estão a afastar-se das suas estruturas de capital de curto e longo prazo target, mas, por outro lado, ajustam a sua estrutura de capital total com uma taxa de 72%. Para a
leverage total, os nossos resultados suportam a evidência de Ahsan et al. (2016) e Rehman
et al. (2016). No entanto, para leverage de curto e de longo prazo, os resultados não são consistentes com a literatura. Adicionalmente, verificámos um padrão de leverage de curto prazo low-high-low consistente com a Teoria do Trade-Off e em conformidade com os estudos de Ahsan et al. (2016) e de Rehman et al. (2016). Para as restantes proxies da estrutura de capital (longo prazo e total), os padrões encontrados são high-low-low.
Palavras-chave: Estrutura de capital; fases de ciclo de vida; leverage; taxa de
ajustamento; dados em painel.
v
Contents
Biographical Note ... i Acknowledgments ... ii Abstract ... iii Resumo ... ivIndex of Tables ... vii
1. Introduction ... 1
2. Literature Review ... 3
2.1. Capital Structure ... 3
2.1.1. Pecking Order Theory ... 5
2.1.2. Trade-Off Theory ... 5
2.1.3. Agency Cost Theory ... 5
2.1.4. Diamond’s Theory ... 6
2.2. Life cycle ... 6
2.3. Capital Structure and Life Cycle ... 9
2.3.1. Empirical Evidence ... 10
3. Hypotheses Development ... 13
4. Data Description ... 16
4.1. Classification of firms in different life cycle stages ... 16
4.2. Dependent Variable ... 18
4.3. Independent Variables ... 19
4.4. Descriptive Statistics ... 21
5. Empirical model ... 23
5.1. Correlation matrix and VIF test ... 26
5.2. Empirical Results and analysis ... 30
vi
5.2.2. Capital structure’s determinants ... 33 6. Conclusion ... 36
vii
Index of Tables
Table 1: Leverage pattern across firm’s life cycle as suggested by capital structure .... 15
Table 2: Life cycle variables and classification method ... 17
Table 3: Descriptive statistics of firm’s classification variables ... 18
Table 4: Summary table of control variables, their proxies and proposed relationship with leverage ... 19
Table 5: Descriptive Statistics of dependent and independent variables in the three life cycle stages ... 21
Table 6: Correlation matrix and VIF test for short-term leverage ... 26
Table 7: Correlation matrix and VIF test for long-term leverage ... 27
Table 8: Correlation matrix and VIF test for total leverage ... 28
Table 9: F-test and Hausman Test ... 30
1
1. Introduction
As the literature states, there is no universal theory of the debt-equity choice and no reason to expect one (Myers, 2001). However, there are several factors that can influence the choice of the capital structure of a company, such as growth, profitability, size and leverage (Pinho, 2013; Castro et al., 2015), among others. Hence, it becomes important to address the various theories that attempt to explain this theme.
In accordance, the studies on capital structure started with the publication of Modigliani and Miller’s article, in 1958. That publication had such an impact that many other researchers investigated this subject, leading to the rise of other theoretical perspectives on capital structure decisions, namely the introduction of taxes, the effect of bankruptcy costs, the Trade-Off Theory, the Agency Cost Theory, the Pecking Order Theory, among others.
By one of the others we mean life cycle, for example. The relevance and timeliness of this theme for companies, to which must be added the fact that conceptual theory and empirical evidence concerning the effect of firms’ life stages in their capital structure are not consensual, were the main reasons for the present study. Also, there is little expression of studies and articles dedicated to this topic in Portugal and in Spain and there is no consensus on the identification of each stage of the life cycle. Notwithstanding, the capital structure has not been given due attention because firms have different capital requirements over their life cycle, therefore, studying this theme provides a greater understanding on the optimal capital structure and on the best way to identify each life cycle stage.
Hence, the general objective of the present study is to contribute to the literature review of the capital structure puzzle, trying to test whether the life cycle is an important factor to consider in the capital structure’s decisions. Thus, by studying the impact of the firms’ life stages in their capital structure we intend to conclude if the effects of the firms’ life stages on capital structure are associated with the Pecking Order, Trade-Off, Agency Cost or Diamond’s Theories and on the adjustment rate observed for each stage.
Our research sample is composed by 117 companies and comprises data over the period between 2001 and 2016, through the export of financial information contained in the Thomson Reuters Eikon database. To measure the degree of the relationship between
2
capital structure and life cycle stages, we first start to apply the methodology to identify the firms’ life stages (dependent variable), which is the one used by Anthony and Ramesh (1992). Then, we estimated a regression model for the dependent variable leverage, according to three proxies: short-term leverage, measured as the ratio of short-term loan to total assets; long-term leverage that is the ratio of long-term loan to total assets; and total leverage, which translates into the ratio of total liabilities to total assets.
Further, this dissertation intends to assess the sample companies’ capital structure adjustment along their life cycle stages, using a methodology also applied by Ahsan et al. (2016) and Rehman et al. (2016), who used a partial adjustment model with the assumption that the observed change in the capital structure is in function of the desired change.
We found that growing non-financial Iberian firms adjust their leverages by 74%, 72% and 30% for short-term, long-term and total leverage, respectively. Mature firms did it by 54%, 52% and 30% for short-term, long-term and total leverage, respectively. In what concerns declining firms, we concluded that, with the exception for total leverage which presented a high adjustment rate of 72%, firms in decline stages are going away from their target short- and long-term leverages.
These results were consistent with Ahsan et al. (2016) and Rehman et al. (2016), evidencing that when the total leverage is studied, companies adjust their capital structure in the stages of growth, maturity and decline. However, when the short- and long-term leverage is tested, the results for the decline stage have shown that firms do not follow an optimal capital structure and therefore these results are not consistent with these authors.
The structure of this study will proceed as follows. The second chapter presents the literature review, which addresses the main determinants of the capital structure, the main contributes on the life cycle framework and also some empirical studies regarding the relationship between both concepts. The third develops our hypotheses. In the fourth chapter, we describe the data and the methodology adopted. In the fifth chapter, we develop the empirical model, its results and its analysis. Finally, in the sixth chapter, we conclude on our findings, on our contribution and our recommendations for further future research.
3
2. Literature Review
In this chapter, we present the key classical theories regarding the two main frameworks of the research theme: Capital Structure and Life Cycle. We also present some of the most recent empirical studies that approached the relationship between both frameworks.
As the research subject indicates, it approaches two main frameworks: Capital Structure and Life Cycle. As both are usually studied separately, I decided to review the literature as such.
2.1. Capital Structure
Defined as the way a firm finances its assets through a combination of debt and equity (Schoroeder et al, 2005), capital structure is one of the most famous topics studied in the financial literature, even knowing beforehand that there is no universal theory of the debt-equity choice and no reason to expect one (Myers, 2001).
The first study of the capital structure problem started with the Traditional View released by David Durand in 1952, however, it was after the publication of the Modigliani and Miller article in 1958 that the capital structure study intensified.
For Durand (1952), the so-called traditional view is based on the existence of a perfect optimal combination of debt and equity that minimizes the weighted average cost of capital and maximizes the market value of a company. The author also argued the existence of a relation between the indebtedness of a company and its value, as the less equity a company uses, the greater its profit maximization will be. However, it should be noted that higher indebtedness carries a higher risk, which should be reflected in the cost required by creditors and in the return on equity. In addition, this study lacks a formal model, so it is not representative of a true theory.
Therefore, as mentioned, the real start began with the publication of Modigliani and Miller’s article, in 1958. In this study, Modigliani and Miller objected to what had been stated by Durand (1952), by arguing that there is no optimal capital structure and that the value of a company is independent of its capital structure. However, the authors’ approach was based on strong assumptions, such as perfect markets, investor rationality, homogeneous expectations, information symmetries, absence of taxes, transaction costs, bankruptcy costs and agency costs. Indeed, such assumptions do not represent reality.
4
In 1963, denoting a limitation on their previous study, the same authors published a new study, in which they revised and included the effect of taxes as determinants of the market value of a company, contradicting their initial idea in which they argued that the effect of income taxes was minimal and did not influence the value of a firm. With the exception of the absence of taxes, their previous assumptions remained in force. Hence, they concluded that a high income tax and financing expenses deductible in fiscal terms would mean greater tax savings which would increase its value of a company. In fact, the deduction of financing expenses would mean that the taxable income would be lower and, consequently, would generate less tax payable, which would certainly lead to an increase in the value of the company. This led to the conclusion that the capital structure is relevant in determining the value of a firm. In particular, it was concluded that indebtedness decreases the weighted average cost of capital and, consequently, increases the value of a company linearly. Therefore, its value is maximized with the minimization of equity. However, with the conclusion that the maximization of value arises when company’s assets are totally financed with debt, the authors warned that no company should be fully indebted. Hence, this model should also be interpreted with some limitations, since it is inappropriate to reality.
A few years later, in 1977, Miller alone produced a model, under which he reinforced the idea of the tax effect on the capital structure by introducing the joint effect of corporate and personal income taxes. He concluded that the firm’s value in equilibrium is independent of the capital structure adopted. Moreover, he sustained that the two tax effects cancelled each other out, so the optimal combination between equity and debt does not change the value of a firm.
Since the publication of Modigliani and Miller’s (1958) theory, a vast literature was developed to investigate the robustness of their conclusions on investors' indifference between debt and equity. In fact, except for Dybvig and Zender (1986), the literature concluded that the first Modigliani and Miller (1958) proposition fails to hold in the presence of market imperfections since factors/determinants that could influence the capital structure of a firm were found. Thus, capital structure decisions are usually explained on the basis of the following theories: the introduction of Taxes, the effect of Bankruptcy Costs, Trade-Off, Agency Cost, and Pecking Order Theories, among others.
5
notwithstanding the scientific relevance of other themes, we will follow the structure proposed by Ahsan et al. (2016) and Rehman et al. (2016).
2.1.1. Pecking Order Theory
Based on studies related with information asymmetry and profitability, it was developed the Pecking Order Theory, which concludes that a firm orders its financing preferences as follows: first, a firm prefers internal funds; then, it choses external debt; and only as its last resource a firm choses equity (Myers, 1984; Myers and Majluf, 1984).
According to the Pecking Order Theory, a firm does not pursue a target capital structure, but instead follows a pattern in its financing policy which can be changed according to its opacity of information asymmetry, levels of profitability and financial needs.
2.1.2. Trade-Off Theory
Contradicting the theory above, the Trade-Off Theory emerged, establishing that companies seek an optimal capital structure (introducing the static trade-off concept), which can be obtained through a trade-off between costs and benefits associated with leverage (in a perfect market environment). Notwithstanding, it should be noted that an optimal capital structure can be influenced by several exogenous and endogenous factors that change over time, especially across firms’ life cycle stages. Hence, according to Fischer et al. (1989), firms adjust their capital structure by making dynamic decisions (dynamic trade-off concept).
In order to obtain a larger tax shield benefit, a firm should raise more debt, in accordance with the Trade-Off Theory, irrespective of its life cycle stage. However, the increase of debt will increase also the firm bankruptcy and financial distress risk. Hence, it is necessary to reach a breakeven point between tax benefits and bankruptcy costs.
2.1.3. Agency Cost Theory
Moreover, Agency Cost Theory is also mentioned as one of the most relevant explanatory theories of capital structure. It should be emphasized that this theory is based on the existence of information and interest conflicts, which may arise between those involved in the activity of a company, such as managers, shareholders and creditors, with respect to the use of free cash flows and firm’s resources. In fact, the companies that suffer most
6
from this are the ones that generate higher amounts of cash flows. This type of conflicts leads Jensen and Meckling (1976) to believe that the solution may lead to the use of an optimal level of debt, because debt repayments would reduce the available free cash flows, so managers would not have enough to invest in non-valuable businesses.
In addition, the increase of debt in the capital structure is most of the times caused by agency costs, because debt “enables managers to bond their promise to pay out future cash flows” (Jensen, 1986). According to Agency Cost Theory, firms use more debt in their capital structure when investors seek to pressure management to use funds efficiently.
2.1.4. Diamond’s Theory
According to Diamond (1989), firm’s reputation can explain its financing preferences, since reputation varies during a firm’s life cycle. Effectively, firms in their earlier stages have less reputation, meaning that they have less confidence to raise debt, and they are also characterized by having high information asymmetry. As companies become more mature, they reduce their information asymmetry and eventually increase their reputation, putting them in a better position to raise debt. The same goes for companies in the declining stages, which already have a huge track record and a solid reputation that allows them a high debt capacity as well.
2.2. Life cycle
As observed in the literature review on the subject of capital structure, the life cycle has never really been approached as one of its explanatory theories. However it was approached as being part of some of the existing explanatory theories.
Nonetheless, the life cycle became an interest to researchers approximately in the period when capital structure theories started to be developed.
According to Black (1998), this theory is an extension of the product life cycle theory. Thus, in the same sense as products, companies usually progress through a set of life stages that start with birth and ends in death (Frielinghaus et al., 2005).
Hence, it was approached, as a field of study, the organizational life stage theory, based on which several students tried to understand the firm’s development by its comparison
7
to human life cycle (Lippit and Schmidt, 1967; Adizes, 1979, Miller and Friesen, 1984; Black, 1998; Levie and Lichtenstein, 2008).
Several models in the last fifty years were generated which differ, not only in the number of stages and their classification criteria, but also in the way of determining of a particular phase. Meanwhile, there are two problems in understanding and employing the concept.
Firstly, there is no consensus on the definition of firms’ life cycle stages due to the difficulty in choosing the model to be used. There are those who propose life cycle models with three phases (Anthony and Ramesh, 1992), four phases (Miller and Friesen, 1980; Quinn and Cameron, 1983), five phases (Miller and Friesen, 1984; Scott and Bruce, 1987; Dickinson, 2005; Dickinson, 2011) and ten phases (Adizes, 1979). Secondly, there is no consensus regarding the identification of each life cycle stage.
However, most of the theories and studies on life cycle agreed on growth, maturity and decline as the three stages of a firm’s life cycle (Rehman et al., 2016), what could mean convergence between researchers on this subject.
To better clarify and help to answer these questions, Zhipeng, in 2006, developed a study called “A new methodology of measuring firm life cycle stages”. In this sense, the authors described the three most common used methodologies for measuring life cycle stages.
The one approached by Miller and Friesen (1984) identified a five life cycle stages model, which is composed by birth, growth, maturity, revival and decline stages. For the classification of firms in each life stage, they applied numeric and descriptive criteria. In practice, they restricted the sample to companies that have been in existence for a long period of time (at least 20 years) and divided a firm’s history into representative periods by examining all relevant information about the firm. In addition, they used firms’ age in the definition of the birth phase. For the other stages it was used sales growth data. Zhipeng (2006) appointed as disadvantage the fact that researchers need to gather a tremendous amount of information on firms before they can identify and assign different periods. Also it does not allow a big sample (e.g. only 36 companies were studied).
8
The study of Anthony and Ramesh (1992) classified firms according to a three (or five) life cycle stages model, with three stages (growth, mature and stagnant) for univariate procedure, and two additional stages (growth/mature and mature/stagnant) used in the multivariate procedure. For the classification, four variables were used: dividends, sales growth, capital expenditure and age. They ranked firms on each of the four life cycle descriptors and grouped them into the life cycle stages through a scoring model. Zhipeng (2006) concerned with Anthony and Ramesh’s approach in classifying firms, due to ranking them among all the firms every year. In fact, for example, for a company in a weak growth sector, a sales’ growth of 5% may be high, but for another company in a high growth sector, this 5% of sales’ growth might not be so positive.
A more recent study developed by Dickinson (2005), with a five life stages model (introductory, growth, maturity, shakeout and decline), the author used signs (positive or negative) of three types of cash flows (cash flows from operating, investing and financing activities) in each firm-year to classify firms in five stages. For example, a firm in the introductory stage should have negative operating cash flows, negative investing cash flows and positive financing cash flows. On the other hand, firms with positive operating cash flows, negative investing cash flows and negative financing cash flows should be in the growth stage. For Zhipeng (2006), like the study of Anthony and Ramesh (1992), the model of Dickinson (2005) has the disadvantage of being difficult to perform any time series analysis within each life cycle stage.
In addition to the review of other methodologies, Zhipeng (2006) purposed their methodology, which they mention that would help to avoid the lack of generality problem of studying only a few organizations, showing that it can be widely used for big samples, quantified as more than “thousands or even millions” if needed, especially in finance researches. However, this methodology only uses two classification variables (age and sales growth).
Recently, Dickinson (2011) developed another study in which were also identified 5 stages, but now with a different designation: birth, growth, maturity, decline and revival. For the classification of firms in life stages, the author focuses on operating, investing and financing cash flows. It should be noted that this study was firstly used in a capital structure article in a study developed by Castro et al. (2015), which defined as an advantage of this methodology the possibility to observe the differences by stage and the
9
usage of operating, investing and financing cash flows. By considering these three aspects of the business jointly, this method overcomes the partiality of using just one discriminant variable, which is a commonplace in the literature.
According to Gup and Agrrawal (1996), the life cycle of companies can present itself as a realistic and dynamic tool in the study of the financial policies adopted by the companies. It is certain that companies are born, grow and decline, renew and reappear, or may not survive and disappear (Kimberly et al., 1980). All businesses, throughout their development, have distinct phases, each with its own characteristics (Scott and Bruce, 1987). The concept that firms evolve through a financial life cycle is well identified in the literature (La Rocca et al., 2011). However, several studies have been developed both on the life cycle and on the capital structure, but there are few that explained how both issues are related.
2.3. Capital Structure and Life Cycle
In fact, capital structure’s choice is likely to be influenced according to the phase where the company is in terms of life cycle, as financing needs may change with the changing circumstances of a firm (Damodaran, 2001).
From its initial phase to a more mature one, a company should use progressively more debt (Hovakimian et al., 2001). These financing preferences were analyzed in the same view by Damodaran (2001), stating that expanding and high-growth firms would use primarily equity, while mature firms would use debt instead.
La Rocca et al. (2011) also warned for the need of companies to look at the stages of life in which they are when they make financing decisions and strategies. This information relates to the fact that in their early stages, companies tend to have higher levels of information asymmetry, more opportunities for growth and a smaller size.
Berger and Udell (1998) wrote an article in which they show how capital structure varies with firm size and age. For them, as companies become older and larger, their characteristics and ambitious change.
In addition, the findings of the relation between capital structure and life stage can help better understanding how a firm financing changes over the time.
10
2.3.1. Empirical Evidence
As already mentioned, there was little research focusing directly on the relationship between capital structure and life cycle stage theories, but in the last years there have been some empirical evidence on the subject. Below we present some of the most important empirical studies’ results.
Frielinghaus et al. (2005) study the relationship between capital structure and a firm’s life stage for a sample of 81 South African private and public companies. They use the Adizes’ life stage model (ten stages) to assess the life stage of the firms. They find a statistically significant relationship between life stage and capital structure. In addition, considering that there is more debt in the early and late life stages than in prime, they also argue that the nature of the relationship supports the Pecking Order Theory of capital structure. Moreover, in contrast with the static Trade-Off Theory, the Pecking Order Theory suggests a high-low-high of debt ratio over time.
Pinková and Kaminková (2011) investigate the impact of corporate life cycle on the capital structure of fifty medium-sized Czech automotive companies for a sample period between 2002 and 2010. In accordance, they classify firms on the basis of cash flow patterns proposed by Dickinson (2011). The findings suggest that both the development of debt-to-equity ratio and the development of current liabilities in different stages of corporate life cycle indicate the linkage between life cycle and capital structure. Furthermore, they considered that the Pecking Order Theory is related to the corporate life cycle issue, due to the funding behaviour of companies, which in the stages of birth and growth use typically more debt than equity. As for mature companies, the level of debt decreases, but it rises again in the decline stage. As so, they suggest a high-low-high pattern.
La Rocca et al (2011) explore the financing choices of small and medium-sized firms through the lens of the business life cycle through a sample of 10,242 Italian non-financial small and medium-sized firms, not involved in a bankruptcy process for a period from 1996 to 2005. Their results concluded that the Pecking Order Theory shows a higher degree of application.
Alves (2013) studies the capital structure decisions from a sample of 1905 small and medium enterprises located in Castelo Branco, Portugal, from 2005 to 2009, verifying if
11
the life cycle is a relevant explanatory determinant of capital structure for those companies. The author’s findings point out that the capital structure decisions of SME’s located in Castelo Branco follow the Pecking Order Theory.
Getzmann et al. (2014) analyze the speed of adjustment toward target capital structures for 1239 asian companies based on generalized method of moments estimations. His findings strong evidence that companies in Asia pursue target capital structures, as predicted by the Trade-Off Theory. He also shows that the convergence to target capital structures is consistent with international evidence, estimated at an annual adjustment speed of 24–45% of original leverage levels.
Castro et al. (2015) examine the effect of a firm’s life cycle stages on the capital structure in tech versus non-tech firms using a wide sample of public companies from Europe. The authors used Dickinson’s (2011) approach to measure life cycle stages, classifying firms into five life stages (introduction, growth, mature, shake-out and decline) according to their cash flow patterns. Although this study aims to compare capital structures throughout the life cycle of technological companies with non-tech firms, this study concluded that there was evidence in the relationship between the capital structure and the life cycle. Additionally, through the test of Pecking Order Theory, the lower use of debt of technological companies throughout their life cycle was confirmed.
Tian et al., 2015) use a panel data-fixed effect approach and data collected from Chinese public manufacturing firms between 1999 and 2011. They used Dickinson’s (2011) approach to classify companies into five life stages (introduction, growth, mature, shake-out and decline) by cash flow patterns. They found that Chinese public manufacturing companies adjust their debt ratio at different speeds when they are in different life cycle stages. Specifically, the adjustment speed showed a U-shaped pattern over the life cycle, as follows: it is 68.52 (birth), 61.31 (growth), 26.91 (mature), 42.96 (revival) and 48.78 (decline) percent, respectively.
Ahsan et al. (2016) analyze, with a Fixed Effects Model, the adjustment rate made to target capital structures by a large amount of Pakistani listed non-financial firms with a sample period between 1972 and 2010. To classify firms into life cycle stages they chose the multivariate methodology (Anthony and Ramesh, 1992), using growth, mature and decline stages. They find a low-high-low leverage pattern during growth, maturity and
12
decline stages, in line with Trade-Off Theory. The study also observes different adjustment rates for the three stages, as follows: for growing firms, it was 47.9%, 49.3% and 37.9% for short-term leverage, long-term leverage and total leverage, respectively; for mature firms, it was 31.3%, 35.5% and 17.5% for short-term leverage, long-term leverage and total leverage, respectively; and for declining firms, it was 20.8%, 22.2% and 15.1% for short-term leverage, long-term leverage and total leverage, respectively.
Similar to Ahsan et al. (2016), but with a generalized method of moments model, Rehman et al. (2016) investigate how firms adjust their leverage policy across the firm’s life cycle but they use a sample of 867 listed Chinese non-financial firms over the period from 1996 to 2014. For the effect, they followed Anthony and Ramesh (1992) and Ahsan et al. (2016), and categorized firms into three categories (growth, maturity and decline) and employed a dynamic panel data model to estimate adjustment rates in these three life stages. In addition, they also examined various multilevel determinants of leverage. The study finds a low-high-low pattern of leverage ratio across growth, maturity and decline stages for the Chinese firms, which enabled the conclusion that leverage policy is in accordance with the Trade-Off Theory. Moreover, the leverage adjustment rates vary for different life stages, as follows: for growing firms, it was 90.5%, 75.0% and 59.4% for short-term leverage, long-term leverage and total leverage, respectively; for mature firms, it was 78.0%, 43.5% and 28.6% for short-term leverage, long-term leverage and total leverage, respectively; and for declining firms, it was 64.0%, 54.1% and 26.8% for short-term leverage, long-short-term leverage and total leverage, respectively.
13
3. Hypotheses Development
Based on the theories and empirical evidences of previous studies, this chapter introduces our research hypotheses on firm leverage across its life cycle stages.
(i) Pecking Order Theory
According to recent studies (e.g. Ahsan et al., 2016; Rehman et al., 2016), in their earlier stages, firms have higher information asymmetry and lower profitability. In addition, growing firms usually improve their information gathering capability, but as their investment needs increase they do not retain or retain less earnings and they even raise more debt to face such needs. Regarding maturity stages, firms tend to have more retained earnings due to their lower investment needs and so they raise less debt than in growth stages. Consequently, mature companies tend to prefer equity financing and are also characterized to have less information asymmetry. As for decline stages, firms’ profits decrease as the retained earnings, which leads to bigger motives to raise debt again.
Also Frielinghaus et al. (2005) and Teixeira and Santos (2006) observed that the Pecking Order Theory explains how firms tend to adopt specific financing strategies as they progress along their lives. The changes in the adverse selection costs and information asymmetry in the Pecking Order offer signs of a high-low-high general pattern in firms’ leverage.
Hence, the Pecking Order Theory suggests a high-low-high financing pattern, since debt is high in growth stages, then reduces at maturity and rises again in decline stages. Therefore we hypothesize:
Hypothesis 1 (H1): There is a high-low-high pattern of leverage during firms’ life stages.
(ii) Trade-Off Theory
Nevertheless, the static form of the Trade-Off Theory postulates that a firm defines an optimal level of leverage based on a trade-off between the associated benefits and the cost with alternative financing (in perfect markets). Nevertheless, the capital structure of a company is also influenced by other types of factors (endogenous and exogenous), which vary over time and certainly with the life stages of companies. Consequently, companies
14
adjust their capital structure by making their decisions dynamic (Fischer et al., 1989). Moreover, regardless of the life stage in which they are, in order to benefit from larger tax advantages, companies are attracted to borrow higher debt. But with certain limits, since if firms increase its debt too much, it increases bankruptcy and financial distress risk. Therefore, companies feel the need to balance between tax benefits and costs of bankruptcy. Moreover, Ahsan et al. (2016) and Rehman et al. (2016), who concluded that that leverage policy in their studies is in accordance with trade-off theory, mentioned in their studies that it is expected that bankruptcy chances are higher in growth and decline stages than in mature ones, which leads companies to use less debt at these stages. Therefore, even knowing that higher debt would mean higher tax benefits, in these stages firms should raise less debt.
So, it can be concluded that Trade-Off Theory suggests a low-high-low financing pattern as validated by Frielinghaus et al. (2005) and Teixeira and Santos (2006), since the use of debt is low in growth stages, then increases in maturity stages and reduces again in decline stages. Therefore we hypothesize:
Hypothesis 2 (H2): There is a low-high-low pattern of leverage during firms’ life stages.
(iii) Agency Cost Theory
According to Ahsan et al. (2016) and Rehman et al. (2016), it is in the growth stage that firms will face more investment opportunities, which will create a greater willingness on the part of managers to consume the available cash flows, however, at this life stage, companies have fewer free cash flows, which leads them to raise more debt. Then, at maturity stages, firms have higher free cash flows, but less investment opportunities and so firms raise less debt. Finally, when firms are in decline, they raise debt because it acts as a control mechanism. In this regard, Agency Cost Theory suggests a high-low-high financing patterns. Therefore we hypothesize:
Hypothesis 3 (H3): There is a high-low-high pattern of leverage during firms’ life stages.
15
(iv) Diamond’s Theory
In agreement with Ahsan et al. (2016) and Rehman et al. (2016), we assume that firm’s reputation can generate a low-high-high financing patterns, since the use of debt is low in growth stages and is high in maturity and in decline stages.
In fact, the findings of the Diamond (1989) conclude that reputation varies along firms’ life stages, which helps to realize that their financing decisions also vary accordingly. Naturally, firms in growth stages have less history or past record and so have low reputation, meaning a lower credit capacity and information asymmetry and consequent lower debt attractiveness. As for maturity and decline stages, firms already have a solid history and so a lower information asymmetry, consistent with an increase in reputation in these stages. Therefore, mature and declining companies as they have higher reputation raise more debt. Therefore we hypothesize:
Hypothesis 4 (H4): There is a low-high-high pattern of leverage during firms’ life stages.
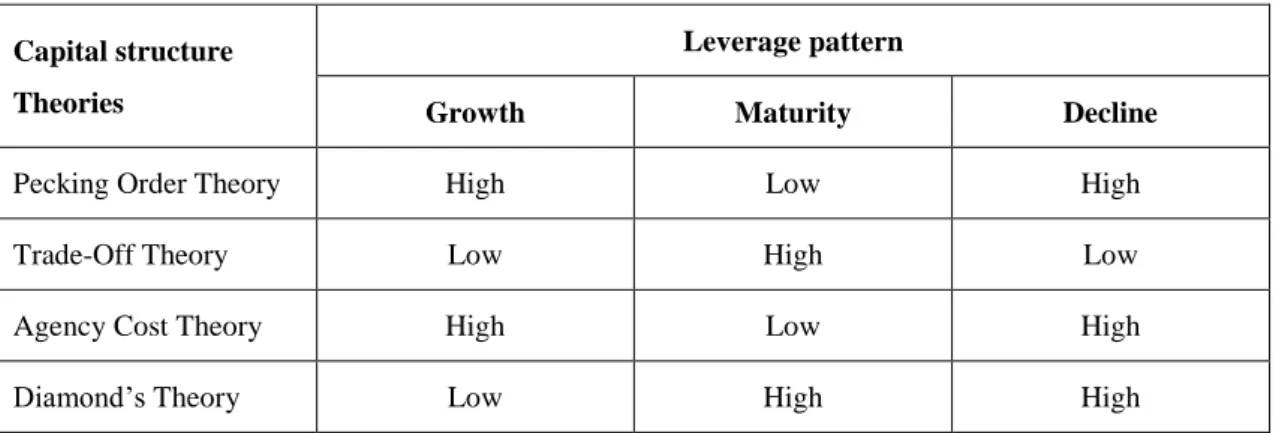
Table 1: Leverage pattern across firm’s life cycle as suggested by capital structure
Capital structure Theories
Leverage pattern
Growth Maturity Decline
Pecking Order Theory High Low High
Trade-Off Theory Low High Low
Agency Cost Theory High Low High
Diamond’s Theory Low High High
Source: Ahsan et al. (2016) and Rehman et al. (2016)
The table above, based on the previous hypotheses, summarizes the inputs of each theory when approaching the relationship between capital structure and life cycle stages.
It should be yet noted that we exclude the Market Timing Theory, which was mentioned but not hypothesized in the studies of Ahsan et al. (2016) and Rehman et al. (2016), since it did not have its relationship with leverage defined in the table nor any hypothesis associated.
16
4. Data Description
For the empirical analysis we choose a sample of firms listed in the Euronext Lisbon and in the Madrid Stock Exchange. From this initial sample, we excluded i) financial firms, due to their balance sheet being affected by specific factors, such as industry rules and regulatory laws, ii) firms whose financial year is different from the civil year, in accordance with a recent study applied for a portuguese sample (Borges, 2016). In addition, we decided to exclude also companies that did not have financial information regarding the three life cycle classification variables for a minimum consecutive period of 3 years, because of reasons of consistency in the sample.
Initially, when the batch of companies was withdrawn from Thomson Reuters Eikon, we had 168 companies. After these adjustments, the sample is a panel of 117 firms over the period of 2001 to 2016. All data were taken from Thomson Reuters Eikon (database chosen for containing information at market value).
Next, we proceed by describing the methodology used to classify the firms in their life cycle stages. After that, we present the dependent and independent variables and their descriptive statistics.
4.1. Classification of firms in different life cycle stages
Regarding the classification of firms into life stages, we follow the multivariate methodology developed by Anthony and Ramesh (1992), which was also used in the studies of Ahsan et al. (2016) and Rehman et al. (2016). As mentioned, this methodology divides firms into three life stages which are growth, maturity and decline.
We choose a multivariate method, in accordance with Anthony and Ramesh (1992), over the univariate approach due to its higher reliability and given that its analysis avoid firm size effects, risk differences and measurement errors. In addition, there are various studies employing a multivariate procedure (Jenkins et al., 2004; Teixeira and Santos, 2006; Ahsan et al., 2016; Rehman et al., 2016).
The main variables used in this research method are the dividend payout ratio (dividend paid/net profit before tax), sales growth (firm’s annual percentage change in revenues) and age (natural logarithm of number of years since a firm first traded).
17
The classification itself started by calculating the firms’ dividend payout ratios and sales growth for each year, and then we measured the median values of these variables based on prior five years data.
Consequently, and describing the methodology applied, after calculating the 5-year median values of the variables abovementioned, we made three columns: age, 5-year median values of sales growth and 5-year median values of dividend payout ratio. Then, we made three thirds for the three variables.
After that, we classified firms according to a criteria based on three life cycle stages, as presented in the table below.
Table 2: Life cycle variables and classification method
Life cycle stages Dividend payout (DP) Sales growth (SG) Age (AGE)
Growth Low High Young
Mature Medium Medium Adult
Decline High Low Old
Source: Rehman et al. (2016) and Ahsan et al. (2016)
As showed: i) growing firms are characterized by lower dividend payout ratios, a high growth in sales and young age; ii) mature firms tend to increase their payout ratio and sales growth, as also age; and iii) declining firms present the highest payout ratios, become even more older, but reduce their growth in sales.
Afterwards, each firm-year observation is allocated to a group and scored (growth=1; mature=2; decline=3). Subsequently, the scores given for all three variables are summed, which means that the minimum value is 3 and the maximum is 9. In accordance with the sums, we classify the summed up scores according to the following thresholds:
Firms in a growth stage: those which have a composite score lesser than or equal to 4 (first two intervals).
Firms in a maturity stage: those which have a composite score between 5 and 7 (middle three intervals).
Firms in a decline stage: those which have a composite score greater than or equal to 8 (last two intervals).
18 variables.
Table 3: Descriptive statistics of firm’s classification variables
Variable Obs Mean Median Maximum Minimum Std. Dev.
Panel A: Growth Median DP 235 0.047 0.027 0.302 -0.656 0.146 Median SG 235 -0.035 0.016 0.093 -1.875 0.185 Age 235 0.708 0.845 1.146 0.000 0.386 Panel B: Maturity Median DP 1029 0.221 0.238 5.878 -66.857 2.140 Median SG 1029 0.058 0.055 0.974 -3.391 0.199 Age 1029 0.995 1.146 1.415 0.000 0.396 Panel C: Decline Median DP 124 0.304 0.272 1.327 0.131 0.161 Median SG 124 0.146 0.140 0.305 0.095 0.043 Age 124 1.214 1.230 1.362 0.903 0.105
Note: Median DP is the median value of annual dividend paid over net profit before tax based on prior five-year data.
Median SG is the median value of percentage change in annual sales based on prior five-year data; Age is natural logarithm of number of years since a firm is listed.
The above table presents the descriptive statistics of the three variables used to classify firms into growth, mature and decline stages. It should be noted that the calculation of median values for dividend payout ratio and sales growth based on five years’ prior data, reduced our total number of firm-year observations from 1872 to 1388. As a result, Table 3 indicates that we have 235 firm-year observations for the growth stage; 1029 firm-year observations for the maturity stage and 124 firm-year observations for the decline stage.
4.2. Dependent Variable
The purpose of this research is to study the effects of firms’ life cycle stages on their capital structure, thus the dependent variable will be the capital structure, or leverage. Its measurement is in accordance with financial leverage following the methodologies used in the empirical studies of Ahsan et al. (2016) and Rehman et al. (2016). Therefore, three proxies of leverage will be used, as follows:
Short-Term Leverage (SL) which is the ratio of short-term loan to total assets; Long-Term Leverage (LT) that is the ratio of long-term loan to total assets; and Total Leverage (TL) meaning the ratio of total liabilities to total assets.
19
4.3. Independent Variables
Following very recent empirical studies (Ahsan et al., 2016; Rehman et al., 2016), we selected our explanatory variables and we shall now describe their proxies and relationship to capital structure. In addition, we will also describe their relationship to the leverage’s adjustment rate.
Table 4: Summary table of control variables, their proxies and proposed relationship
with leverage
Variable Notation Measurement
Relationship with leverage Relationship with adjustment rate Firm level
Tax shield TS Ratio of debt paid
and gross profit + +
Bankruptcy risk ZS Altman’s z score +/- +
Business risk BR Annual change in
net profit +/- +/- Non-debt tax shield NDTS Ratio of depreciation to total assets - ?
Agency costs AgC Ratio of operating
expense over sales + ?
Growth GROW Annual change in
total assets +/- +
Current
profitability CP
Net profit scaled
by total assets +/- +
Past profitability PP Retained earnings
ratio +/- + Liquidity LIQ Ratio of current assets to current liabilities +/- + Tangibility TAN
Ratio of net fixed assets to total assets
+ ?
Collateral value CV
Ratio of gross fixed assets at cost to total assets
+ ?
Firm size SIZE Natural logarithm
of firm’s assets +/- +
Industry level
Industry leverage ILEV Mean of industry
leverage + + Industry profitability IP Mean of industry profit ? ? Country
level Inflation rate INF
Annual inflation rate based on consumer prices
20
Variable Notation Measurement
Relationship with leverage Relationship with adjustment rate Exchange rate ER Yearly exchange rate of eur to us dollar ? +
Economic growth EG Annual per capita
GDP rate +/- +/- Capital formation CF Ratio of gross capital formation to GDP ? ?
Life cycle stages
Growth = 1; Mature = 2; Decline = 3
It should be noted that in those studies it was showed that, based on Raian and Zingales (1995), Booth et al. (2001), and Jõeveer (2013) there are three categories of factors that clarify target leverage, which are firm, industry and macroeconomic factors. Also, these factors can also clarify adjustment rates toward target capital structure (Drobetza and Wanzenried, 2006; Tongkong, 2012; Getzmann et al., 2014). Our study will take into account this type of factors, on the basis of which managers of a firm set their target capital structure.
21
4.4. Descriptive Statistics
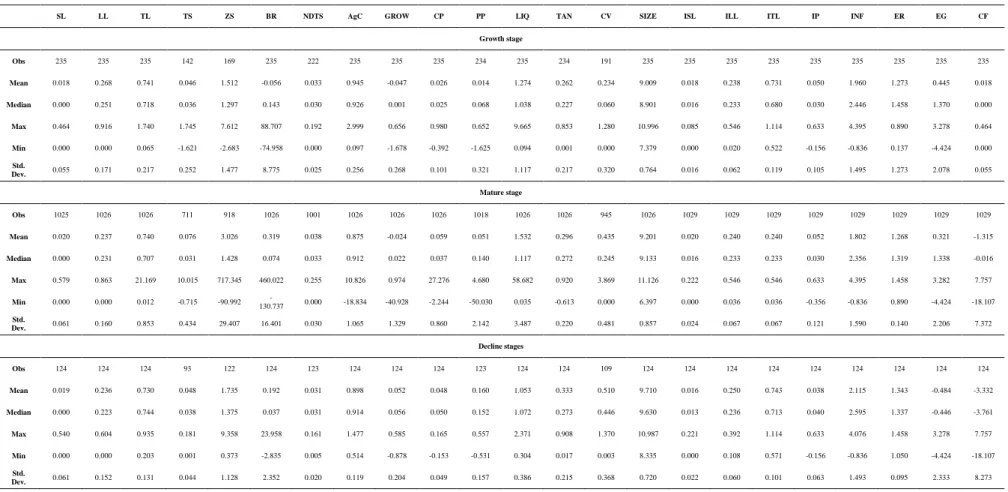
Table 5: Descriptive Statistics of dependent and independent variables in the three life cycle stages
SL LL TL TS ZS BR NDTS AgC GROW CP PP LIQ TAN CV SIZE ISL ILL ITL IP INF ER EG CF Growth stage Obs 235 235 235 142 169 235 222 235 235 235 234 235 234 191 235 235 235 235 235 235 235 235 235 Mean 0.018 0.268 0.741 0.046 1.512 -0.056 0.033 0.945 -0.047 0.026 0.014 1.274 0.262 0.234 9.009 0.018 0.238 0.731 0.050 1.960 1.273 0.445 0.018 Median 0.000 0.251 0.718 0.036 1.297 0.143 0.030 0.926 0.001 0.025 0.068 1.038 0.227 0.060 8.901 0.016 0.233 0.680 0.030 2.446 1.458 1.370 0.000 Max 0.464 0.916 1.740 1.745 7.612 88.707 0.192 2.999 0.656 0.980 0.652 9.665 0.853 1.280 10.996 0.085 0.546 1.114 0.633 4.395 0.890 3.278 0.464 Min 0.000 0.000 0.065 -1.621 -2.683 -74.958 0.000 0.097 -1.678 -0.392 -1.625 0.094 0.001 0.000 7.379 0.000 0.020 0.522 -0.156 -0.836 0.137 -4.424 0.000 Std. Dev. 0.055 0.171 0.217 0.252 1.477 8.775 0.025 0.256 0.268 0.101 0.321 1.117 0.217 0.320 0.764 0.016 0.062 0.119 0.105 1.495 1.273 2.078 0.055 Mature stage Obs 1025 1026 1026 711 918 1026 1001 1026 1026 1026 1018 1026 1026 945 1026 1029 1029 1029 1029 1029 1029 1029 1029 Mean 0.020 0.237 0.740 0.076 3.026 0.319 0.038 0.875 -0.024 0.059 0.051 1.532 0.296 0.435 9.201 0.020 0.240 0.240 0.052 1.802 1.268 0.321 -1.315 Median 0.000 0.231 0.707 0.031 1.428 0.074 0.033 0.912 0.022 0.037 0.140 1.117 0.272 0.245 9.133 0.016 0.233 0.233 0.030 2.356 1.319 1.338 -0.016 Max 0.579 0.863 21.169 10.015 717.345 460.022 0.255 10.826 0.974 27.276 4.680 58.682 0.920 3.869 11.126 0.222 0.546 0.546 0.633 4.395 1.458 3.282 7.757 Min 0.000 0.000 0.012 -0.715 -90.992 -130.737 0.000 -18.834 -40.928 -2.244 -50.030 0.035 -0.613 0.000 6.397 0.000 0.036 0.036 -0.356 -0.836 0.890 -4.424 -18.107 Std. Dev. 0.061 0.160 0.853 0.434 29.407 16.401 0.030 1.065 1.329 0.860 2.142 3.487 0.220 0.481 0.857 0.024 0.067 0.067 0.121 1.590 0.140 2.206 7.372 Decline stages Obs 124 124 124 93 122 124 123 124 124 124 123 124 124 109 124 124 124 124 124 124 124 124 124 Mean 0.019 0.236 0.730 0.048 1.735 0.192 0.031 0.898 0.052 0.048 0.160 1.053 0.333 0.510 9.710 0.016 0.250 0.743 0.038 2.115 1.343 -0.484 -3.332 Median 0.000 0.223 0.744 0.038 1.375 0.037 0.031 0.914 0.056 0.050 0.152 1.072 0.273 0.446 9.630 0.013 0.236 0.713 0.040 2.595 1.337 -0.446 -3.761 Max 0.540 0.604 0.935 0.181 9.358 23.958 0.161 1.477 0.585 0.165 0.557 2.371 0.908 1.370 10.987 0.221 0.392 1.114 0.633 4.076 1.458 3.278 7.757 Min 0.000 0.000 0.203 0.001 0.373 -2.835 0.005 0.514 -0.878 -0.153 -0.531 0.304 0.017 0.003 8.335 0.000 0.108 0.571 -0.156 -0.836 1.050 -4.424 -18.107 Std. Dev. 0.061 0.152 0.131 0.044 1.128 2.352 0.020 0.119 0.204 0.049 0.157 0.386 0.215 0.368 0.720 0.022 0.060 0.101 0.063 1.493 0.095 2.333 8.273
Note: The above table presents the descriptive statistics of dependent and independent variables used in this study during growth, mature and decline stages. ISLj,t is the mean industry short-term
22
Table 5 shows the summary statistics we computed for the variables used in our analysis. The mean values of SL and LL enable us to conclude that Portuguese companies opt for long-term leverage rather than short-term leverage. TL has the highest mean variable out of the three variables and it have its highest value in growth stage. It is also noted that on what concerns LL and TL, as companies evolve from life stage they tend to decrease their leverage, with the exception of SL.
The mean value for SL is 0.018 during growth, 0.020 during maturity and 0.019 during decline stage, which means a low-high-low pattern of total leverage (TL), being in line with the Trade-Off Theory of capital structure, confirmiming the hypothesis 2.
The mean value for LL is 0.268 during growth, 0.237 during maturity and 0.236 during decline stage, which means a high-low-low pattern of total leverage (TL), which does not correspond to any theory of capital structure, rejecting all of our hypothesis.
The mean value for TL is 0.741 during growth, 0.740 during maturity and 0.730 during decline stage, which means a high-low-low pattern of total leverage (TL), which does not correspond to any theory of capital structure, rejecting all of our hypothesis.
The mean values of PP, TAN, CV, SIZE increase along the three phases. The mean value for AgC is higher during growth stage (0.945). In the opposite direction, GROW present its highest mean value in the decline stages (0.052). As for the variables TS, ZS, BR, NDTS, LIQ and CP, their mean value presents a low-high-low pattern, which is in line with the Trade-Off Theory of the capital structure.
The ISL means (0.018 during the growth stage, 0.020 during the mature stage and 0.016 during the decline stage) and the ILL ones (0.238 during the growth stage, 0.240 during the mature stage and 0.250 during the decline stage) also suggest that Portuguese firms rely heavily on long-term debt throughout their life cycles as their main financing way indicate. The ITL means (0.731 during the growth stage, 0.240 during the mature stage and 0.743 during the decline stage) suggest a low-high-low pattern consistent with the Pecking Order Theory and with Agency Cost Theory.
The variables INF and ER appear to influence the leverage negatively, since when they reach the highest values (decline stages), leverage reaches the lowest. In the opposite direction are the variables EG and CF that present higher values in the growth stage, similar to leverage.
23
5. Empirical model
The objective of our study is to analyze the effects of capital structure determinants’ across three life cycle stages and to find out the variations in the leverage adjustment rate during those life-cycle stages. Accordingly, we used a sample of 117 Iberian non-financial listed firms in the 2001-2016 period using panel data methodology.
According to Wooldridge (2015), the panel data method is used when data has cross-sectional and time series dimensions, thus, when it can be observed that the behaviour of individuals vary across time. One of the great advantages of this method is that panel datasets allow not only for the observation of the variables’ behaviour over time, but also for the control of omitted variables.
Nevertheless, there are various methods dealing with panel data and the most used are Pooled OLS, the Fixed Effects and the Random Effects Models. We will test each one and decide on which is the most suitable to apply in our model.
Our baseline model to determine leverage ratios (short-term leverage, long-term leverage and total leverage) explained by its determinants, was based on recent similar studies (Ahsan, 2016; Rehman et al., 2016), as follows:
𝐿𝐸𝑉𝑖,𝑡= 𝛽0+ 𝛽1𝑇𝑆𝑖,𝑡+ 𝛽2𝑍𝑆𝑖,𝑡+ 𝛽3𝐵𝑅𝑖,𝑡+ 𝛽4𝑁𝐷𝑇𝑆𝑖,𝑡+ 𝛽5𝐴𝑔𝐶𝑖,𝑡+ 𝛽6𝐺𝑅𝑂𝑊𝑖,𝑡+ 𝛽7𝐶𝑃𝑖,𝑡
+ 𝛽8𝑃𝑃𝑖,𝑡+ 𝛽9𝐿𝐼𝑄𝑖,𝑡+ 𝛽10𝑇𝐴𝑁𝑖,𝑡+𝛽11𝐶𝑉𝑖,𝑡+ 𝛽12𝑆𝐼𝑍𝐸𝑖,𝑡+ 𝛽13𝐼𝐿𝐸𝑉𝑖,𝑡 + 𝛽14𝐼𝑃𝑖,𝑡+ 𝛽15𝐼𝑁𝐹𝑖,𝑡+ 𝛽16𝐸𝑅𝑖,𝑡+ 𝛽17𝐸𝐺𝑡 + 𝛽18𝐶𝐹𝑖,𝑡
+ 𝜇𝑖,𝑡 (5.1) Where LEV is one of the three measures of leverage (i.e. short-term leverage - SLi,t -,
long-term leverage – LLi,t - and total leverage - TLi,t) - for the ith firm at time t, 𝛽0 is
constant term. Furthermore, TSi,t is the ratio of tax payments over gross profit; ZSi,t is
Altman’s Z-score. BRi,t represents business risk of a firm i at time t. NDTSi,t is non-debt
tax shield of a firm i at time t. AgCi,t represents agency costs of a firm i at time t. GROWi,t
is the annual growth rate of a firm i at time t. CPi,t represents current profit of a firm i at
time t while PPi,t is past profits of a firm i at time t. LIQi,t represents liquidity of a firm i
at time t. TANi,t represents the tangibility ratio of a firm i at time t. CVi,t is the ratio of
fixed assets at cost over total assets SIZEi,t is the firm i’s size at time t. ILEV𝑖,𝑡 is one of
the three measures of industry leverage (i.e. industry short-term leverage - ISLi,t -,
24
at time t. IPj,t is the industry mean profit of an industry j at time t. INFt represents inflation
rate at time t. ERt is exchange rate at time t. EGt represents economic growth at time t.
CFt is capital formation ratio to total GDP at time t. 𝜇it is the error component for ith firm
at time t.
Based on the references of Fischer et al. (1989) and Myers (1984), Tian et al. (2015), Rehman et al. (2016), Ahsan et al. (2016) suggested that firms continuously strive toward their dynamic optimal target leverage, but at the same time, adjustment costs deviate the firms away from their target leverage and slow down their adjustment rates. Consequently, firms may adjust their actual leverage partially toward the target leverage. As so, if these costs were absent, firms would adjust their capital structure immediately, but if they are infinitely no adjustment would be noted (Brunaldi et al., 2015). Therefore, in order to estimate the rate of adjustment of leverage, we applied another equation: 𝐿𝐸𝑉𝑖,𝑡− 𝐿𝐸𝑉𝑖,𝑡−1= 𝛾(𝐿𝐸𝑉𝑖,𝑡∗ − 𝐿𝐸𝑉
𝑖,𝑡−1) (5.2)
What is the same as:
𝐿𝐸𝑉𝑖,𝑡 = (1 − 𝛾)𝐿𝐸𝑉𝑖,𝑡−1+ 𝛾𝐿𝐸𝑉𝑖,𝑡∗ (5.3)
where 𝐿𝐸𝑉𝑖,𝑡∗ is the target leverage, If 𝛾 = 1; means full adjustment has been achieved by
the firm within one accounting period.
It is important to mention that 𝐿𝐸𝑉𝑖,𝑡∗ is a vector variable (one that is not observed but whose value is calculated from other variables). Accordingly, we assume that managers of a firm set their target capital structure a year before, which leads 𝐿𝐸𝑉𝑖,𝑡∗ to be measured by one year lag of determinants of capital structure (mentioned in the first equation above).
The leverage adjustment rate depends on the adjustment cost, which itself depends on the determinants of the target capital structure of a firm. Thus, by replacing this rationale in equation 5.1, we get the following equation:
𝐿𝐸𝑉𝑖,𝑡 = 𝛽0𝛾 + (1 − 𝛾)𝐿𝐸𝑉𝑖,𝑡−1+ 𝛾𝛽1𝑇𝑆𝑖,𝑡−1+ 𝛾𝛽2𝑍𝑆𝑖,𝑡−1+ 𝛾𝛽3𝐵𝑅𝑖,𝑡−1+ 𝛾𝛽4𝑁𝐷𝑇𝑆𝑖,𝑡−1 + 𝛾𝛽5𝐴𝑔𝐶𝑖,𝑡−1+ 𝛾𝛽6𝐺𝑅𝑂𝑊𝑖,𝑡−1+ 𝛾𝛽7𝐶𝑃𝑖,𝑡−1+ 𝛾𝛽8𝑃𝑃𝑖,𝑡−1+ 𝛾𝛽9𝐿𝐼𝑄𝑖,𝑡−1 + 𝛾𝛽10𝑇𝐴𝑁𝑖,𝑡−1+ 𝛾𝛽11𝐶𝑉𝑖,𝑡−1+ 𝛾𝛽12𝑆𝐼𝑍𝐸𝑖,𝑡−1+ 𝛾𝛽13𝐼𝐿𝐸𝑉𝑖,𝑡−1
+ 𝛾𝛽14𝐼𝑃𝑖,𝑡−1+ 𝛾𝛽15𝐼𝑁𝐹𝑖,𝑡−1+ 𝛾𝛽16𝐸𝑅𝑖,𝑡−1+ 𝛾𝛽17𝐸𝐺𝑡−1 + 𝛾𝛽18𝐶𝐹𝑖,𝑡−1 + 𝜇𝑖,𝑡
25
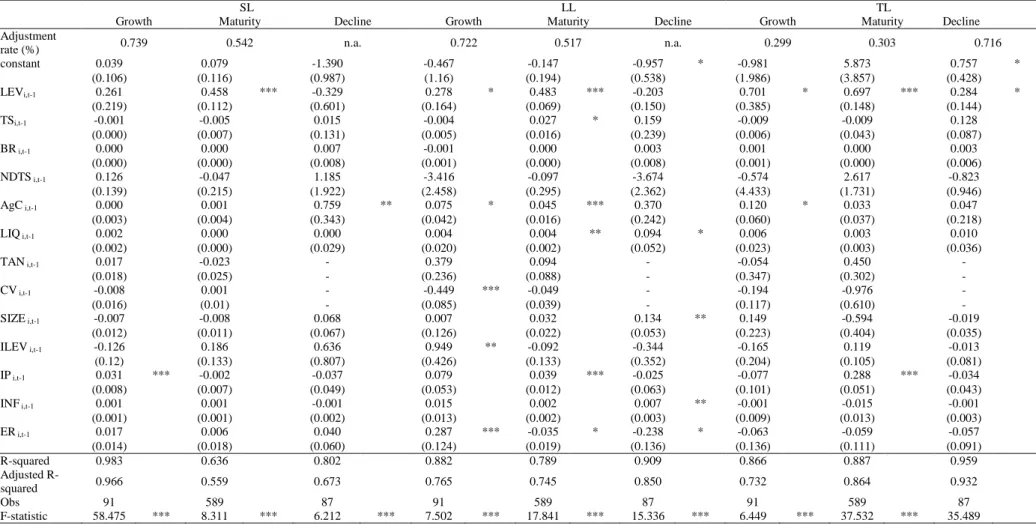
Where 𝛾 is a partial adjustment parameter; (1 – 𝛾) is the adjustment rate. Hence, 1 - coefficient of LEVi,t-1 is the leverage adjustment rate.
Moreover, in order to determine the adjustment rate during different life-cycle stages, and as advised by Ahsan, we created a categorical value (growth=1; maturity=2; decline=3) and estimated equation 5.4 across the three firm life cycle stages.
This last equation is the one we use to test our econometric model and our hypotheses (described in chapter 3) to be applied in the section 5.2 considering the leverage adjustment rate and the firm life cycle stages.
To estimate the leverage adjustment rate, Getzmann et al. (2014) and Rehman et al. (2016) used GMM’s method. However, we followed Ahsan et al. (2016) and, hence, we estimated equation 5.4, using a Fixed Effects Model.
26
5.1. Correlation matrix and VIF test
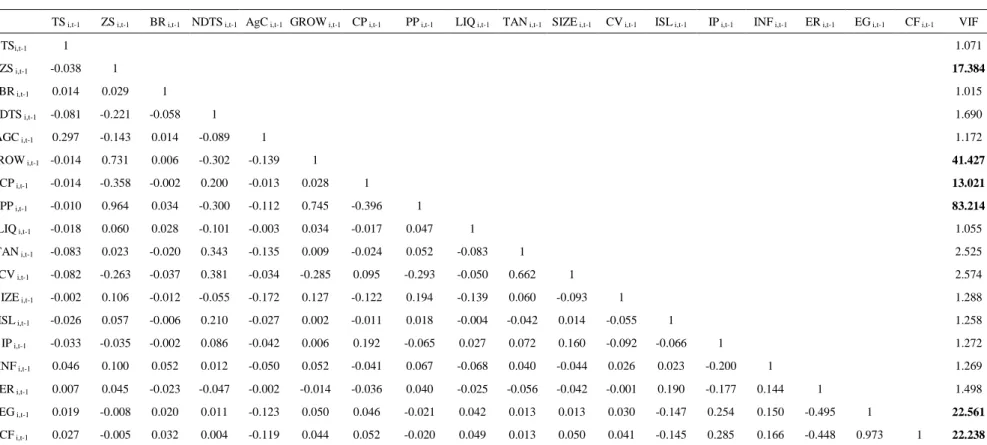
Table 6: Correlation matrix and VIF test for short-term leverage
TS i,t-1 ZS i,t-1 BR i,t-1 NDTS i,t-1 AgC i,t-1 GROW i,t-1 CP i,t-1 PP i,t-1 LIQ i,t-1 TAN i,t-1 SIZE i,t-1 CV i,t-1 ISL i,t-1 IP i,t-1 INF i,t-1 ER i,t-1 EG i,t-1 CF i,t-1 VIF
TSi,t-1 1 1.071 ZS i,t-1 -0.038 1 17.384 BR i,t-1 0.014 0.029 1 1.015 NDTS i,t-1 -0.081 -0.221 -0.058 1 1.690 AGC i,t-1 0.297 -0.143 0.014 -0.089 1 1.172 GROW i,t-1 -0.014 0.731 0.006 -0.302 -0.139 1 41.427 CP i,t-1 -0.014 -0.358 -0.002 0.200 -0.013 0.028 1 13.021 PP i,t-1 -0.010 0.964 0.034 -0.300 -0.112 0.745 -0.396 1 83.214 LIQ i,t-1 -0.018 0.060 0.028 -0.101 -0.003 0.034 -0.017 0.047 1 1.055 TAN i,t-1 -0.083 0.023 -0.020 0.343 -0.135 0.009 -0.024 0.052 -0.083 1 2.525 CV i,t-1 -0.082 -0.263 -0.037 0.381 -0.034 -0.285 0.095 -0.293 -0.050 0.662 1 2.574 SIZE i,t-1 -0.002 0.106 -0.012 -0.055 -0.172 0.127 -0.122 0.194 -0.139 0.060 -0.093 1 1.288 ISL i,t-1 -0.026 0.057 -0.006 0.210 -0.027 0.002 -0.011 0.018 -0.004 -0.042 0.014 -0.055 1 1.258 IP i,t-1 -0.033 -0.035 -0.002 0.086 -0.042 0.006 0.192 -0.065 0.027 0.072 0.160 -0.092 -0.066 1 1.272 INF i,t-1 0.046 0.100 0.052 0.012 -0.050 0.052 -0.041 0.067 -0.068 0.040 -0.044 0.026 0.023 -0.200 1 1.269 ER i,t-1 0.007 0.045 -0.023 -0.047 -0.002 -0.014 -0.036 0.040 -0.025 -0.056 -0.042 -0.001 0.190 -0.177 0.144 1 1.498 EG i,t-1 0.019 -0.008 0.020 0.011 -0.123 0.050 0.046 -0.021 0.042 0.013 0.013 0.030 -0.147 0.254 0.150 -0.495 1 22.561 CF i,t-1 0.027 -0.005 0.032 0.004 -0.119 0.044 0.052 -0.020 0.049 0.013 0.050 0.041 -0.145 0.285 0.166 -0.448 0.973 1 22.238
27
Table 7: Correlation matrix and VIF test for long-term leverage
TS i,t-1 ZS i,t-1 BR i,t-1 NDTS i,t-1 AgC i,t-1 GROW i,t-1 CP i,t-1 PP i,t-1 LIQ i,t-1 TAN i,t-1 SIZE i,t-1 CV i,t-1 ISL i,t-1 IP i,t-1 INF i,t-1 ER i,t-1 EG i,t-1 CF i,t-1 VIF
TSi,t-1 1 1.074 ZS i,t-1 -0.038 1 18.536 BR i,t-1 0.014 0.029 1 1.016 NDTS i,t-1 -0.081 -0.221 -0.058 1 1.569 AGC i,t-1 0.297 -0.143 0.014 -0.089 1 1.182 GROW i,t-1 -0.014 0.731 0.006 -0.302 -0.139 1 41.968 CP i,t-1 -0.014 -0.358 -0.002 0.200 -0.013 0.028 1 13.252 PP i,t-1 -0.010 0.964 0.034 -0.300 -0.112 0.745 -0.396 1 83.072 LIQ i,t-1 -0.018 0.060 0.028 -0.101 -0.003 0.034 -0.017 0.047 1 1.082 TAN i,t-1 -0.083 0.023 -0.020 0.343 -0.135 0.009 -0.024 0.052 -0.083 1 2.561 CV i,t-1 -0.082 -0.263 -0.037 0.381 -0.034 -0.285 0.095 -0.293 -0.050 0.662 1 2.594 SIZE i,t-1 -0.002 0.106 -0.012 -0.055 -0.172 0.127 -0.122 0.194 -0.139 0.060 -0.093 1 1.420 ISL i,t-1 0.067 -0.071 -0.054 -0.060 0.023 -0.015 -0.022 -0.012 0.115 -0.085 -0.109 0.138 1 1.345 IP i,t-1 -0.033 -0.035 -0.002 0.086 -0.042 0.006 0.192 -0.065 0.027 0.072 0.160 -0.092 -0.131 1 1.281 INF i,t-1 0.046 0.100 0.052 0.012 -0.050 0.052 -0.041 0.067 -0.068 0.040 -0.044 0.026 -0.160 -0.200 1 1.298 ER i,t-1 0.007 0.045 -0.023 -0.047 -0.002 -0.014 -0.036 0.040 -0.025 -0.056 -0.042 -0.001 0.134 -0.177 0.144 1 1.485 EG i,t-1 0.019 -0.008 0.020 0.011 -0.123 0.050 0.046 -0.021 0.042 0.013 0.013 0.030 -0.155 0.254 0.150 -0.495 1 22.543 CF i,t-1 0.027 -0.005 0.032 0.004 -0.119 0.044 0.052 -0.020 0.049 0.013 0.050 0.041 -0.167 0.285 0.166 -0.448 0.973 1 22.171
28
Table 8: Correlation matrix and VIF test for total leverage
Correlation TS i,t-1 ZS i,t-1 BR i,t-1 NDTS i,t-1 AgC i,t-1 GROW i,t-1 CP i,t-1 PP i,t-1 LIQ i,t-1 TAN i,t-1 SIZE i,t-1 CV i,t-1 ISL i,t-1 IP i,t-1 INF i,t-1 ER i,t-1 EG i,t-1 CF i,t-1 VIF
TSi,t-1 1 1.073 ZS i,t-1 -0.038 1 20.778 BR i,t-1 0.014 0.029 1 1.022 NDTS i,t-1 -0.081 -0.221 -0.058 1 1.583 AgC i,t-1 0.297 -0.143 0.014 -0.089 1 1.178 GROW i,t-1 -0.014 0.731 0.006 -0.302 -0.139 1 41.544 CP i,t-1 -0.014 -0.358 -0.002 0.200 -0.013 0.028 1 13.287 PP i,t-1 -0.010 0.964 0.034 -0.300 -0.112 0.745 -0.396 1 136.600 LIQ i,t-1 -0.018 0.060 0.028 -0.101 -0.003 0.034 -0.017 0.047 1 1.064 TAN i,t-1 -0.083 0.023 -0.020 0.343 -0.135 0.009 -0.024 0.052 -0.083 1 2.535 CV i,t-1 -0.082 -0.263 -0.037 0.381 -0.034 -0.285 0.095 -0.293 -0.050 0.662 1 2.562 SIZE i,t-1 -0.002 0.106 -0.012 -0.055 -0.172 0.127 -0.122 0.194 -0.139 0.060 -0.093 1 1.386 ISL i,t-1 0.072 -0.185 -0.042 -0.161 0.154 -0.132 0.026 -0.146 0.033 -0.168 -0.024 0.028 1 1.259 IP i,t-1 -0.033 -0.035 -0.002 0.086 -0.042 0.006 0.192 -0.065 0.027 0.072 0.160 -0.092 0.156 1 1.293 INF i,t-1 0.046 0.100 0.052 0.012 -0.050 0.052 -0.041 0.067 -0.068 0.040 -0.044 0.026 -0.296 -0.200 1 1.337 ER i,t-1 0.007 0.045 -0.023 -0.047 -0.002 -0.014 -0.036 0.040 -0.025 -0.056 -0.042 -0.001 -0.079 -0.177 0.144 1 1.465 EG i,t-1 0.019 -0.008 0.020 0.011 -0.123 0.050 0.046 -0.021 0.042 0.013 0.013 0.030 -0.003 0.254 0.150 -0.495 1 22.616 CF i,t-1 0.027 -0.005 0.032 0.004 -0.119 0.044 0.052 -0.020 0.049 0.013 0.050 0.041 0.012 0.285 0.166 -0.448 0.973 1 22.233