i
A NEURAL NETWORK BASED MODEL FOR MASS
NON-RESIDENTIAL REAL ESTATE PRICE
EVALUATION OF LISBON, PORTUGAL
Oleksandr Safronov
Dissertation presented as partial requirement for obtaining
the Master’s degree in Statistics and Information
ii
A NEURAL NETWORK BASED MODEL FOR MASS
NON-RESIDENTIAL REAL ESTATE PRICE
EVALUATION OF LISBON, PORTUGAL
Oleksandr Safronov
Dissertation presented as partial requirement for obtaining
the Master’s degree in Statistics and Information
i
A NEURAL NETWORK BASED MODEL FOR MASS NON-RESIDENTIAL REAL ESTATE PRICE EVALUATION OF LISBON
Subtitle: Oleksandr Safronov
MEGI
201 7 201 7A NEURAL NETWORK BASED MODEL FOR MASS NON-RESIDENTIAL REAL ESTATE PRICE EVALUATION OF LISBON
Oleksandr Safronov
2
NOVA Information Management School
Instituto Superior de Estatística e Gestão de Informação
Universidade Nova de LisboaA NEURAL NETWORK BASED MODEL FOR MASS NON-RESIDENTIAL
REAL ESTATE PRICE EVALUATION OF LISBON, PORTUGAL
by
Oleksandr Safronov
Dissertation presented as partial requirement for obtaining the Master’s degree in Statistics and Information Management, with a specialization in Risk Analysis and Management
Advisor / Co Advisor: Roberto Henriques, PhD
3
ABSTRACT
An accurate estimation of the real estate value became very important to make correct purchase and sale transaction, calculate taxes, mortgages for loans. Mass appraisal systems that use modern methodology based on artificial intelligence significantly help to deal with these issues. Objectives of this article are: using artificial neural networks (AANs) build mass appraisal model to evaluate market price of non-residential real estate of Lisbon, Portugal; evaluate performance of AANs and compare it with results generated by other models based on different methodologies and prove AANs superiority in issues connected with real estate apprising.
KEYWORDS
4
INDEX
1.
Introduction ... 6
2.
Literature review ... 9
2.1.
The concept of real estate ... 9
2.1.1.
Value types ... 10
2.1.2.
Method of commercial real estate price evaluation ... 10
2.2.
Basic concepts and characteristics of artificial neural networks ... 11
2.2.1.
Artificial neural network functioning ... 15
2.2.2.
Multilayer perceptron ... 17
2.2.3.
Multilayer perceptron training ... 19
2.3.
Features of real estate price evaluation using neural networks ... 21
3.
Methodology ... 23
3.1.
Data ... 23
3.2.
Model design and test ... 27
4.
Conclusions ... 31
5
LIST OF FIGURES
Figure 1 - Biological neuron... 12
Figure 2 - Schematic diagram of the artificial neuron ... 13
Figure 3 - Artificial neuron with activation function ... 13
Figure 4 - Structural diagram of an artificial neuron ... 15
Figure 5 - Activation functions ... 16
Figure 6 - Single-layer perceptron ... 17
Figure 7 - Multilayer neural network ... 18
Figure 8 - Back propagation method ... 19
Figure 9 - Local minimum ... 20
Figure 10 - Visual representation of variable AD ... 25
Figure 11 - Worth of chosen variables ... 27
Figure 12 - Model termination ... 28
Figure 13 - Model build based on train data ... 29
6
LIST OF TABLES
Table 1 - Use of AI method in real estate price evaluation ... 21
Table 2 - Summary statistics of interval variables ... 23
Table 3 - Property conditions levels ... 26
Table 4 - List of rejected variables... 27
Table 5 - Statistical result of ANN with 6 hidden layers ... 29
Table 6 - Error results of chosen model ... 30
7
1. INTRODUCTION
The non-residential real estate market is very large part of national economies (Tavares, 2014). Tools for the apprising of real estate became significant for segment operators such as sellers, buyers, insurance companies, banks, etc. (Morano, Tajani, Torre, & Orabona, 2014). Even so, there are no any studies directed on estimation of non-residential real estate value of Lisbon, Portugal. Nowadays, for apprising property, in the presence of quality data, automated models of mass appraisal are mostly used (Boži, 2013). Methods of mass real estate appraisal that incorporated different mathematical and statistical techniques, have been designing since 1970s (Federal Land Cadastre Service of Russia, 2001). Definition of mass real estate appraisal can be explained as a process of property valuation for a given specified date with relevant statistical data analysis (Boži, 2013). In process of mass non-residential real estate price evaluation for increasing of results accuracy - new statistical analysis methods are searched and applied (Wilkowski & Tomasz, 2006). Models for real estate apprising have been studied since 1950s, and were based on classical, usual linear models (Contenido, Producci, & Mart, 2013). After introduction of Artificial Neural Networks (AANs) an opportunity occurred to avoid any specifications of a functional form relating the environmental variables to the real estate price. ANNs helped to avoid some of the econometrical issues connected with linear functions, also taking into account nonlinearity of causal relations. Neural networks are methods that can become significant alternative for the commonly used method of multiple regression. AANs performs more realistic prices of real estate compared to classical hedonic prices, this more complex methodology allows, even with simple neural network topologies, obtain more stable parameters estimates and as a consequence to obtain more truthful market prices of real estate (Contenido, 2013).
Neural networks concept was developed in a result of artificial intelligence researches. This modelling methodology is very delicate and allows projecting highly leveled complexity functions. In areas where such solutions concerning prediction models, clustering or control has to be found – AANs can be easily applied. Usage of such networks for real estate apprising were started in 1990s (Wilkowski & Tomasz, 2006).
Non-residential real estate market is misrepresented by different economic factors, also a fall of transactions is limiting size of good quality data available. The demand for property apprising, as it was mentioned before, comes from different parties and neural networks are able to satisfy requirements of measuring and detection of price changes (Contenido, 2013). AANs is methodology that offers one of the most powerful tools for any tasks connected with data processing in area of real estate apprising (Chiarazzo, 2014). AANs methodology was created to take functional forms that helps to uncover non-linear relationships between variables that were hidden, it can function on limited data and properly estimate values in a short term (Morano, 2014). This methodology, developed in the past years, shows distinguished performance (Chiarazzo, 2014). It has become popular method, applied for prices forecast and for market segmentation in recent years (Lai, 2011). In comparison with other models, multiple regression analysis for example, one of the most popular model for real estate apprising (Boži, 2013), AANs performs much more better because of AANs nonlinear performance and ability to estimate such subjective information as zone characteristics, transport system characteristics, etc. (Lai, 2011). Also neural networks outperformed multiple
8 regression models in situation when data set size is large, AANs models, in most situations, with increasing of sample size overcome misspecification functional form, while multiple regression is independent of sample size increasing (Peterson & Flanagan, 2009).
The main goal of this work is to define a model based on artificial neural networks to valuate non-residential real estate price of Lisbon, Portugal. Concretely, the objectives of this study are:
- Collection and creation dataset of Lisbon`s non-residential real estate - Identify variables for market pricing in commercial real estate area - Build a model of mass commercial real estate price evaluation
- Comparison of results performed by models based on AANs to models based on logistic regression
To obtain this objectives sample of 701 records was collected. Observations were manually collected from specialized commercial real estate websites. Information that was taken corresponds to the concept of market real estate price formation.
After finishing data collection, predictive method of the non-residential real estate price was chosen. With a large number of factors that influence price, neural networks were chosen as the modeling method. Results that were obtained with final prediction model, that is using neural network model with 6 hidden layers, were quite accurate for mass-valuation models (mean absolute percentage error is equal to 13.38%).
Paper structure consist of next parts:
- Introduction, with description of key problems, advantages of chosen method and brief review of data and conclusions
- Literature review, with description of real estate concepts, price forming factors, basic characteristics of AANs and features of real estate price evaluating using AANs
- Methodology, with description of data used in modeling, interpretation of used variables, model design and testing
9
2. LITERATURE REVIEW
2.1. T
HE CONCEPT OF REAL ESTATEBefore defining what real estate appraisal is, it is necessary to dwell on the concept of "real estate". Real estate - is a type of property, recognized as objects that cannot be moved without causing incommensurate damage to their purpose, or not move at all: land for various purposes, subsoil, unfinished construction sites, buildings, structures, and so on (IVSC, 2017).
Taking into account existence fact of a huge number real estate transactions (purchase and sale, lease, exchange) the real estate market in modern conditions of evaluation activity of real estate facilities is very urgent.
The market valuation of real estate guarantees a reliable information on the property price, because this type of activity includes the integration of all necessary in such a delicate matter of nuances, such as its location, infrastructure development, the state of the real estate at the moment, the building wears a percentage of its architectural value, accessibility, etc. (IVSC, 2017).
The usage of models for mass real estate appraisal, in turn, greatly speed up the evaluation process, minimizes human made errors and increases the accuracy of the results.
It is necessary to do evaluation for different types of real estate value (market, investment, mortgage, insurance and other) in such cases:
- Operations connected with purchase, sale or leasing - Redistribution of property shares
- Insurance operations
- In cases of real estate liquidation
- Other different transactions connected with real estate property rights
Special place in the system of social relations is occupied by commercial real estate. Activity of people in all shares of business or management is inextricably linked with functioning of real estate. Price evaluation of property becomes more and more effective instrument of a market economy. Estimation of the value of any property is an ordered and purposeful process that takes in account potential and real income at certain point in the time with considering situation on a particular segment of the market (Glascock, 2007).
Market based nature is a typical feature of real estate evaluation. This means that it is necessary to take into account different market factors, economic characteristics of the estimated object. Market value of commercial real estate is not constant - it changes in time influenced by numerous factors. For this reason, it can be determined at a given point in time. Periodic evaluation of real estate price is necessary condition for the functioning of a market economy.
Real estate forms one of the central link of the whole system of Portugal market relations. Real estate objects are not only important commodity that satisfies diverse personal needs of people, but also income generator (Pagourtzi, 2003).
Real estate is the basis of national wealth of the country and has massive numbers of owners. This emphasizes of topic relevance, since knowledge real estate price forming is extremely necessary for
10 successful entrepreneurial activity in various types of business. In broad sense, real estate as property includes a combination of rights, demands and obligations (IVSC, 2017).
2.1.1. Value types
Market value of commercial real estate is the most accurate price. Using it object (real estate) can be sold on open market with competitive environment, when parties of this transaction act reasonably, having all necessary information and magnitude of the transaction and price does not reflect any extraordinary circumstances:
- Parties of the transaction are aware about subject of the transaction and act in their own interests
- Evaluated real estate is submitted to the open market in the form of a public offer - Payment for the object is expressed in cash
Market value of real estate is also called as the cost in exchange and reflects the value of the property for a particular owner. The concept of market value is based on the fact that typical buyer has opportunity to choose alternative option (real estate).
Value in use reflects the value of the property for a particular owner, which is not going to sell it. The estimation of this type of value is based on the current use, financial and economic parameters that were observed and forecasted.
Investment value is similar to the concept of "value in use." This is the value of the property for a particular investor who is going to buy real estate. The calculation of investment value is based on the income expected by the investor. The investment value is usually calculated in case of investment project or an object that generates income.
Restoration value (or cost of reproduction) is determined by the costs in current prices for the construction of an exact copy of real estate using the same architectural solutions, building structures and materials, and with the same quality of construction and installation works.
Replacement value is determined by the current prices costs for the construction of an object that has an estimated equivalent utility but built with using new architectural style, modern design standards.
Liquidation value is net cash flow that an owner of real estate can receive in case real estate liquidation (IVSC, 2017).
2.1.2. Method of commercial real estate price evaluation
There are three main estimation methods (IVSC, 2017): method of comparative analysis of sales, cost method, the method income capitalization.
The method of comparative sales analysis (CSA) is used when there are real sales on the market with real prices and it is possible to compare similar sales and get the values of the real estate. The method is based on a comparison of the proposed for sale object with market analogs. The method
11 of comparing sales is applied when there is a sufficient amount of reliable market information about transactions similar to the estimated.
The sources of information in case of using this method can be electronic databases, real estate companies profiles, real estate brokers information, archives of credit institutions (mortgage banks), insurance companies information, data given by construction and investment companies, etc. Mandatory elements that should be included in process of CSA are: transferred property rights, terms of sale, time of sale, location, physical characteristics, economic characteristics, current use. Depending on the availability and reliability of market information determination of adjustments are based on quantitative and qualitative methods. The final decision on the magnitude of the result should be made on the basis of selling prices for comparison objects that have the greatest similarity with the evaluated real estate.
If there is a sufficient amount of reliable market information, methods of mathematical statistics can be used to determine the value.
The cost method is based on the investor's ability to buy real estate without paying for it a larger amount than it can cost him to get replaceable real estate property with same characteristics. The cost method shows an estimate of the total replacement cost of the object, less depreciation, increased by the market value of the land.
Main steps of this method are: calculation of the land cost; calculation the market value of the full replacement cost; determination amount of physical, functional and external deterioration of the facility; replacement cost reduction by the amount calculated deterioration; adding to the calculated replacement value of the real estate to the value of the land.
The method of income capitalization is based on the determination of the value of the real estate based on the present value of the expected income from its possession. This method converts the income of a property into an estimate of its value. The main methods of the income capitalization are: method of direct capitalization and method of cash flow discounting. The method of direct capitalization is used in cases where the projected annual net income is constant and does not have a clearly expressed tendency to change, and the period of its receipt is not limited in time. The method of discounting the cash flow (indirect capitalization) is applied in those cases when the projected cash flows from the use of real estate are not the same in magnitude and are variable during the selected forecast period (IVSC, 2017).
2.2. B
ASIC CONCEPTS AND CHARACTERISTICS OF ARTIFICIAL NEURAL NETWORKSRecently field of mathematics, which specializes in artificial neural networks, is rapidly developing in the world. The relevance of research is confirmed by the huge amount of fields, where ANNs are applied: processes of automated pattern recognition, adaptive control, predictions, expert systems, associative memory and many other applications. With the help of the AANs it is possible, for example, to predict the indicators of the exchange market or to perform recognition of optical or sound signals, or to create self-learning systems that are able to drive a car when.
12 Neural network technologies are complex of information technologies based on the use of artificial neural networks. Artificial neural networks are software or hardware implemented systems built on the principle of organization and functioning of their biological analogue - the human nervous system (Rodríguez, 2009).
According to neurobiology, the nervous system of man and animals consists of individual cells - neurons. Each cell performs relatively simple actions: the neuron is able to receive signals from other cells, and in turn, transmit the signal to other cells. The outgoing signal is formed only in the case of a special combination of incoming signals. Neuron can be represented as the simplest computational element: it converts incoming information into outgoing information. This transformation occurs in a relatively short time: the time of the neuron's operation is 2-5 ms (McCluskey, 1997).
Figure 1. Biological neuron
Figure 1 shows the structure of a pair of typical biological neurons. Dendrites go from the body of the cell body to other neurons, where they receive signals at the junction points called synapses. The input signals received by the synapse are brought to the neuron's body. Here they are summed up, with some inputs trying to excite a neuron, others - to prevent its excitation. When the total excitation in the body of the neuron exceeds a certain threshold, the neuron is excited by sending an axon signal to other neurons. This basic functional diagram has many complications and exceptions, nevertheless, most of the artificial neural networks simulate only these simple type of behavior (Worzala, 1995).
Neural networks are based on the idea that the functioning of a biological neuron can be modeled with relatively simple mathematical models. The depth and flexibility of human way of thinking and other important qualities of the nervous system are determined not by the complexity of the neurons, but by their large amount and the presence of complex system of connections between them. In the human brain, their number reaches 1010 - 1012, each of which is associated with 103 - 104
other neurons, which creates an exceptionally complex structure. This structure is not static: a human person is always in a process of education; information entering into brain, person acquires
13 experience and as a result becomes able to solve new problems. The accumulation of experience is expressed in a change in the "strength" of the neuronal connections (Reddick, 2007).
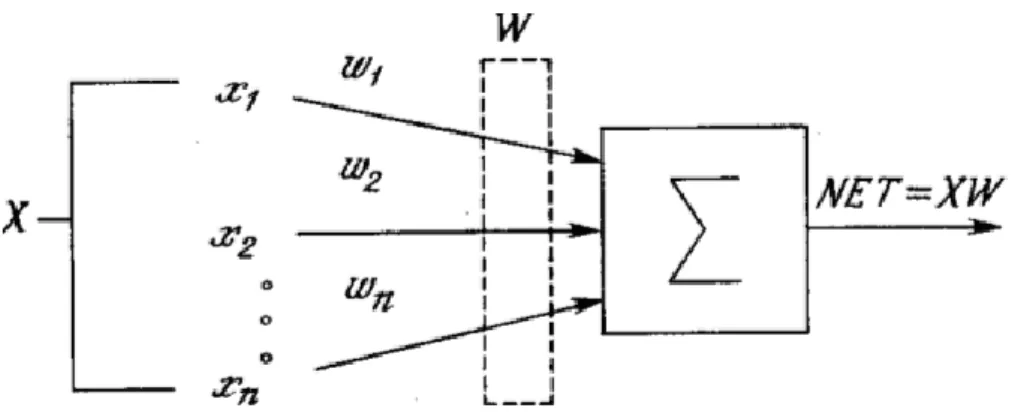
The schematic diagram of the artificial neuron can be found on Figure 2.
Figure 2. Schematic diagram of the artificial neuron (Denisov, 2013)
The artificial neural network imitates the properties of a biological neuron. The input of an artificial neuron receives a certain number of signals, each of them is the output of another neuron. Each input point is multiplied by the corresponding weight, similar to the synaptic force, and all products are summed, determining the activation of the neuron. Figure 2 shows model that realizes this idea. Although network paradigms are very diverse, almost all of them are based on this configuration. Set of input signals, denoted
x
1, x
2,..., x
n, goes to an artificial neuron. These input signals, denoted by the vector X, correspond to the signals arriving at the synapses of the biological neuron. Each signal is multiplied by the corresponding weightw
1, w
2,…, w
n, and goes to the summing block denoted by Σ. Each weight corresponds to the "strength" of one biological synaptic connection. The set of weights is denoted by the vector W. The summing block corresponding to the body of the biological element adds the weighted inputs, creating an output that is called NET. In vector notation this can be compactly written as: NET = XW (Borst, 1991).The NET signal is converted by the activation function F and gives the output neural signal OUT. The activation function can be an ordinary linear function
NET
K
OUT
,
where K is constant, a threshold function, or a function that more accurately simulates a nonlinear transfer characteristic of a biological neuron and gives neural network more great possibilities.
14 Block F receives the NET signal and outputs an OUT signal. If the block F narrows the range of the value of NET so that for any values of NET the OUT values belong to some finite interval, then F is called a (compressive) function. As a (compressive) function, a logistic or sigmoidal (S-shaped) function is often used. This function is mathematically expressed as:
x
e
x
F
1
1
)
(
.
1
1
NETe
OUT
Activation function can be considered a nonlinear amplification characteristic of an artificial neuron. The gain is calculated as the ratio of the increment of the value of OUT to the small increment of the NET that caused it. It is expressed by the slope of the curve at a certain level of excitation and varies from small values at large negative excitations (the curve is almost horizontal) to the maximum value at zero excitation and again decreases when the excitation becomes large positive.
This simple model of an artificial neural network ignores many properties of its biological counterpart. For example, it does not take into account the time delay, that affects the dynamics of the system. Input signals immediately generate an output signal, and, more importantly, it does not take into account the effects of the frequency modulation function or the synchronizing function of the biological neuron (Borst, 1991).
The neural networks derive their power, firstly, from the diversification of information processing and, secondly, from the ability to self-learn, i.e. create generalizations. The term generalization is understood as the ability to obtain an informed result based on data that was not encountered in the learning process. These properties allow neural networks to solve complex (large-scale) problems, which today are considered difficult to solve. Complex problem can be divided into a sequence of relatively simple ones, which can be solved with the help of AANs.
Some of neural networks advantages over traditional methods can be found below. 1. Solving problems with unknown regularities.
2. Resistance to noise in the input data. 3. Adaptation to environmental changes. 4. Potential ultra-high performance.
Neural network technologies can be used in many areas of human activity. It can be used in economics and business. Market predictions, automatic dealing, credit risk assessment, prediction of bankruptcies, valuation of real estate, identification of over-and undervalued companies, automatic rating, portfolio optimization, commodity and cash flow optimization, automatic checks and forms, security of transactions on plastic cards. In medicine, processing of medical images, monitoring of patients' condition, diagnostics, factor analysis of treatment effectiveness, cleaning of instrument readings from noise. In avionics by Trained autopilots, recognition of radar signals, adaptive piloting of heavily damaged aircraft. In Communication, compression of video information, fast
encoding-15 decoding, optimization of cellular networks and packet routing schemes. Associative information search, electronic secretaries and user network agents, information filtering in different systems, collaborative filtering, news feeding, targeted advertising, targeted marketing for e-commerce. In automation of production as optimization of production process modes, complex diagnostics of product quality (ultrasound, optics, gamma radiation), monitoring and visualization of multidimensional dispatch information, prevention of emergency situations, robotics. In political technologies - analysis and synthesis of sociological surveys, predicting the dynamics of ratings, identifying significant factors, objective clusterization of the electorate, visualization of the social dynamics of the population (Borst 1991).In Security and security systems as identification systems, voice recognition, persons in the crowd, car license recognition, aerospace image analysis, information flow monitoring, counterfeiting detection. In input and processing of information -processing of handwritten checks, recognition of signatures, fingerprints and voice. Entering financial and tax documents into your computer and in exploration as analysis of seismic data, associative methods of searching for minerals, evaluation of resource resources.
2.2.1. Artificial neural network functioning
Neural network models can be software and hardware based. Some types of AANs have several common features.
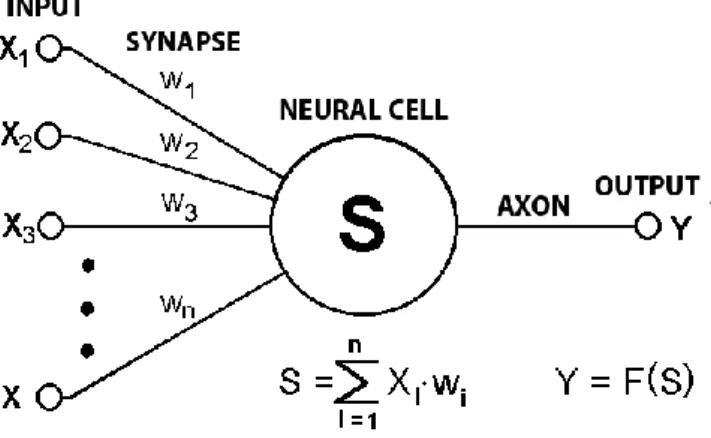
Figure 4. Structural diagram of an artificial neuron (Denisov, 2013)
First of all, the basis of each neural network is relatively simple, in most cases - the same type, elements (cells), simulating the work of brain neurons. Each neuron is characterized by its current state as the nerve cells of the brain, which can be excited or hindered. It has a group of synapses - unidirectional input connections connected to outputs of other neurons and axon-output connection of a given neuron. Each synapse is characterized by the magnitude of the synaptic connection or its weight
w
i, which is physically equivalent to electrical conductivity (Hagan, 1994).The current state of the neuron is defined as the weighted sum of its inputs:
n i i iw
x
s
1)
(s
f
y
16
Figure 5. Activation functions
A. Heaviside function B. Linear threshold
C. Sigmoid - hyperbolic tangent D. Sigmoid function
A non-linear function f is called an activation function and can have a different form, as shown in Figure5. One of the most common is a non-linear function, also called logistic function or a sigmoid (S-shaped function): x
e
x
f
1
1
)
(
As decreases, the sigmoid becomes more flat, at = 0 transform into a horizontal line, with increasing the sigmoid start to look like Heaviside function with threshold T at the point x = 0. Output value of the neuron lies in the range [0,1]. One of the valuable properties of the sigmoid function is a simple expression for its derivative
))
(
1
(
)
(
)
(
x
f
x
f
x
f
It should be mentioned that the sigmoid function is differentiable on the axis, which is used in some learning algorithms. In addition, it has the property of amplifying weak signals better than large ones, and prevents saturation from large signals, since they correspond to areas of arguments where the sigmoid has a gentle slope.
17
Figure 6. Single-layer perceptron (Denisov, 2013)
Artificial neural network structure choice is carried out in accordance with the features and complexity of the task. To solve some specific types of tasks, there are exist optimal configurations. If the task can not be reduced to any of the known types, complex problem of synthesizing a new configuration has to be solved. At the same time, it is guided by several fundamental principles: the possibilities of the network increase with the increase of the number of cells in the network, the density of connections between them and the number of allocated layers; the introduction of feedbacks, with the increase in the capacity of the network; complexity of the algorithms (Hagan, 1994).
Process of functioning of the AAN depends on the magnitude of the synoptic connections, having set a certain structure of the AAN corresponding to any task, optimal values of all variables of the weight coefficients should be found (some synoptic connections can be constant).
2.2.2. Multilayer perceptron
Multilayer perceptron(MP) is one of the most used neural networks. One of the main advantages of a multilayer perceptron is the ability to solve algorithmically unsolvable problems or problems for which an algorithmic solution is unknown, but for which it is possible to compose a representative set of examples with known solutions. During training, the neural network, due to its internal structure, reveals regularities of the input and output connection, "generalizes" the experience obtained in the training sample. This ability to generalize is the basis of the attractiveness of the multilayer perceptron. The researcher himself may not know what the relationship between input and output are, it is enough to have a large set of vectors where expected output is known. A multilayer perceptron can be successfully used to solve the following problems: forecasting of market behavior, speech recognition, image analysis, expert systems, etc.
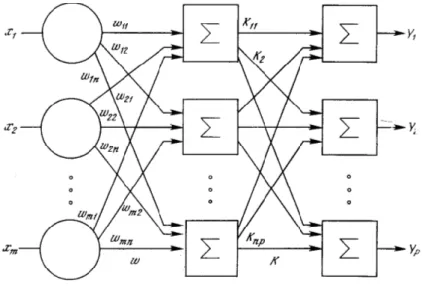
In this ANN, neurons are placed in successive groups, called layers. The input signal in such networks propagates in a forward direction, from layer to layer. A multilayer perceptron in the general representation consists of the following elements: set of input nodes that form the input layer; one or more hidden layers of computational neurons; one output layer of neurons.
18 Neurons in each layer are independent of each other, however, each of the neurons is connected by outgoing connections to each neuron of the next layer. Each of the output and hidden layer neurons receives input signals from the neurons of the previous layer (Figure7).
Figure 7. Multilayer neural network (Denisov, 2013)
The number of neurons in each layer can be any and does not depend on the number of neurons in the other layers. The number of neurons of the input layer is determined by the number of input factors of the problem, the output layer by the number of output factors. The number of hidden layers and the number of neurons in them can be different; it is usually chosen empirically so that the network is trained in the best possible way. Amount of hidden layers allows us to identify complex, nonlinear relationships between input and output factors. Determination of the number of intermediate layers and the number of elements in them is an important task multilayer perceptron. 1. Each network neuron has a nonlinear activation function.
It is important to emphasize that nonlinear function must be smooth. The most popular form of a function that meets this requirement is sigmoid. An example of a sigmoidal function is the logistic function given by the following formula.
,
)
exp(
1
1
aY
OUT
where
a
is the slope parameter of the sigmoid function. Changing this parameter, functions with different steepness can be built.The presence of nonlinearity has a very important role, otherwise the input-output mapping of the network can be reduced to a single-layer perceptron.
2. Several hidden layers.
MP contains one or more hidden layers of neurons that are not part of the input or output of the network. These neurons allow the network to learn how to solve complex problems, consistently extracting the most important signs from the input image.
19 3. High connectivity.
MP has a high connectivity, realized through synaptic connections. Changing the level of connectivity of the network requires changing the set of synaptic connections or their weighting factors.
The combination of all these properties along with the ability to learn from own experience provides the computing power of a multilayer perceptron. However, these same qualities are the reason for the incompleteness of modern knowledge about the behavior of such networks: the distributed form of nonlinearity and the high connectivity of the network make the theoretical analysis of the multilayer perceptron much more complicated (Hagan, 1994).
2.2.3. Multilayer perceptron training
The training of artificial neural networks is understood as the process of tuning the network architecture (the structure of connections between neurons) and the weights of synaptic connections to find the most effective solution of the given task. Usually, the training of a neural network is performed on a certain sample. As the learning process, which takes place according to some algorithm, the network should respond better and better to the input signals (Nguyen, 2001). There are three paradigms of learning: with the teacher, without the teacher (or self-study) and mixed. In the first method, the correct answers to each input example are known, and the weights are adjusted to minimize the error. Training without a teacher allows to distribute the samples into categories by disclosing the internal structure and nature of the data. Combined training combines the above two approaches.
Among the training algorithms with the teacher, the most successful algorithm is the back propagation, which was proposed for training the multi-layer network in 1986 by Rummelhart and Hinton. Its main idea is that the change in the weights of the synapses takes into account the local gradient of the error function. Each neuron is able to determine the contribution of each weight to the total network error. The simplest training rule corresponds to the method of steepest descent, changes in the synaptic weights are proportional to their contribution to the general error (Hagan, 1994).
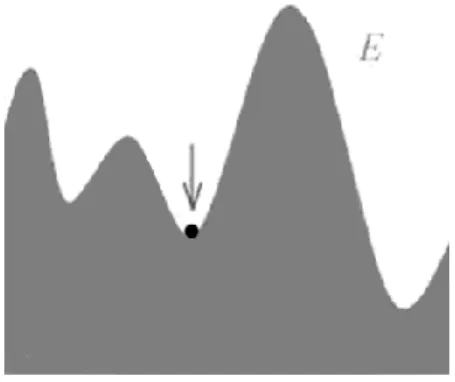
Figure 8. Back propagation method (Denisov, 2013)
With such training of the neural network, there is no certainty that it has trained in the best way, because there is always the possibility of the algorithm falling into the local minimum (Figure9). To
20 avoid this, different techniques are used to "knock out" the solution found from the local extremum. If after several actions the neural network converges to the same solution, then it can be concluded that the found solution is most likely optimal.
Weight coefficients correction:
,
) ( ) ( n ij n ijw
E
w
where
w
is the synaptic coupling coefficient, η is the network training speed coefficient, andЕ
is the total network error function.Figure 9. Local minimum
The main idea of back propagation is how to get an error estimate for the neurons of the hidden layers. The greater the value of the synaptic connection between the neuron of the hidden layer and the output neuron, the stronger the error of the first affects the error of the second. Error estimation of elements of hidden layers can be obtained as a weighted sum of errors of subsequent layers. During the training, the information extends from the lower layers of the hierarchy to the higher ones, and the error estimates made by the network are in the opposite direction, which is reflected in the name of the method.
The use of sigmoidal activation functions ensures correct training and functioning of the network. The learning process consists of the consistent presentation of a network of training pairs
, P 1, i (i)), * y (x(i),
where x(i) and y*(i) is the vector of the input and desired output signals of the network. To implement the back propagation algorithm:
1. Select the next training pairs from the given training set and signal x(i) to the input of the network. 2. Calculate the reaction of the network y(i).
3. Compare the obtained reaction y(i) with the required y*(i) and determine the error y*(i) - y(i).
21 4. Adjust the weights to minimize errors.
5. Repeat steps 1-4 for the entire set of training pairs until the error reaches the required value on the given set.
With the back pass, layer-by-layer correction of the weights is performed starting with the output layer. The back propagation algorithm is applicable to networks with any number of layers: both to direct propagation networks and to those containing back propagation (Haykin, 2003).
2.3. F
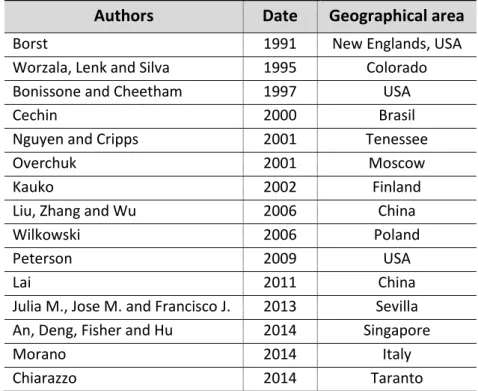
EATURES OF REAL ESTATE PRICE EVALUATION USING NEURAL NETWORKSNeural networks methods started to be applied to real estate prices more than two decades ago (Julia M., 2013). Some of the studies that were used as inspiration for development of a model for real estate price evaluation are shown in Table 1.
Authors
Date
Geographical area
Borst 1991 New Englands, USA
Worzala, Lenk and Silva 1995 Colorado
Bonissone and Cheetham 1997 USA
Cechin 2000 Brasil
Nguyen and Cripps 2001 Tenessee
Overchuk 2001 Moscow
Kauko 2002 Finland
Liu, Zhang and Wu 2006 China
Wilkowski 2006 Poland
Peterson 2009 USA
Lai 2011 China
Julia M., Jose M. and Francisco J. 2013 Sevilla
An, Deng, Fisher and Hu 2014 Singapore
Morano 2014 Italy
Chiarazzo 2014 Taranto
Table 1. Use of AI method in real estate price evaluation
The price of non-residential real estate depends on many factors, for example: surface area, location, condition, business environment, etc. Experienced realtors are able to deal with this task without any difficulty, applying their knowledge and intuition, relying on the analogues known to them. All these knowledge and skills can’t be easily formalized what makes this task extremely complex.
To solve this problem neural network was created, where the number of input neurons corresponds to the number of input factors that affect the price. In the output layer there will be only one neuron corresponding to the output factor - the price for 1 square meter.
The number of examples, that are used in training-validation stage, should be quite large - according to some calculations, 5-15 times more than the number of neurons in the network (Nguyen, 2001). Weights of connections is gradually changing to make actual output signal as close as possible to the expected value of the output factor. It usually takes several thousand training cycles to train a neural network, but on modern computers this training takes several minutes.
22 Training ends when the set value of the mean (or minimal) error is reached, when the network has exhausted the training opportunities or when a certain number of training cycles are passed. After this weights become fixed, and the network can be used in the operating mode. With specified parameters of the appraised commercial real estate as input signals of the network, the value at the output will represent its price, calculated based on revealed regularity. Not always a neural network achieves good training outcomes and generalizations. Possible reasons can be:
- architecture of the network was unsuccessfully chosen (too many or too few neurons in the hidden layers)
- there are not enough examples for training
- variables are chosen unsuccessfully: the number of input parameters does not include one or several factors that have the greatest effect on the value of the output indicators
- required dependence does not exist; training examples are unique, there is no connection between them
Neural networks are very effective in estimation problems, but unfortunately they are connected with two groups of problems that must be taken into account. First, unlike in other countries (for example, the United States, with the exception of a few states), Portugal does not have a system of mandatory public information disclosure about real estate transactions. Information based on transactions with real estate is extremely limited and not entirely reliable.
To solve this problem, several methods were applied, which significantly improved the quality of the data. Advertisements texts were analyzed to reveal every bit of information in them to maximize outcome. A set of decisive rules made it possible to exclude obviously absurd ads that were containing an implausible combination of signs. Boundary values allowed to cut off announcements with unreliable price information.
Secondly, the classic methods of mathematical modeling of economic processes works best when all the dependent factors are quantitative. In the problem of determining the price of a property is much more complicated. Most pricing factors are unordered (for example, the prestige of the area) or ordered categories (proximity to the road). An important role is played also by the location of the object - a geolocation factor, which is a non-trivial task. The simple use of geographic coordinates is not a solution to the problem (Liu, 2006).
23
3. METHODOLOGY
3.1. D
ATASample of 701 records, that are relevant on October 2017, were collected and studied. These observations were manually taken from websites that are specialized on ads for commercial real estate in Lisbon and close areas. List of websites that were used as source of data: keyro.com, olx.pt, portugalproperty.com, tranio.com, century21global.com, era.pt, remax.pt, imvirual.com, en.arkadia.com. In process of data collecting to avoid such a problem that the cost of some real estate was different on different sites, the minimal presented price was taken since it is corresponds to the concept of market real estate price formation.
In the process of collecting data it was found that big part of the real estate sale ads were not complete enough or had insufficient data that didn’t allow to include such data into data that was used in modeling phase. By my personal observation, the amount not valid data, on special websites oriented on real estate market, was 40-80% of all provided ads.
After finishing process of cleaning, data set was divided into two subsets – Training and Validation. The ration between them that was used is 2/3 of the data used as a training data and the other 1/3 of the data used as a validating data.
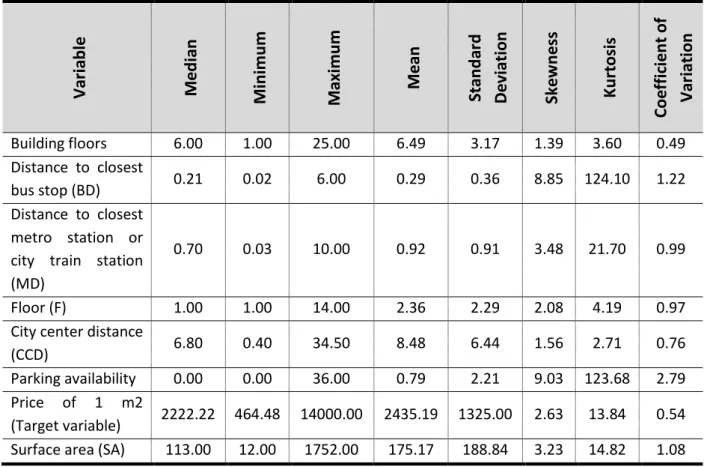
For each property variables were collected and coded into the dataset. Summary statistics of interval variables (Table 2) and information about them can be found below.
Va
ri
ab
le
M
e
d
ia
n
M
in
im
u
m
M
axi
m
u
m
M
e
an
Sta
n
d
ar
d
De
viati
on
Ske
w
n
e
ss
K
u
rt
os
is
Co
e
ff
ic
ie
n
t
of
Va
ri
ati
on
Building floors 6.00 1.00 25.00 6.49 3.17 1.39 3.60 0.49 Distance to closest bus stop (BD) 0.21 0.02 6.00 0.29 0.36 8.85 124.10 1.22 Distance to closest metro station or city train station (MD)0.70 0.03 10.00 0.92 0.91 3.48 21.70 0.99
Floor (F) 1.00 1.00 14.00 2.36 2.29 2.08 4.19 0.97
City center distance
(CCD) 6.80 0.40 34.50 8.48 6.44 1.56 2.71 0.76
Parking availability 0.00 0.00 36.00 0.79 2.21 9.03 123.68 2.79 Price of 1 m2
(Target variable) 2222.22 464.48 14000.00 2435.19 1325.00 2.63 13.84 0.54 Surface area (SA) 113.00 12.00 1752.00 175.17 188.84 3.23 14.82 1.08
24 For improving model performance variables were normalized through min-max normalizations, so they became in range from 0 to 1.
Detailed transcription of variables (interval and ordinal) that were used in final mode can be found below:
Level of business environment (LBE) has a major role in the price formation for commercial real
estate. The closer the object to the business areas, the higher the cost and the rental rate for 1 m2.
Commercial real estate located in areas that are designated for business has a number of advantages over commercial real estate located on quiet residential streets, such real estate represents the greatest value of the investors. Opportunity to get even small surface areas, but to have synergy with the environment always attracts those who are looking for a place for their offices / stores or other type of commercial real estate.
For real estate located in areas full of business centers or close to them, or surrounded by the same objects of commercial real estate with high business intensity, LBE got value of 3.
For real estate located in residential areas, areas that mainly consist of residential buildings and structures, percentage of commercial buildings is up to 30% or less of total amount, but with a high intensity of commercial real estate on the ground floors or for real estate located near the business areas, but out of sight from the main streets, value for LBE was taken equal to 2.
For the rest of the property, specifically for commercial real estate located in quiet residential quarters, with percentage of commercial buildings and structure less than 15% of total amount of buildings in this area, without any hint of business nearby, LBE got value of 1.
Level determination of commercial development of the area was done with the help of internet services, such as google maps.
Level of pedestrian traffic (LPT) has great importance in the price per square meter of commercial
real estate. Property located on the streets with an intensive pedestrian traffic, near the metro / bus stops has a great advantage, especially for trading, over real estate located in dead ends or far away from objects that creates this traffic.
For real estate located on streets with high pedestrian traffic, with bus stops, metro stations or social objects (malls, sights, football stadiums, interchange objects) located nearby, in less than 100 m distance, the value of LPT is equal to 3.
For real estate located on streets with middle-ranged intensively of traffic, with shops, bust/train stops, poplar social structures or any other objects that accumulate human mass located nearby, with distance range in 100-200 m, value is equal to 2.
For real estate located on residential areas streets with low pedestrian traffic, without any social areas that can attract people nearby (distance range is more than 200 m), value is equal to 1.
To calculate distances, intensity of pedestrian traffic and identify social structures or areas located nearby commercial real estate from ads such internet service as google maps was used.
25
Level of traffic (LT) of traffic affects the cost per square meter in such a way that the value of real
estate located on the city-forming highways or on the main streets with a large car traffic in both directions will always have an advantage over the objects located on the one-way sleeping quarters streets. For real estate located on streets with high intensively of traffic, which are always loaded with cars, value for LT was taken as 3.
For reals estate located on streets that are perpendicular to the city-forming highways, or on streets with a large machines traffic, but passing parallel to the main routes, value is equal to 2.
For real estate located on streets with low traffic, parallel to main streets, but are one-sided or on streets located in dead-end, value is equal to 1.
Intensity of traffic for each street was based on information gained through such internet services as google maps and google traffic.
City center distance (CCD) - distance in kilometers to reach the industrial center from the property
using the road network. Business owners prefer to have a property located as close to the city center as the best location in the city center allows both clients and employees to have the advantage of access to this object.
Area dispositional (AD) - location of the property in one of the eight areas selected to delineate the
real estate that has same distance to city center but has a different direction from the center of the Lisbon. The distribution of these areas with the numbers assigned to them is shown on figure 10.
Figure 10. Visual representation of variable AD
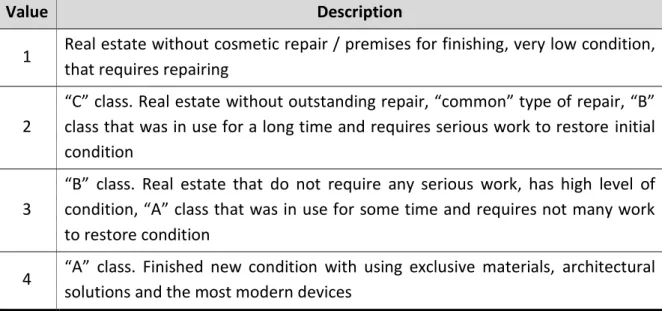
Condition of property (CP). Depending on the specifics of the business, commercial real estate may
differ in terms of planning, design and other criteria. Ideally, repairs and finishing should be done in such a way that it can be judged on the features of the company. Real estate condition should be combined with its class: a modest repair in a solid firm will say that management neglects the image, and the excessively pompous office of a small organization indicates a lack of taste or inability to submit oneself. Classification of the condition level can be found in the following table (Table 3):
26
Value
Description
1
Real estate without cosmetic repair / premises for finishing, very low condition,
that requires repairing
2
“C” class. Real estate without outstanding repair, “common” type of repair, “B”
class that was in use for a long time and requires serious work to restore initial
condition
3
“B” class. Real estate that do not require any serious work, has high level of
condition, “A” class that was in use for some time and requires not many work
to restore condition
4
“A” class. Finished new condition with using exclusive materials, architectural
solutions and the most modern devices
Table 3. Property conditions levels
Specialization of the building (BS) is a dummy variable taking a value of 1 if the building where the
property is located in office/shopping center.
Distance to closest metro station or city train station (MD) - distance in kilometers to closest metro
station or city train station. A few saved minutes a day can mean a lot for busy people. Sometimes the proximity to the metro can become a dominant factor in the decision to buy or rent commercial real estate. The metro/train station means that environment consists of developed infrastructure around, shops, entertainment, cafes and restaurants, various services, etc. Real estate in building near metro\train stations are always easier to sell.
Distance to closest bus stop (BD) - distance in kilometers to closest bus stop. This variable is very
similar to MD by its influence on commercial real estate price.
Surface area (SA) - Surface area of the property in square meters. Cost of real estate is calculated
based on the price of 1 m2 of the total area. After all, when selecting similar apartments it is difficult
to choose real estate with the same area. Therefore, the cost of 1 meter square is a common indicator. The dimensions of the auxiliary premises (corridor, hallway, balconies and loggias, bathroom, pantry and rooms for built-in wardrobes) - they may have little effect on the price, but can be a decisive factor for the buyer when choosing an real estate for business. The cost of real estate per square meter decreases with an increase of its surface area, this is due to the fact that the liquidity of large commercial real estate is much lower than liquidity for a small to medium offices\shops, that has high liquidity.
Floor (F) - floor where the property is located in the building. Location on the ground floor of the
building can be a significant advantage but also can be biggest disadvantage of the future business placed in it, same applies to last floors, not take this factor into account would be extremely unreasonable.
To identify the most important variable that were used in final model calculation of chosen variable worth was done using tool included in SAS Enterprise Miner version 14.1 (SAS 9.4), this method is
27 based on binning the input variable to identify their maximum logworth which is known as Variable Worth.
Results of input space reduction and variables that were used in final model can be found in histogram below (Figure 11).
Figure 11. Worth of chosen variables
It has to be mentioned that after process of data collecting and initiating analytical processes, some of the variables, that are not included in list above, were rejected. Brief description of those variables and main rejection reasons can be found in the next table (Table 4):
Variable
Description
Rejection reason
Building floors
Total number of building floors
Low worth
Condition of the
building
General physical condition of buildings
Low worth
Showcases
availability
Presence of large windows that can be used as
showcase windows
Low worth
Parking
availability
Presence and number of parking spaces
Lack of valid data
Structure
novelty
Disposition of the property in a new building
(build after 1985 year)
Lack of valid data
Table 4. List of rejected variables
3.2. M
ODEL DESIGN AND TESTThe studies were carried out based on neural network models with different architectures (different amount of hidden layers from 1 to 7) and the best networks were selected based on their
28 performance. The purpose of the experiments was to build a neural network prediction model with the lowest error on testing data. To achieve this goal impact of historical and forecasted data on the error were studied. The software that was used for tasks selected is SAS Enterprise Miner version 14.1 (SAS 9.4).
Process of best model construction consists of the following several stages:
1. Formation of the training and validate data sets. On this stage block of representative (training) samples was formed.
2. Training of the neural network using the block of training data formed at the first stage. The termination criterion was 50 iterations or significantly increasing of average squared error margin between training and validate data sets. Results of this stage can be found on next figure 12.
Figure 12. Model termination
3. The third stage is testing the neural network. Testing dataset was applied to generated model. Based on the results of the work done, the model chosen was the one that best described the current situation on the commercial real estate market and had smaller error among other models. To compare performance of different other models with AANs results, next criteria are used as usual: mean absolute error between actual and predicted values, sample`s hit ratio between the predated and selling value. Model with smaller mean absolute percentage errors suppose to be superlative. Mean absolute percentage errors (MAPE):
The best performance was demonstrated by the neural network model with 6 hidden layers. Statistical results of the model training process can be found in next table 5.
29
Label (Stat)
Train
Validate
Average Squared Error (ASE) 114525.28 128777.49 Maximum Absolute Error (MAX) 1191.86 995.38
Divisor for ASE (DIV) 288.00 148.00
Sum of Frequencies (NOBS) 288.00 148.00
Root Average Squared Error (RASE) 338.42 358.86 Sum of Case Weights Times Freq (SUMW) 288.00 148.00
Mean Squared Error (MSE) 190654.80 128777.49
Root Mean Squared Error (RMSE) 436.64 358.86 Average Error Function (AVERR) 114525.28 128777.49
Table 5. Statistical result of ANN with 6 hidden layers
Visual representation of this process can be found on following figures (Figure 13, 14).
Figure 13. Model build based on train data
30 On the stage of model testing dataset of 126 records was used. The model showed quite good results, which can be used in mass valuation of non-residential real estate evaluation of Lisbon, Portugal. Results with calculated RMSE can be found in next table (Table 6):
Data Set
MAPE
Train 11.64%
Validate 12.14%
Test 13.38%
Table 6. Error results of chosen model
Also, to compare the results obtained with the chosen model and results generated by other types of models, results generated by logistic regression, that performed best among other models, was taken into account. Mean absolute percentage error generated by this regression model that has next characteristics:
Label (Stat)
Train
Validate
Average Squared Error (ASE) 145584.81 141752.22 Maximum Absolute Error (MAX) 1682.27 1177.28
Divisor for ASE (DIV) 288.00 148.00
Sum of Frequencies (NOBS) 288.00 148.00
Root Average Squared Error (RASE) 381.56 376.50 Sum of Case Weights Times Freq (SUMW) 288.00 148.00
Mean Squared Error (MSE) 155290.46 141752.22
Root Mean Squared Error (RMSE) 394.07 376.50 Average Error Function (AVERR) 145584.81 141752.22
MAPE calculated based on test data 14.95% Table 7. Logistic regression statistic results
Higher error rate (MAPE) of regression model confirms superiority of chosen model (AAN with 6 hidden layers) in issues connected with evaluation of commercial real estate price of Lisbon, Portugal.
31
4. CONCLUSIONS
Artificial neural networks are most widely used in the area of predicting dynamic indicators, they are successfully used to solve entire classes of economic problems. Neural network technologies should not be considered as a universal solving solution of all intellectual problems. Their use is justified in areas with significant number of similar examples, reflecting hidden relationships.
Neural networks, unlike expert systems, are designed to solve poorly formalized problems. This type of modeling is used to recognize any events or objects. With their help, it is possible to reproduce multiple connections between a plurality of different objects.
In this work, it was considered to choose predictive method of the non-residential real estate price. Given the large number of pricing factors, their complex structure, as well as the non-linear relationship between prices and influencing factors, neural networks were chosen as the modeling method.
Objectives of this study were achieved through different approaches. Information about Lisbon’s non-residential real estate was collected and coded into the dataset, that was used in model building. Important variables were identified and included into model. After building model for commercial real estate price evaluation based on AANs its results was also compered to results received with using of logistical regression.
The main goal of this paper was achieved – non-residential real estate price evaluation model was build and it has quite accurate statistical characteristics. The mean absolute percentage error of the prediction for the model is 13.38% - is quite accurate for mass-valuation models. The constructed model allows to increase the efficiency of management of real estate complexes on the scale of a city or a large corporation and make this mechanism more transparent.
At the same time, there are a number of directions for improving the model:
1. This work does not include such parameter as trade discount because database was built based on ads from specialized websites and not on real sales transactions. Including and calculating potential discount on each transaction could significantly improve performance of the model, but to do this pair analysis of real transaction and ads of same real estate property has to be done.
2. Size of used dataset was far away from planned one. Using data collection program could improve and enhance the quality of collected data.
3. Contacting experts in are of real estate of Lisbon, Portugal could become very good improvement of variables quality. The aim of the work was not to study the history of the Lisbon construction, but the possession of such information gives an advantage in constructing the model.
32
5. BIBLIOGRAPHY
Allen, W. C., & Zumwalt, J. K. (1994). Neural networks: A word of caution (Unpublished working paper, Colorado State University).
An, X., Deng, Y., & Fisher, J. D. (2011). Commercial Real Estate Rental Index: A Dynamic Panel Data Midel Estimation*, (February), 1–41. http://doi.org/10.1111/1540-6229.12101
Bełej, M., & Kulesza, S. (2012). Modeling the Real Estate Prices in Olsztyn under Instability
Conditions. Folia Oeconomica Stetinensia, 11(1). http://doi.org/10.2478/v10031-012-0008-7 Boži, B. (2013). The use of multiple linear regression in property valuation Primena višestruke
regresije u proceni vrednosti nepokretnosti, 1(1), 41–45.
Chiarazzo, V. (2014). A neural network based model for real estate price estimation considering environmental quality of property location. Transportation Research Procedia, 3(July), 810–817. http://doi.org/10.1016/j.trpro.2014.10.067
Contenido, Producci, & Mart. (2013). Artificial Nellral Networks for Predicting Real Estate Prices. Cote, K. N. A., Smith, W. D., & Fullerton, T. M. (2011). MUNICIPAL NON-RESIDENTIAL REAL PROPERTY
VALUATION FORECAST ACCURACY, 6(1), 56–78.
Federal Land Cadastre Service of Russia. (2001). Land ( Real Estate ) Mass Valuation Systems for Taxation Purposes in Europe Produced and published by the Federal Land Cadastre Service of Russia on behalf of the UN ECE Working Party on Land Administration. Taxation, (November). Ghysels, E., Plazzi, A., Valkanov, R., & Torous, W. (2013). Forecasting real estate prices. Handbook of
Economic Forecasting, 2(919), 509–580. http://doi.org/10.1016/B978-0-444-53683-9.00009-8
Hillman, B. Y. K. (2015). Commercial Property Price Indices Methodology for Forecasting RCA, (August).
Lai, P. (2011). Analysis of the Mass Appraisal Model by Using Artificial Neural Network in Kaohsiung City. Journal of Modern Accounting and Auditing, 7(10), 1080–1089.
Morano, P., Tajani, F., Torre, C. M., & Orabona, V. (2014). Artificial intelligence in property valuations An application of artificial neural networks to housing appraisal, 23–29.
Peterson, S., & Flanagan, A. B. (2009). Neural Network Hedonic Pricing Models in Mass Real Estate Appraisal. Journal of Real Estate Research, 31(2), 147–165. Retrieved from
http://ares.metapress.com/index/M3H27210W6411373.pdf
Tavares. (2014). The Portuguese residential real estate market: An evaluation of the last decade.
Panoeconomicus, 61(6), 739–757. http://doi.org/10.2298/PAN1406739T
Wang, X., Wen, J., Zhang, Y., & Wang, Y. (2014). Real estate price forecasting based on SVM optimized by PSO. Optik, 125(3), 1439–1443. http://doi.org/10.1016/j.ijleo.2013.09.017 Wilkowski, W., & Tomasz, B. (2006). Artificial Neural Networks for Real Estate Valuation, 1–12.
33 Rodríguez, D.A., Mojica, C.H. (2009). Capitalization of BRT network expansions effects into prices of
non-expansion areas. Transportation Research Part A, 43, 560–571.
McCluskey, W. J., Dyson, K., McFall, D., & Anand, S. (1997). The mass appraisal of residential property in Northern Ireland. In W. J. McCluskey, & A. Adair (Eds.), Computer assisted mass appraisal systems (pp. 59-77). London: Gower Publishers.
Worzala, E., Lenk, M., & Silva, A. (1995) An exploration of neural networks and its application to real estate valuation. Journal of Real Estate Research, 10(2), 185-201.
Glascock, J.L., & Kelly, L.(2007).The relativeeffect of propertytype andcountry factors in reductionof risk of internationally diversified real estate portfolios. Journal of Real Estate Finance and Economics, 34(3), 369–384.
IVSC (2017), International valuation standards. https://www.ivsc.org/standards/international-valuation-standards/consultation/ivs-2017-agenda#tab-documents.
Reddick, C. G. (2004). An Empirical Examination of Revenue Forecasting Techniques in Local Governments.” Municipal Finance Journal, 24 (4): 25-48.
Haykin, S. (2003) Neural Networks: A Comprehensive Foundation, second edition, New Jersey: Prentice Hall.
Nguyen, N., Cripps A. (2001). Predicting Housing Value: A Comparison of Multiple Regression Analysis and Artificial Neural Networks. Journal of Real Estate Research, 22:3, 313-336.
Pagourtzi, Vassilis A., Thomas H., Nick F. (2003). “Real Estate Appraisal: A Review of Valuation Methods.” Journal of Property Investment & Finance, 21(4): 383-401.
Borst, R.A., (1991). Artificial Neural Networks: The Next Modeling/Calibration Technology for the Assessment Community? Property Tax Journal (International Association of Assessing Officers), 10(1), 69–94.
Hagan, M., Menhaj M., (1994). Training feed-forward networks with the Marquardt algorithm. IEEE Transactions on Neural Networks, 5(6), 989–993.
Liu, J., Zhang, X., and Wu, W. (2006): “Application of fuzzy neural network for real estate prediction”. LNCS, 3973, pp. 1187–1191.
Denisov D.V., (2013). Communication systems and networks. Moscow financial-industrial university "Synergy".
Julia M., Jose M. and Francisco J. (2013) Artificial neural networks for predicting real estate prices. Faculty of Economics, University of Cordoba (Spain)