Non Intrusive Load Identification with
Power and Impedance obtained from
Smart Meters
Diana Lucia Racines1, John Edwin Candelo2
1
Department of Electrical Engineering, Universidad del Norte, Km 5 Vía Puerto Col., Barranquilla – Colombia
1
dracines@uninorte.edu.co
2
Mines Faculty, Universidad Nacional de Colombia, Carrera 80 No 65-223, Medellín - Colombia
2
jecandelob@unal.edu.co
Abstract— Power networks modernization toward smart grids has encouraged the use of smart meters, opening opportunities for the development of new applications to improve energy efficiency of consumers, as nonintrusive load monitoring. This paper presents a nonintrusive load identification and characterization model with real power and impedance by using artificial neural network. The approach involved the use of real power and impedance measures obtained from an educational building to represent the consumption behaviour of loads and to identify the operation states. Transitions between operation states of devices are identified as events. Common operation states transitions were used to create a representative set of events to train the multilayer feed-forward neural network designed. Comparisons between the conventional power model and the proposed mixed power-impedance model were achieved and results showed that the proposed method was better to identify loads and characterize the consumption behaviour. This model has been proposed to detect load variation in real applications using smart meters.
Keyword- Energy efficiency, Load characterization, Neural networks, Nonintrusive load monitoring, Smart meter
I. INTRODUCTION
Loads of electricity end users are usually passive elements to the power grid, not allowing monitoring, control and better energy efficiency programs. Under the current trend of modernization of electrical networks to smart grids [1], end users are becoming active participants of the power networks. End users require necessary information to develop actions such as energy efficiency, energy management, among others [2].
The interest for developing applications to achieve active participation of demand has increased in recent years [2]–[5]. Consumption monitoring with smart meters allow performing energy efficiency and energy management at different points in the electrical installation [6].
The traditional load monitoring method uses electricity meters at different points of the electrical installation to measure all possible variables. Various drawbacks are present when applying this method such as the division of the load circuits, the cost of the electricity meters, the cost of installation, the available space for installing the hardware, among others.
The nonintrusive load monitoring method focus on using the user’s electricity meter [7], to identify the operation state of electrical devices, and the characteristics of the consumption and the load. This monitoring method has been applied for different type of installations, being most common for residential users. Nonintrusive load monitoring has become more important with the growing use of smart meters at electrical installations.
Nonintrusive load monitoring models can be obtained through different techniques and using various electrical parameters. Hardware is needed to detect some features of the loads and some algorithms must be program to identify the characteristics. These models can be calculated using the steady state features, transient features or the combination of both [8].
One of the first approximations held about the topic was developed at the MIT. Individual consumption of equipment was obtained based on the detailed analysis of the steady state current and voltage of the total load [9]. In this research, some load models, equipment signatures, algorithms and prototypes focused on monitoring residential buildings were presented.
Harmonic pattern recognition applied in commercial buildings was considered in [12]. The patterns were obtained from measures, considering odd harmonic currents. The harmonic patterns are introduced in a SVM and a RBFN to infer the operation state (on/off) of each electrical device connected downstream of the measurement point. Major research efforts have focused in load characteristics exploration rather than in the development of algorithms [13]. Due the high cost and long time required for the recollection of measures for this purpose, many researchers have begun to publish their data bases to facilitate the work of others researchers and promote the development of algorithms, as in [14]–[16].
This article shows the development of a model to determine the operation state changes of loads through a nonintrusive load monitoring performed by a neural network. Results of the developed model give opportunities to obtain the electrical consumption characterization of the installation. This method considers a load study and electrical variable measurement during a period to represent the model and to program the algorithm to monitor the behaviour of consumption and load. Steady state features were considered due the proposed model is intended to be applied using low cost user’s smart meters. Most of these devices do not have a high measurement rate that allows determining transient features. A device that nonintrusive identifies these characteristics is more expensive and is not commonly used to measure energy consumption of residential, commercial and industrial electrical installations.
II. LOAD STUDY
Residential, commercial or educational users commonly have loads with different behaviours. Connection and disconnection of equipment at different points of installation are achieved continually, which difficult load variation studying. However, similar loads are normally used for each building and those can be considered as typical loads.
A. General load identification method
The influence of load in the total energy consumption of an electrical installation can be studied by identifying the nominal power and characteristics of consume, the amount of the equipment, and the frequency of use. Load measurement gives important information as real power, reactive power, apparent power, power factor, current and voltage. Data can be used to identify the operational state, variation and identification of loads.
Fig. 1 shows the operational states of a load and the possible transitions between them, which are established according to the load behaviour. For example, lights have only two states, off and on, while computers have as additional the suspended state.
Fig. 1. States and transitions of a computer
Behaviour of the electrical parameters of each device is registered and analysed considering all possible states. For example, lights have a stable behaviour in time, while computers have a high variability when they are in on state, due to their internal composition and variable functionality.
B. Educational building load test
In educational buildings, loads such as computers, lights, communication racks, video beam, air conditioning and TVs are commonly found. Loads such as lights, computers and communication rack were identified to have the higher influence in total power consumption. These types of loads were identified as typical loads and a characterization were obtained for the nonintrusive load-monitoring model.
states was used. The operational states were determined by the number of active switches: all off; 2 off and 1 on; 1 off and 2 on; and all on. Two kinds of devices were found on the communication racks: Ethernet access switches (Catalyst 2960) and integrated services routers (Cisco 1841 and Cisco 1941). The measurements made to these equipment showed that the power consumption remained relatively stable in time.
III.MODEL DEFINITION
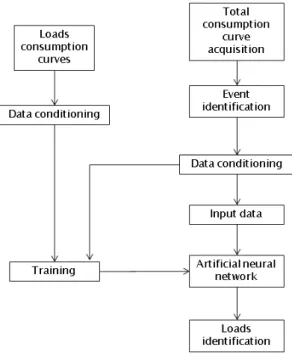
Fig. 2 shows a block diagram with the general steps to implement a nonintrusive load monitoring systems. The general consumption curve is obtained adding the consumption of all the loads at the electrical installation. This curve has significant changes when the electrical devices change their operation state. Load curve is analysed several times to identify the events according to the behaviour. After the identification of an event, the operation state of the devices that have changed must be determined.
Fig. 2. Block diagram of a nonintrusive monitoring system.
An artificial neural network was trained with the electrical features obtained for each typical load. The state of each load is indicated as an output of the neural network, allowing constant knowledge of the impact of the devices on the total electric power consumption. Nonintrusive load monitoring systems have been developed using different steady state parameters as real power [4], [17], reactive power [9], current [18] and harmonics [19]. Normally, the real power has been widely used to identify the load and no impedance parameters are considered due this parameter is often insufficient to generate high positive results by itself. The proposed model seeks to use as input the real power along with the impedance in search of optimizing load identification.
For an electrical installation with n loads, the total real power, Pt, can be calculated as the sum of the real power of each load, Pi, as shown in (1).
= (1)
The change in real power of each load, dPi, between time t and time t-1, can be calculated as shown in (2).
= = x (2)
The total change in real power of the electrical installation, dPt, between time t and time t-1, is calculated as expressed in (3). This change must reflect the change of each single load of the system.
= = x (3)
Considering n loads, the change in the real power of each load, dPi, can be detected in the total change in real power of the electrical installation, dPt, as expressed in (4).
Using the measures of real power, reactive power and current with the smart meter, the changes in load can be detected over time. The sum of real power and reactive power of each load, gives the total power of the installation, and the apparent power can be calculated using (5).
= + (5)
where St(t) is the total apparent power, Pi(t) the real power of load i and Qi(t) the reactive power of load i. The impedance of the installation can be calculated using the sum of the apparent power divided by the current of each load, as expressed in (6).
= (6)
where Zt(t) is the total impedance, Si(t) the apparent power of load i and Ii(t) the current of load i. As loads of electrical installations are connected in parallel, the relation between the total impedance and the impedance of the loads is determined as expressed in (7).
= + + ⋯ + (7)
IV.ARTIFICIAL NEURAL NETWORK DESIGN
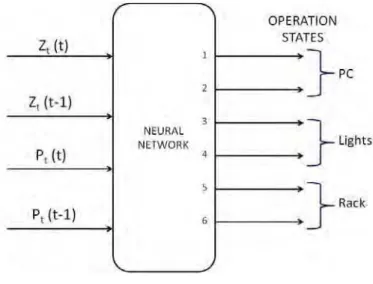
When the occurrence of an event is identified in the total consumption curve, the load characterization model through a neural network is applied. This network must establish the operation state of each device before and after the event. According to the considered parameters for model development, the neural network implemented in this research has 4 inputs and six outputs as shown in Fig. 3.
Fig. 3. Neural network structure.
When an event is identified at instant t, the total impedance and the total real power at instant t, Pt(t) and Zt(t), are used as an input for the neural network, as well as the information before the event, Pt(t − 1) and Zt(t − 1). With this data, the network is in the ability of establishing relations between the level and the delta values of the selected parameters and the state of each device.
The network has six outputs corresponding to the state of each device before and after the occurrence of an event. Outputs 1 and 2 are associated with the computer, 3 and 4 with the lights, 5 and 6 with the rack. Thus, odd outputs correspond to states before the event and even outputs to states after the event. Outputs can take integer values between 1 and 9, representing a specific operation state as follows: 1. PC Off/Suspended 2. PC with screen off 3. PC On 4. All lighting circuits off 5. Two lighting circuits off and one on 6. One lighting circuit off and two on 7. All lighting circuits on 8. Rack off 9. Rack on
A. Neural network training
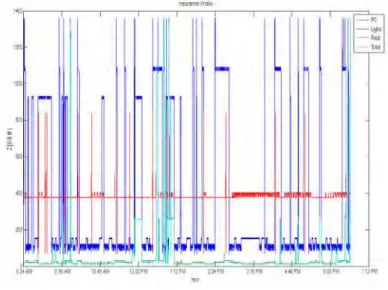
and total loads of an electrical circuit are shown. Lights have the highest power consumption level and the computers have a variable behaviour in the state on.
Fig. 4. Individual loads and total real power profile
Similarly, Fig. 5 shows impedance profile of each load and the impedance generated by the set of them. The total load impedance is lower than the individual load impedance, representing the change in consumption and the stages. According to this, the lowest impedance loads are the lights, limiting the total impedance to a low value when they are in the on state, and producing a substantial increase when they are in the off state (zero power, infinite impedance).
Fig. 5. Individual loads and total impedance profile
Following the structure defined for the neural network shown in Fig. 3, an input data was defined as shown in Table 1. Each column corresponds to input data of a specific event. An output data set was created to train the neural network, where each position identifies the states of loads before and after the event.
TABLE I Input Data Example
Output data structure is shown in Table 2, which contains the outputs corresponding to the input data example of Table 1. From the created consumption curve, a total of 230 events were obtained, generating 230 input and output data as basis information for developing the model. A feed forward back-propagation network is used due the nature of the problem to be solved. This kind of network has the ability to successfully work in a wide range of classification applications and allows establishing relationships between a numeric input data set and an output data set of the same type [20].
TABLE II Output Data Example
PC Before 1 3 1 1 1
PC After 3 1 1 1 3
Lights Before 4 5 4 5 5
Lights After 5 4 5 5 5
Rack Before 8 9 8 8 9
Rack After 9 8 8 9 9
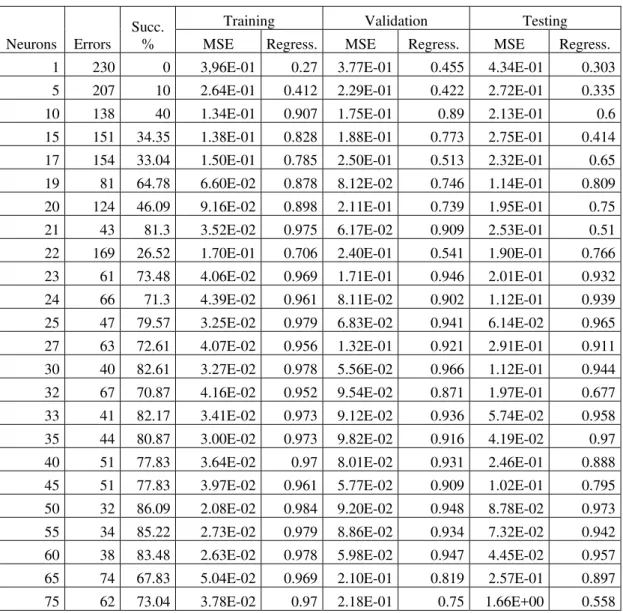
The structure of a multilayer feed-forward network is shown in Fig. 6. A neural network with one hidden layer is designed, using the back-propagation Levenberg-Marquardt algorithm for its training. The development of this network was performed through the neural network toolbox of MATLAB software. To establish the adequate number of neurons that the hidden layer must have, various training cases were performed and the network performance was registered. A set of 230 data was considered to develop the model. 70% of the data was used for training, 15% for validation and 15% for testing. For each step of the model development, the mean squared error (MSE) and the correlation coefficient between the network output and the target to reach (regression) were obtained. The number of wrong classification events and the percentage of success reached by the neural network were also nonintrusive
Fig. 6. Multilayer feed-forward network structure registered.
TABLE III
Network Performance by Number of Hidden Neurons
Neurons Errors Succ.
%
Training Validation Testing MSE Regress. MSE Regress. MSE Regress.
1 230 0 3,96E-01 0.27 3.77E-01 0.455 4.34E-01 0.303 5 207 10 2.64E-01 0.412 2.29E-01 0.422 2.72E-01 0.335 10 138 40 1.34E-01 0.907 1.75E-01 0.89 2.13E-01 0.6 15 151 34.35 1.38E-01 0.828 1.88E-01 0.773 2.75E-01 0.414 17 154 33.04 1.50E-01 0.785 2.50E-01 0.513 2.32E-01 0.65
19 81 64.78 6.60E-02 0.878 8.12E-02 0.746 1.14E-01 0.809 20 124 46.09 9.16E-02 0.898 2.11E-01 0.739 1.95E-01 0.75 21 43 81.3 3.52E-02 0.975 6.17E-02 0.909 2.53E-01 0.51
22 169 26.52 1.70E-01 0.706 2.40E-01 0.541 1.90E-01 0.766 23 61 73.48 4.06E-02 0.969 1.71E-01 0.946 2.01E-01 0.932 24 66 71.3 4.39E-02 0.961 8.11E-02 0.902 1.12E-01 0.939 25 47 79.57 3.25E-02 0.979 6.83E-02 0.941 6.14E-02 0.965
27 63 72.61 4.07E-02 0.956 1.32E-01 0.921 2.91E-01 0.911 30 40 82.61 3.27E-02 0.978 5.56E-02 0.966 1.12E-01 0.944 32 67 70.87 4.16E-02 0.952 9.54E-02 0.871 1.97E-01 0.677 33 41 82.17 3.41E-02 0.973 9.12E-02 0.936 5.74E-02 0.958 35 44 80.87 3.00E-02 0.973 9.82E-02 0.916 4.19E-02 0.97
40 51 77.83 3.64E-02 0.97 8.01E-02 0.931 2.46E-01 0.888 45 51 77.83 3.97E-02 0.961 5.77E-02 0.909 1.02E-01 0.795 50 32 86.09 2.08E-02 0.984 9.20E-02 0.948 8.78E-02 0.973
55 34 85.22 2.73E-02 0.979 8.86E-02 0.934 7.32E-02 0.942 60 38 83.48 2.63E-02 0.978 5.98E-02 0.947 4.45E-02 0.957 65 74 67.83 5.04E-02 0.969 2.10E-01 0.819 2.57E-01 0.897 75 62 73.04 3.78E-02 0.97 2.18E-01 0.75 1.66E+00 0.558
Fig. 7. Success percentage vs. neurons in the hidden layer
V. RESULTS AND DISCUSSIONS
A. Model performance
With the results obtained from the simulation of the 230 input data with the designed network, the mean absolute percentage error (MAPE) was calculated using (8).
= | |∗ (8)
where, y is the target of the network and y is the network output. The result obtained for the MAPE was 19,09%.
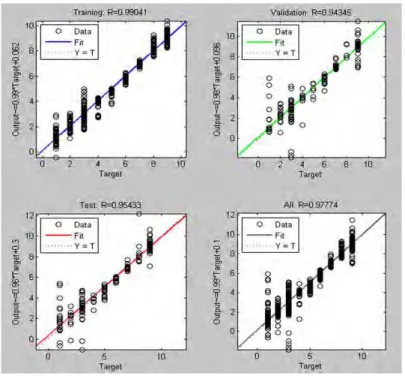
The correlation diagram obtained for the designed neural network is shown in Fig. 8. The outputs obtained by the network for each target on the stages of training, validation and testing, are shown separately and together. Due the neural network had at its output decimal values near the integer values identifying a specific operation state, these output values were approximated to the nearest integer, becoming the final output of the model. In Fig. 8, states 4, 5, 6 and 7 were the most accurate and those were related to the lighting circuit. On the other hand, a higher variability in the results when the targets were the states corresponding to the computer and the rack was obtained, especially for the values 3 and 8. This was reflected in the number of times that the network made mistakes in identifying the state of each load.
Table 4 shows that the computer was misclassified in 13 of the 230 events, the rack in 24 events, and the lights had no errors. In general, the developed model misclassified 32 of the 230 events introduced to it, which represents a success percentage of 86,087%.
TABLE IV
Load Identification Performance
Load Number of
misclassification
Success percentage (%)
PC 13 94,35
Lights 0 100
Rack 24 89,57
B. Real power model
Another neural network with the same number of hidden neurons previously used (50) was trained, but in this case the only input parameter considered was the real power. Thus, this new network has as inputs the real power before and after an event occurs, while the outputs are the same as described above for the proposed model. In this case, the network made mistakes in 126 of the 230 entered events, which represents a success percentage of 45,217%.
Fig. 9 shows that the network outputs have a higher variability around the target values than the obtained with the previous model. This was observed especially in the validation and testing steps, indicating that it does not have good ability to generalize. Other models that only use real power have been developed, as the presented in [11], which uses an optimization model for load identification. In this work, 56% of the energy consumption of a residential installation was detected. From the results obtained, we can conclude that the proposed neural network model performed better than other simpler models that only use real power as input parameter, which implies that adding impedance generates more accurate results.
Fig. 9. Correlation of the network with real power input
VI. CONCLUSIONS
between states. Errors on the identification of computers occurred for the variable consumption and on the rack for the low power consumption.
ACKNOWLEDGEMENTS
This research was conducted with the support of the Energy Strategy Area of the Universidad del Norte, Barranquilla – Colombia. Authors would like to thank to the Universidad del Norte and the Universidad Nacional de Colombia for the valuable information provided for this research.
REFERENCES
[1] C. W. Gellings, The Smart Grid: Enabling Energy Efficiency and Demand Response. Lilburn: Fairmont Press, 2009, p. 300. [2] M. Valocchi, A. Schurr, J. Juliano, and E. Nelson, “Plugging in the Consumer,” 2007.
[3] R. Belhomme, P. Eyrolles, R. G. Sainz-maza, J. J. Huarte, G. Valtorta, E. Morozova, F. Naso, D. A. Ghanem, and S. Mander, “Implementing Active Demand in the ADDRESS Project : Laboratory Tests and First Results from the Field,” in 2012 3rd IEEE PES Innovative Smart Grid Technologies Europe (ISGT Europe), 2012, pp. 1–8.
[4] M. H. Albadi and E. F. El-Saadany, “Demand Response in Electricity Markets: An Overview,” 2007 IEEE Power Eng. Soc. Gen. Meet., 2007.
[5] F. Fernandes, H. Morais, P. Faria, Z. Vale, and C. Ramos, “SCADA house intelligent management for energy efficiency analysis in domestic consumers,” in 2013 IEEE PES Conference on Innovative Smart Grid Technologies (ISGT Latin America), 2013, pp. 1–8. [6] L. Z. L. Zhou, F.-Y. X. F.-Y. Xu, and Y.-N. M. Y.-N. Ma, “Impact of smart metering on energy efficiency,” Mach. Learn. Cybern.
(ICMLC), 2010 Int. Conf., vol. 6, 2010.
[7] H. Najmeddine, K. El Khamlichi Drissi, C. Pasquier, C. Faure, K. Kerroum, A. Diop, T. Jouannet, and M. Michou, “State of art on load monitoring methods,” in 2008 IEEE 2nd International Power and Energy Conference, 2008, pp. 1256–1258.
[8] S. N. Patel, T. Robertson, J. A. Kientz, M. S. Reynolds, and G. D. Abowd, “At the Flick of a Switch : Detecting and Classifying Unique Electrical Events on the Residential Power Line,” in UbiComp, 2007, pp. 271–288.
[9] G. W. Hart, “Nonintrusive appliance load monitoring,” Proc. IEEE, vol. 80, 1992.
[10] H. Pihala, Non-intrusive Appliance Load Monitoring System Based on a Modern KWh-meter. Technical Research Centre of Finland, 1998.
[11] A. J. Bijker, X. X. X. Xia, and J. Z. J. Zhang, “Active power residential non-intrusive appliance load monitoring system,” AFRICON 2009, 2009.
[12] Y. Nakano and H. Murata, “Non-intrusive electric appliances load monitoring system using harmonic pattern recognitionTrail application to commercial building,” in International Conference Electrical Engineering, 2007.
[13] M. Zeifman and K. Roth, “Nonintrusive appliance load monitoring: Review and outlook,” 2011 IEEE Int. Conf. Consum. Electron., pp. 239–240, 2011.
[14] J. Z. Kolter and M. J. Johnson, “REDD : A Public Data Set for Energy Disaggregation Research,” Artif. Intell., vol. xxxxx, pp. 1–6, 2011.
[15] K. Anderson, A. F. Ocneanu, D. Benitez, D. Carlson, A. Rowe, and M. Bergés, “BLUED : A Fully Labeled Public Dataset for Event-Based Non-Intrusive Load Monitoring Research,” in ACM SIGKDD Conference on Knowledge Discovery and Data Mining, 2012, pp. 1 – 5.
[16] S. Barker, A. Mishra, D. Irwin, E. Cecchet, P. Shenoy, and J. Albrecht, “Smart*: An Open Data Set and Tools for Enabling Research in Sustainable Homes,” in Proceedings of the 2012 Workshop on Data Mining Applications in Sustainability, 2012.
[17] S. Rahimi, A. D. C. Chan, and R. A. Goubran, “Nonintrusive load monitoring of electrical devices in health smart homes,” in 2012 IEEE International Instrumentation and Measurement Technology Conference Proceedings, 2012, pp. 2313–2316.
[18] S. Makonin, F. Popowich, L. Bartram, B. Gill, and I. V Baji, “AMPds : A Public Dataset for Load Disaggregation and Eco-Feedback Research,” in In proceeding of: Electrical Power and Energy Conference (EPEC), 2013.
[19] D. Srinivasan, W. S. Ng, and A. C. Liew, “Neural-Network-Based Signature Recognition for Harmonic Source Identification,” IEEE Transactions on Power Delivery, vol. 21. pp. 398–405, 2006.