Printed version ISSN 0001-3765 / Online version ISSN 1678-2690 http://dx.doi.org/10.1590/0001-3765201620150636
www.scielo.br/aabc
Evaluation of deciduous broadleaf forests mountain using satellite data
using neural network method near Caspian Sea in North of Iran
SEyEd A. HASHEmI
Department of Forestry, Lahijan Branch, Islamic Azad University, 1616, Lahijan, Iran
Manuscript received on August 26, 2015; accepted for publication on October 20, 2015
ABSTRACT
During the recent decades, deciduous forests have been molested by human intervention. Easy access, abundance and diversity of valuable forest products have led to increased population density, creating new residential areas and deforestation activities. Revealing changes is one of the fundamental methods in management and assessment of natural resources. This study is evaluated changes in forests area of 2013 using satellite images. In order to mapping the forest extent condition 2013, images of the mentioned years were digitized and geo-referenced by using the ground control points and the maps of mapping organization. After selecting the best set of band using the Bhattacharya distance index, the image classification was performed by using artificial neural network algorithm. Classification by neural network method 2013 in showed that it has a high overall accuracy equal to 95.96%.
Key words: satellite data, ETM+, forest area, classification.
E-mail: [email protected]
INTROdUCTION
The present study will be done to determine land use level change of Siah Mazgi basin forests of shaft city and explain the factors influencing these changes using remote sensing and GIS. Based on this, Landsat satellite images of 2000 and 2013 will be used. Research methodology will be done using neural network classification method. Neural networks method is considered as a proper method for classification of land use and land cover, because it can be used for all kinds of data in various statistical scales (Chavez 1988). One of the most important features of neural network is its independence to statistical distribution of the input data. This important feature of neural networks
2358 SEYED A. HASHEMI
method including texture features is more accurate than maximum algorithm. The comparison of classification in artificial and fuzzy neural networks technique has been conducted to separate classes of forest from non-forest using SPOT satellite neural network method with the accuracy of 64% and kappa coefficient of 0.4 has higher accuracy than fuzzy method with the accuracy of 36% and Kappa coefficient of 0.20. Murayama and Khoi in an area at North Vietnam in 2011, modeled the destruction of forests using artificial neural network and Markov chain models (Montserud and Leamans 1992, Khoi and Murayama 2011). This study showed that the degradation in the boundary between forests and agricultural lands, areas close to water sources and areas with lower altitude is more intense. Neural network and GIS were used to assess the potential of climate changes effects on a complex landscape of northeastern Queensland tropical forests. Model inputs included variables of climate, soil parent material classes and ground variables. The obtained model was very successful in detecting forest classes with 75% accuracy of prediction. Changes in vegetation have been modeled in Australia using two logistic regression and artificial neural networks approach (Pijanowski et al. 2001). The results showed that both methods are capable of modeling vegetation changes, however neural network has a relatively better performance (Ahamed et al. 2011). The purpose of this study Evaluation of forests mountain use satellite data ETM+ with neural Network method in near Caspian
SELECTING THE USED IMAGES
The images used in this study are of the Landsat 8 satellite images 2013. The mission of this satellite, like the previous satellites of Landsat family, is to obtain the required data from the ground to monitor natural resources and remote sensing affairs. Landsat 8 satellite was launched on 11 February 2013. This is the eighth satellite in the
Landsat satellites program, and the seventh satellite which has successfully reached to the orbit. This satellite which is originally called Continuity Mission (LDCM) Landsat Data, is a product of collaboration between NASA and United States Geological Survey (USGS).
IMAGES PREPROCESSING
Geometric correction
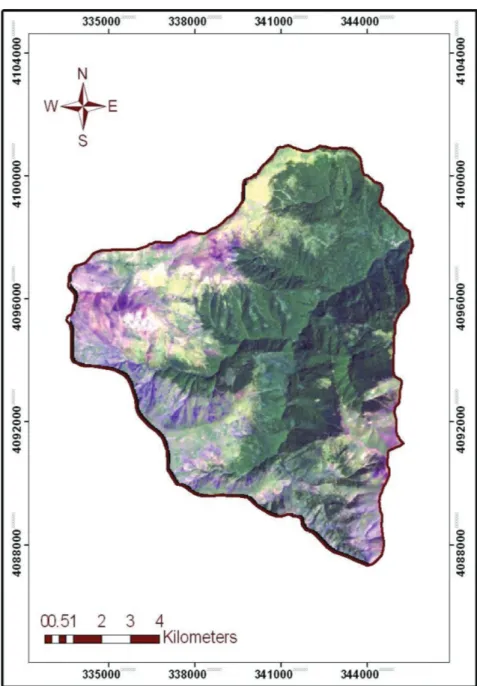
In this study, for geometric correction operations of images, the extraction of drainages and roads network from 1:25,000 maps of mapping organization and adapting them with received images from the Rice Research Institute of Gilan province was carried out. Then, the control points were randomly taken from all over the area. Since the image from the rice Institute is geo-referenced, very little geometric errors were observed in the pixels. Due to the appropriate resolution of Landsat satellite PAN band (15 m), first, the image of this band was corrected compared to 1:25,000 maps and then, other bands of 2013 image. It should be mentioned that the total RMSE error was equal to 0.4 for images of 2013. The more differences in spectral reflectance between bands, the higher accuracy the separation of effects and phenomena will be possible. The best band combination in this survey was selected the combination 367 for ETM+ images of 2013 (Figure 1).
Image Classification
network is either supervised or unsupervised. In supervised network, the input is applied to system and difference between the network output and the optimum output is used to change and adapt the weights. While in unsupervised network, the network adjusts itself proportional to the input data. The network response is due to learning algorithm and input data. In recent years, the use of artificial neural networks has been developed for various applications. One of the best applications
2360 SEYED A. HASHEMI
many other features such as high processing speed (due to parallel processing), having potential to solve the problems which their simulation through logical or other methods are difficult or impossible, the network being efficient to learn and adapt with environment in case of changing the environmental conditions, lack of network breakdown in case of damage to a part of the neurons and having logical answer for data in confidence terms (whether they are fuzzy or are received incompletely and coupled with receiving noise), increases the interest in using this method.
RESULTS
In this study, the two methods of overall accuracy and kappa coefficient were used for evaluation of produced layers. In fact, half of the ground facts
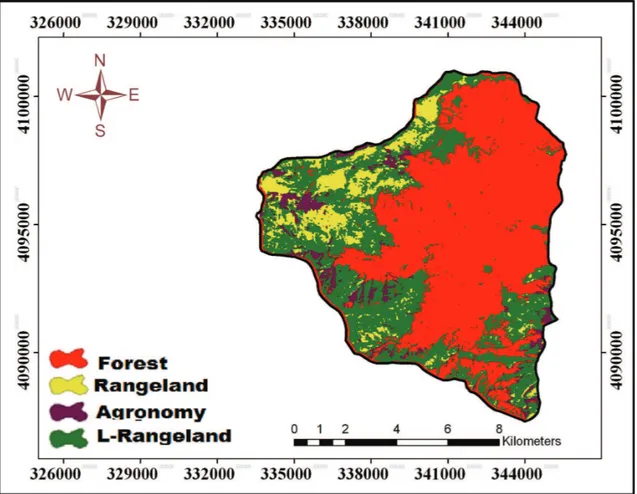
Distribution of land use levels separately for years 2013 shown in Figure 2 and table II. The maximum of class land type in forest type is 5575.17 hectares.
overall accuracy and Kappa statistic, have a good accuracy concerning the produced information. Also the results showed, a substantial portion of the pasture area has the forest origin and its natural land use changing and diverse uses of these lands has led it to convert to other land uses.
CONCLUSIONS
Also, the results showed, a substantial portion of the pasture area has the forest origin and its natural land use changing and diverse uses of these lands have led it to convert to other land uses. One of the basic of natural resources managements is the information’s related to the land use changes maps. Taken the great cost required and not updating of map drawing by land operation, in recent years, using satellite images is considered as a technique for this purpose.
REFERENCES
AHAMED T, TIAN L, ZHANG Y AND TING KC. 2011. A
review of remote sensing methods for biomass feedstock
production. Biomass Bioenerg 35: 2455-2469.
CHAVEZ PS. 1988. An Improved Dark-Object Subtraction
Technique for Atmospheric Scattering Correction of Multispectral Data. Remote Sens Environ 24: 459-479. DARVISH SEFAT A AND EIN ALLAH F. 2008. Forest
mapping with the help of Landsat TM data by digital method in lowland forests of Nour city. Iran J Nat Res 5: 244-249.
DELLEPIANE SG AND SMITH PC. 1999. Quality assessment of image classification algorithms for land cover mapping: A review and a proposal for a cost based approach. Int J Remote Sens 20: 1461-1486.
HASHEMI SA AND FALLAH CHAI M. 2013. Investigation of NDVI in relation to the growth phases of beech leaves in forest. Arab J Geosci 6(9): 3341-3347.
HILBERT DW AND OSTENDORF B. 2001. The utility of
artificial neural networks for modeling the distribution of
vegetation in past, present and future climates. Ecol Model 146: 311-327.
KHOI D AND MURAYAMA Y. 2011. Modeling deforestation
using a neural network-Koi Markov model. In Murayama
Y and Thapa RB (Eds), Spatial analysis and modeling in geographical transformation process: GIS-based applications, p.169-190, Dordrecht: Springer.
TABLE I
Kappa coefficient and overall accuracy of Landsat 8,
image of 2013.
Kappa coefficient (percent) Overall accuracy
0.9007 0.9596
TABLE II
distribution of land use levels separately for year 2013.
Class of Lands Image of 2013 Area (Hectare) Area (%)
Forest 5575.17 54.5
Agronomy 448.40 32.5
Rangeland 879.93 8.6
Semi-Rangeland 2327.5 4.38
10228.8 100
dISCUSSION
2362 SEYED A. HASHEMI
MONTSERUD RA AND LEAMANS R. 1992. Comparing
global vegetation maps with the kappa statistic. Ecol
Model 62: 275-293.
PIJANOWSKI BC, BROWN DG, SHELLITO BA AND
MANIK GA. 2001. Using neural networks and GIS to
forecast land use changes: a Land Transformation Model. Comput Environ Urban 26(6): 553-575.