ISSN 0104-6632 Printed in Brazil
www.abeq.org.br/bjche
Vol. 25, No. 04, pp. 671 - 682, October - December, 2008
Brazilian Journal
of Chemical
Engineering
USE OF SOLAR ENERGY IN THE TREATMENT OF
WATER CONTAMINATED WITH PHENOL BY
PHOTOCHEMICAL PROCESSES
K. R. B. Nogueira, A. C. S. C. Teixeira, C. A. O. Nascimento and R. Guardani
*University of São Paulo, USP, Chemical Engineering Department, Phone: +(55) (11) 3091-2277, Fax: +(55) (11) 3813-2380, Av. Prof. Luciano Gualberto
Travessa 3 380, CEP: 05508-900, São Paulo - SP, Brazil. E-mail: guardani@usp.br
(Received: August 20, 2006 ; Accepted: January 23, 2008)
Abstract - The solar driven photo-Fenton process for treating water containing phenol as a contaminant has been evaluated by means of pilot-scale experiments with a parabolic trough solar reactor (PTR). The effects of Fe(II) (0.04-1.0 mmol L-1), H2O2 (7-270 mmol L
-1
), initial phenol concentration (100 and 500 mg C L-1), solar radiation, and operation mode (batch and fed-batch) on the process efficiency were investigated. More than 90% of the dissolved organic carbon (DOC) was removed within 3 hours of irradiation or less, a performance equivalent to that of artificially-irradiated reactors, indicating that solar light can be used either as an effective complementary or as an alternative source of photons for the photo-Fenton degradation process. A non-linear multivariable model based on a neural network was fit to the experimental results of batch-mode experiments in order to evaluate the relative importance of the process variables considered on the DOC removal over the reaction time. This included solar radiation, which is not a controlled variable. The observed behavior of the system in batch-mode was compared with fed-batch experiments carried out under similar conditions. The main contribution of the study consists of the results from experiments under different conditions and the discussion of the system behavior. Both constitute important information for the design and scale-up of solar radiation-based photodegradation processes.
Keywords: Photo-Fenton; Phenol; Solar reactors; Photodegradation; Wastewater; Neural networks.
INTRODUCTION
The recovery of industrial effluents containing low levels of recalcitrant organic substances by conventional treatments (flocculation, adsorption, incineration, etc.) may not be economically feasible and usually transfers pollutants from one phase to another. Also, the presence of non-biodegradable substances may preclude the use of conventional activated-sludge systems. In this context, photochemical advanced oxidation processes can be a feasible alternative for the treatment of industrial wastewater containing toxic non-biodegradable
compounds. An example is the photo-Fenton reaction, based on the reaction of H2O2, Fe(II)/Fe(III)
sources and light (see, for example, Kim and Vogelpohl, 1998; Kiwi et al., 2000; Moraes et al., 2001) which in favorable cases can oxidize organic pollutants to CO2 and H2O, plus inorganic salts of
According to a simplified mechanism, Fe(II) is oxidized to Fe(III), and H2O2 is reduced to hydroxide
anions and hydroxyl radicals (HO•):
-2 2
Fe(II)+H O →Fe(III)+HO +OH• (1)
Fe(III) can be reduced back to Fe(II) by H2O2
according to:
+
-2 2 2 3 2
Fe(III)+H O +H O→Fe(II)+H O +HO • (2)
A more detailed description of these reactions,
considering hydrated iron-H2O2 complexes,
including rate constants and redox potentials is found in the literature (Bossmann et al., 1998). The thermal reduction given by Reaction 2 is much slower than Reaction 1 and determines the overall process rate. Therefore, Reaction 1 slows down appreciably after the initial conversion of Fe(II) to Fe(III) and, thus, the addition of relatively large amounts of iron is required. On the other hand, the Fenton reaction can be strongly accelerated by irradiation with UV-visible light, improving degradation rates (Oliveros et al., 1997; Bossmann et al., 1998; Emilio et al., 2002). In the pH 2.8-3.2 range the aqueous complex Fe(OH)2+ absorbs light at wavelengths up to 410 nm,
yielding HO• radicals, and photochemically
regenerating Fe(II):
h 2+
Fe(OH) →ν Fe(II)+HO• (3)
The photo-irradiated Fenton process consumes less H2O2 and requires only catalytic amounts of
Fe(II). After iron precipitation, any residual H2O2
decomposes to water and oxygen. In recent years, a number of papers have appeared in the literature describing the application of the photo-Fenton process to the photodegradation of aqueous solutions containing different organic compounds. However, an important drawback to industrial applications of the photo-Fenton process is the large consumption of electrical energy by light sources (Oliveros et al., 1997), representing more than 60% of the total costs. Since ultraviolet light is a natural component of solar radiation, the sun provides a low-cost, renewable source of photons. In areas with lower insolation, hybrid UV lamp/solar photoreactors can be used. The advantage of the photo-Fenton processes is the sensitivity to light up to wavelengths of ca. 600 nm, corresponding to 35% of the solar radiation (Kim and Vogelpohl, 1998; Will et al., 2004).
One of the simplest solar devices is the parabolic trough reactor (PTR), in which parabolic collectors concentrate direct radiation onto fluid-filled transparent receiver tubes positioned along the focus line of the troughs (Meinecke and Bohn, 1995; Alfano et al., 2000). However, concentrating systems use sunlight less efficiently, since they are not suited to capture diffuse sunlight as efficiently as they do direct solar beams. Sánchez (1992) and Goslich et al. (1997) have described further details of parabolic trough reactors. Reviews on this subject have been published (Alfano et al., 2000; Malato et al., 2002).
In this study, the effectiveness of the solar-driven photo-Fenton process for the degradation of phenol in aqueous systems has been studied using a pilot-scale PTR. The effects of Fe(II), H2O2, initial phenol
concentration, operation mode (batch and fed-batch) and irradiation conditions on the dissolved organic carbon (DOC) removal have been investigated. The main contribution of the study consists of the results from experiments under different conditions and the discussion of the system behavior. Both constitute important information for the design and scale-up of solar radiation-based photodegradation processes.
EXPERIMENTAL
Reagents
Technical grade phenol (99%), heptahydrated ferrous sulfate (FeSO4.7H2O, >98%), and hydrogen
peroxide (H2O2, 30% w/w in water) were used as
reagents.
Equipment and Experimental Procedure
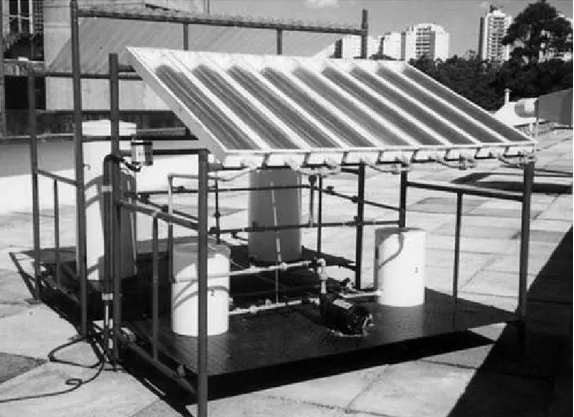
A view of the PTR reactor is shown in Figure 1. The apparatus consists of nine flow-through borosilicate glass tubes (outside diameter, 16 mm; internal diameter, 11 mm; length, 1.2 m) connected in series. The tubes are positioned along the length of the solar collectors at the focus line of each parabolic trough. Each collector is made up of reflective polished aluminum. The total reflecting surface and
the irradiated volume are 2.34 m2 and 1.0 L,
The phenol solutions were prepared by diluting solid phenol in tap water, which was previously filtered using quartz wool and activated carbon cartridges in order to remove solid particles and chlorine. The amount of phenol was chosen according to the desired initial dissolved organic
carbon concentration (DOC0). In batch-mode
operation, 17.5 L of the phenol solution (DOC0 =
100 or 500 mg C L-1) were recirculated through the system. In the fed-batch operation (DOC0 = 500 mg
C L-1), 6 L of the solution were initially transferred to the circulation tank from a storage tank. At time t = 0 the remaining phenol solution (11 L) was fed at a controlled flow rate by means of a peristaltic pump.
In both cases, after taking the initial sample, the weighed amount of FeSO4.7H2O was added to the
circulation tank. The pH was adjusted at 3.0 by adding H2SO4. The reactor was then exposed to solar
light from about 12h00 p.m. (local time) the H2O2
solution was continuously added under controlled flow rate by means of a peristaltic pump during the experiment (180 minutes). In batch operation, 0.5 or 1.0 L of the H2O2 solution were pumped at 0.192 or
0.36 L h-1, respectively. In fed batch operation, 1.0 L
of the H2O2 solution (188 mmol L -1
) was pumped at 0.36 L h-1. Temperature and pH were monitored by means of a thermocouple connected to a digital meter and a pH-electrode. In the experiments with DOC0 =
100 mg C L-1, only pH was monitored, with DOC0 =
500 mg C L-1, pH was controlled at about 3.0.
Along this text [Fe(II)] refers to the initial Fe(II) concentration added to the aqueous solution and [H2O2] is the hydrogen peroxide concentration in the
reaction medium that would be obtained if all H2O2
solution had been added at time t = 0. The effects of [Fe(II)] and [H2O2] were first studied in the batch
mode experiments with DOC0 = 100 mg C L-1, by
means of 9 experiments (B1-B9), plus three additional experiments (B10-B12) carried out with DOC0 = 500 mg C L-1. Most of the experiments were
carried out on clear-sky days. The conditions in these runs concerning [H2O2] and [Fe(II)] are shown in
Table 1 and Figure 2. Three fed-batch experiments (F1-F3) were carried out with DOC0 = 500 mg C L-1,
and [H2O2] and [Fe(II)] levels equal to those in batch
experiment B11. Phenol solution was fed to the tank at 12.0, 6.0, and 4.0 L h-1 for experiments F1, F2, and F3, respectively
Table 1: Summary of conditions and results of the batch and fed-batch experiments.
Experiment [H2O2]
a
(mmol L-1)
[Fe(II)]b
(mmol L-1)
DOC0 c
(mg L-1)
diff dir E
E
d diff
glb E
E
e t80 f
(minutes)
DOC % removal after
180 minutes
Batch operation
B1 50 0.40 107 0.29 0.22 65.7 94.0
B2 150 0.40 108 0.09 0.08 36.2 94.3
B3 150 0.20 92 0.27 0.20 61.6 88.2
B4 50 0.20 89 0.13 0.11 64.9 93.7
B5 7 0.20 105 0.13 0.11 n.a. 40.2
B6 7 0.04 103 0.09 0.08 n.a. 42.7
B7 50 0.04 104 1.08 0.52 n.a. 74.9 B8 20 0.20 110 0.35 0.26 n.a. 57.3
B9 20 0.04 114 0.17 0.14 171.0 83.3
B9a g 20 0.04 114 - - n.a. 23.4
B10 100 0.20 549 0.09 0.08 n.a. 49.4
B11 188 0.40 495 0.11 0.10 152.6 96.3
B11a g 188 0.40 495 - - n.a. 36.3
B12 270 1.01 550 0.21 0.17 78.4 88.2
Fed-batch operation
F1 188 0.40 495 0.21 0.17 - 93.0
F2 188 0.40 495 0.12 0.11 - 95.1
F3 188 0.40 495 0.28 0.22 - 90.6
a
H2O2 concentration which would be obtained if all H2O2 solution had been added to the reaction medium at the beginning of the experiment; b
Fe(II) concentration of the aqueous solution; c
initial DOC of the phenol-in-water solution; d
ratio between the accumulated diffuse radiant energy (Ediff) and the accumulated direct radiant energy (Edir) at time t, time-averaged values; e
ratio between the accumulated diffuse radiant energy (Ediff) and the accumulated global radiant energy (Eglb) at time t, time-averaged values; f
irradiation time required to achieve 80% DOC removal; g
experiments carried out in the dark.
0.2 0.4 1.0
50 100 150 188 270
0.04
20 7
B1 B2
B4 B3
B8
B9 B7 B5
B6
B10
B12
B11
[H2O2] (mmol
[Fe
(I
I)
] (
mm
o
l
0.2 0.4 1.0
50 100 150 188 270
0.04
20 7
B1 B2
B4 B3
B8
B9 B7 B5
B6
B10
B12
B11
[H2O2] (mmol LL-1-1))
[Fe
(I
I)
] (
mm
o
lL
-1) -1)
0.2 0.4 1.0
50 100 150 188 270
0.04
20 7
B1 B2
B4 B3
B8
B9 B7 B5
B6
B10
B12
B11
[H2O2] (mmol
[Fe
(I
I)
] (
mm
o
l
0.2 0.4 1.0
50 100 150 188 270
0.04
20 7
B1 B2
B4 B3
B8
B9 B7 B5
B6
B10
B12
B11
[H2O2] (mmol LLLL-1-1-1-1))))
[Fe
(I
I)
] (
mm
o
lL
-1) -1)
L
-1) -1)
Figure 2: Graphical representation of the experimental conditions. The numbers of the experiments are indicated (see Table 1). [Fe(II)]: Initial Fe(II) concentration of the aqueous solution; [H2O2]:
hydrogen peroxide concentration which would be obtained if all H2O2 solution had been added to
the reaction medium at the beginning; black squares: experiments carried out with DOC0 = 100
Analyses
Ten-milliliter samples were taken from the circulation tank at specified times for the characterization of phenol degradation. Dissolved organic carbon (DOC) analyses were performed immediately after collecting the samples by using a Shimadzu 5000A analyzer. A solution containing KI, Na2SO3 and NaOH (each 0.1 mol L-1) was added to the
samples in the proportion 5:2 v/v (sample:solution) to quench the reaction. Samples were then filtered through a GV Millex with a Durapore membrane (Millipore) of 0.22 µm before being analyzed.
The time evolution of phenol degradation was monitored by the DOC-time curves. The process performance was estimated from the DOC removal as a function of reaction time, according to:
t 0 t 0
DOC removed =(DOC -DOC ) DOC (4)
in which DOC0 is the initial dissolved organic carbon
concentration of the phenol-in-water solution, and DOCt is the value after t minutes of irradiation.
Solar Radiation Measurements
Radiation data, provided by the Laboratory of Micrometeorology (Astronomical and Geophysical Institute, University of São Paulo), were recorded at five minute intervals. Global solar radiation was measured by means of a pyranometer (Eppley PBW) in the range 285-2800 nm. The diffuse component of the global solar radiation was measured by means of a pyranometer (Eppley PSP) with a shading ring to eliminate direct radiation. Although the maximum wavelength absorbed by the photo-Fenton system is ca. 600 nm, the radiation range up to 2800 nm was adopted in this study to enable comparison with the usually adopted range of solar radiation measurements by thermopiles. This does not affect the results of this study since, according to the literature (Duffie and Beckman, 1991) under clear sky the shape of the solar direct radiation spectral distribution is constant. Therefore, the direct radiation absorbed by the photo-Fenton system can be assumed to be a constant fraction of the direct radiation obtained from the measurements.
Ferrioxalate actinometry experiments were carried out with the purpose of evaluating the incident photon rate, so that the light absorption rate by the reaction system could be evaluated under similar insolation conditions. The procedure described in the literature (Braun et al., 1991) was adopted. The actinometric measurements were carried out during the first 30 minutes of solar irradiation so that the light absorbance at 510 nm stayed between 0.4 and 1.0, and in order to avoid
consumption of more than 10% of the ferrioxalate in the solution (Braun et al., 1991).
RESULTS AND DISCUSSION
Solar Radiation Measurements
In solar photochemical reactors, the incident radiation is not a controlled variable and can be treated as a measured disturbance. Since the distribution of solar radiation in direct and diffuse components affects the process, the analysis of insolation conditions considered the ratio between the accumulated diffuse solar energy (Ediff) and the
accumulated direct solar energy (Edir) at time t, and
the ratio between the accumulated diffuse solar energy (Ediff) and the accumulated global solar
energy (Eglb) at time t. The experiments were carried
out under clear sky conditions, with radiation-time profiles similar to the plot shown in Figure 3a. For comparison, one of the experiments, B7, was carried out under conditions of passing clouds, with the radiation profile shown in Figure 3b. The following average values of these ratios were obtained from all batch experiments, except for experiment B7:
diff dir E
0.18 0.09
E = ±
diff glb E
0.15 0.06
E = ±
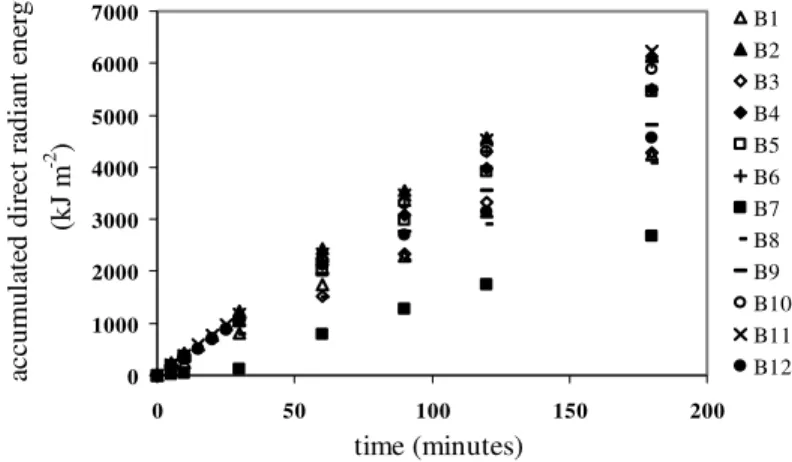
Figure 4a shows the accumulated direct radiant energy for the batch experiments. Except for B7, considering solely the radiation reaching the solar collector and neglecting any losses, the average energy inputs at 30, 60, 120, and 180 minutes were, respectively, 1084±147, 2086±321, 3947±636, and 5439±887 kJ m-2. Figure 4b shows the same results for the first 30 minutes of irradiation (except for B7), including the results of actinometric experiments carried out under clear sky (Act1), and on cloudy days (Act2, Act3). As shown in Figure 4b, equivalent results were obtained using actinometry and radiometer measurements, indicating that these latter can be used as a quantitative information corresponding to the light absorption rate by the reaction system.
0 100 200 300 400 500 600 700 800
12 13 14 15 16 17
local time (h)
ir
ra
d
ian
ce (
W
m
-2 )
0 1000 2000 3000 4000 5000 6000 7000 8000
ac
cu
m
u
la
te
d
ra
d
ian
t
ene
rgy (
kJ
m
-2 )
(a)
(a)
0 100 200 300 400 500 600 700 800
12 13 14 15 16 17
local time (h)
irrad
ian
ce
(W
m
-2 )
0 1000 2000 3000 4000 5000 6000 7000 8000
ac
cu
m
u
la
ted
rad
ian
t
en
erg
y
(k
J
m
-2 )
(b)
(b)
Figure 3: Solar radiation measurements. Incident solar radiation (irradiance, in W m-2) and corresponding accumulated radiant energy (in kJ m-2), for (a) sunny days and (b) sunny days with moving clouds. Left ordinate axis: measured global radiation (―) and measured diffuse radiation (---). Right ordinate axis: radiant energy (―) and accumulated diffuse radiant energy (---).
0 1000 2000 3000 4000 5000 6000 7000
0 50 100 150 200
time (minutes)
ac
cum
ul
at
ed di
re
ct
r
adi
ant
e
ne
rg
y
(k
J m
-2 )
B1 B2 B3 B4 B5 B6 B7 B8 B9 B10 B11 B12
Figure 4: Accumulated direct solar radiant energy in the batch experiments.
Batch Experiments with DOC0 = 100 mg C L-1
Figure 5 shows DOC-time curves for the experiments with DOC0 = 100 mg C L-1. In these
runs, a slight decrease in pH relative to the set point
value of 3 (0.42±0.08 units on average) was
observed, possibly due to the formation of organic acids resulting from oxidation chain-reactions. In all cases, however, the pH remained within a suitable range for the stability of Fe(OH)2+ in solution. A temperature increase of 13.8±2.7oC on average was observed, from an initial temperature of 22.9±2.9oC on average depending on the day, and can be an important factor in view of the Fenton thermal generation of hydroxyl radicals (Reactions 1 and 2). In experiments B1, B2, B3, and B4, (Figure 5a), a rapid, nearly exponential initial decrease of DOC was observed, possibly due to the higher levels of reactants H2O2 and/or Fe(II) relative to phenol. For
these experiments, DOC removal reached ca. 90% in 60 minutes. The time necessary to remove 80% of the initial DOC, t80, attained its minimum value for
experiment B2 (Table 1), in which [H2O2] and
[Fe(II)] were at the highest level, as well as the accumulated direct radiant energy (Figure 4). In these four experiments the effect of the reactants is clearly observed during the first few minutes, since the radiant energy curves are practically coincident.
The DOC-time curves corresponding to B5 and B6 (Figure 5b) show that the amount of H2O2 was
probably not enough to reduce the DOC to values
below 60 mg C L-1 (DOC removal of about 40%,
Table 1). The DOC-time curves of experiments B7 and B9 were similar, resulting in larger DOC removal than experiment B6, in spite of the lower direct accumulated radiant energy in B7. This is apparently due to the different H2O2 concentration
DOC removal was about 94% in experiment B4. This result is similar to experiment B1, carried out at the same [H2O2] level, higher [Fe(II)] level, but
lower solar direct radiant energy. Experiments B8 and B9 were carried out with nearly the stoichiometric amount of H2O2 necessary to oxidize
all DOC (14 moles of H2O2 per mole of phenol), and
at somewhat similar radiation-time profiles, although the [Fe(II)] level in B8 is 5 times that in B9. As shown in Figure 5b, experiment B9 resulted in 25% higher DOC removal than B8. These results suggest that in experiment B8 Fe(II) was in excess and may have quenched HO• radicals. In fact the performance of experiment B9 is good when compared with experiments B1, B2, B3, and B4, carried out at higher H2O2 concentrations (see Table 1). However,
the time necessary to achieve 80% DOC removal (t80) was more than twice the t80 values observed for
experiments B1, B2, B3, and B4 (Table 1). When experiment B9 was carried out in the absence of solar light (B9a), the DOC values decreased slowly until ca. 60 minutes (experiment B9a), resulting in low DOC removal (about 25%). It is worth observing that the initial DOC removal rate was the same in both experiments B9 and B9a, possibly as a consequence of the thermal Fenton reaction.
Since the solar radiation is not a controlled variable, the experiments could not be repeated under the same conditions, and an evaluation of the relative importance of the variables considered in the study could not be obtained by performing a statistical analysis of the experimental data. Furthermore, non-linear relationships exist among the variables, thus preventing the fitting of linear models (Giroto et al., 2006). Thus, based on the previous experience of the authors, the evaluation of the relative importance of the variables was based on fitting a non-linear multivariable model consisting of a three-layer feed-forward neural network with sigmoidal response function (e.g., Göb et al., 1999). Since information is distributed and combined over the neural network, interactions among the input variables are taken into account. The DOC value at each irradiation time from the batch experiments was correlated with the H2O2 feed rate, [Fe(II)], and the
accumulated radiant energy. Fitting of the feed-forward neural network was based on the backpropagation algorithm, using in-house developed computer programs. A detailed description of the fitting procedure is presented in previous publications by the authors (e.g., Teixeira et al., 2003). This consisted of minimizing the quadratic deviation between computed and
experimental values of the output variable, E, according to Equation 5.
( )m p
(
(m) (m))
2k k
k 1
E y O
=
=
∑
− (5)where yk and Ok are the experimental and calculated
values of the output variable (DOC at time t) corresponding to the kth experimental observation, calculated at the mth presentation of observations to the neural network. Five input variables were adopted: the initially measured DOC, H2O2 feed rate,
[Fe(II)], accumulated radiant energy, and irradiation time. The output variable was the DOC at each irradiation time. All the experimental data were used in the model fitting process, in which the neural network configuration (number of neurons) and parameters of the learning process (number of presentations, learning rate) were varied. A total of 10,000 presentations of the data set to the neural network was adopted.
The minimum value of the quadratic deviation was obtained by fitting a neural network with 6 neurons in the hidden layer. This model showed good agreement with the experimental observations, as shown in Figure 6. Although the information fed to a neural network is distributed over its neurons, the relative importance of the model input variables can be evaluated based on the weights associated with each input variable and the first neural network layer. Table 2 shows these weights, and the sum of absolute values of the weights corresponding to each input variable. The weights corresponding to the bias are generally low compared with the other inputs, for well adjusted models. Among the input variables, the initially measured DOC value has the lowest sum of absolute values of weights. This is possibly due to the fact that the differences in the initial DOC were not large enough to affect the model output (measured DOC at time t). Nevertheless its weight is
considerably larger than the bias. Both Fenton
reactants, H2O2, and Fe(II) showed the largest effect
0.0 0.2 0.4 0.6 0.8 1.0 1.2
0 50 100 150 200
time (minutes)
D
OC
/DOC
0 B1
B2 B3 B4
(a)
(a)
0.0 0.2 0.4 0.6 0.8 1.0 1.2
0 50 100 150 200
time (minutes)
D
OC
/DOC
0
(m
g
C
L
-1 )
B5 B6 B7 B8 B9 B9a
(b)
(b)
Figure 5: DOC/DOC0-time curves. (a) B1 ([H2O2] = 50 mmol L-1; [Fe(II)] = 0.4 mmol L-1); B2 ([H2O2] =
150 mmol L-1; [Fe(II)] = 0.4 mmol L-1); B3 ([H2O2] = 150 mmol L-1; [Fe(II)] = 0.2 mmol L-1); B4 ([H2O2] =
50 mmol L-1; [Fe(II)] = 0.2 mmol L-1. (b) B5 ([H2O2] = 7 mmol L -1
; [Fe(II)] = 0.2 mmol L-1); B6 ([H2O2] =
7 mmol L-1; [Fe(II)] = 0.04 mmol L-1); B7 ([H2O2] = 50 mmol L -1
; [Fe(II)] = 0.04 mmol L-1); B8 ([H2O2] =
20 mmol L-1; [Fe(II)] = 0.2 mmol L-1); B9 ([H2O2] = 20 mmol L-1; [Fe(II)] = 0.04 mmol L-1); B9a ([H2O2] =
20 mmol L-1; [Fe(II)] = 0.04 mmol L-1).
y = 0.9996x R2= 0.9851
0 20 40 60 80 100 120 140
0 20 40 60 80 100 120 140
experimental DOC (mg C L-1)
ca
lc
ulat
ed
D
O
C
(m
g
C
L
-1)
y = 0.9996x R2= 0.9851
0 20 40 60 80 100 120 140
0 20 40 60 80 100 120 140
experimental DOC (mg C L-1)
ca
lc
ulat
ed
D
O
C
(m
g
C
L
-1)
Figure 6: Comparison of experimental and calculated values of the DOC corresponding to the fitting of a neural network to the experimental data (all data in the learning set).
Table 2: Weights of the neural network model fit to the data of the batch-mode experiments.
Neurons in the hidden layer
Input Variable 1 2 3 4 5 6
Sum of absolute
values
DOC0 1.240 1.023 -2.684 -2.353 1.734 0.283 9.317
H2O2 feed rate 1.688 2.850 -3.562 1.398 -3.676 -3.056 16.230
[Fe(II)] -0.120 -3.246 3.713 -1.206 -8.178 -0.083 16.546
Acc. direct radiant
energy -0.975 -3.405 2.257 -0.355 5.578 0.043 12.613
Irradiation time 1.095 -4.331 -0.525 0.818 2.351 2.142 11.262
Bias 0.976 0.884 -0.181 0.419 -0.919 -0.436 3.814
Hidden layer neuron 1 2 3 4 5 6 Bias
Weights to the output
Batch Experiments with DOC0 = 500 mg C L-1
The results in Figure 5 indicate that experiment B9 represents a favorable condition in terms of the reagent ratio, since it resulted in 30% DOC removal in 80 minutes, and more than 80% DOC removal in 180 minutes, with [H2O2] close to the stoichiometric
amount to degrade 100 mg C L-1 of phenol. The values of [H2O2] and [Fe(II)] in experiment B9
guided the choice of [H2O2] and [Fe(II)] in the batch
experiments carried out at DOC0 = 500 mg C L-1
(Table 1). Figure 7 shows the normalized DOC-time curves for these experiments. In experiment B10 the DOC did not decrease to values below 300 mg C L-1, suggesting that non-linear relationships exist among the variables, when phenol concentration is considered. In experiment B12, a fast decrease of DOC with time was observed, practically attaining the ultimate value in ca. 90 minutes. In fact the value of t80 for this experiment is about half of the value
obtained for B11 (Table 1), indicating that the higher levels of H2O2 and Fe(II) compensated for the
somewhat lower accumulated radiant energy in experiment B12. At intermediate [H2O2] and [Fe(II)],
the DOC removal in batch operation was also favorable (experiment B11, Figure 6). For comparison, experiment B11a was carried out in the dark under the same conditions (DOC0 = 500 mg C
L-1; [H2O2] = 188 mmol L -1
; and [Fe(II)] = 0.4 mmol L-1). The DOC removal in B11a was ca. 36% in 180 minutes. As expected, B11 performed better than B11a. B11a performed better than B10 during the first 60 minutes of reaction, indicating that, under these conditions the thermal Fenton reaction and the higher levels of [Fe(II)] and [H2O2]
had a significant effect on the initial phenol degradation rate.
Spectrophotometric analyses were performed at different times for experiments B2, B6, B9 and B10. As shown in Figure 8, the initially clearly visible absorption band at 270 nm disappeared gradually in all plots, possibly associated with phenol degradation. A gradual rise in the base line over time for all experiments was also observed. This can be the result of different effects, like accumulation of H2O2 (that absorbs light in the range under 330 nm),
and accumulation of degradation products such as hydroquinone and catechol, which absorb light at about the same wavelength range as phenol. The base line reached a maximum and then tended to decrease gradually for longer irradiation times. The identification and quantification of the degradation compounds, as well as H2O2 concentration, was not
within the scope of this study, but is an important aspect to be considered in the case of coupling photo-degradation with other treatment processes.
0.0 0.2 0.4 0.6 0.8 1.0 1.2
0 50 100 150 200
time (minutes)
DO
C/DOC
0
B10
B11
B12
B11a
0.0 0.2 0.4 0.6 0.8 1.0 1.2
0 50 100 150 200
time (minutes)
DO
C/DOC
0
B10
B11
B12
B11a B10
B11
B12
B11a
Figure 7: DOC/DOC0-time curves for experiments with DOC0 = 500 mg C L-1. B10 ([H2O2] = 100
mmol L-1; [Fe(II)] = 0.2 mmol L-1); B11 ([H2O2] = 188 mmol L-1; [Fe(II)] = 0.4 mmol L-1); B12 ([H2O2]
0.0 0.3 0.5 0.8 1.0
220 270 320
wavelength (nm)
ab
so
rb
an
ce
0 min
5 min
10 min
30 min
60 min
120 min
B2
0.0 0.3 0.5 0.8 1.0
220 270 320
wavelength (nm)
ab
so
rb
an
ce
0 min
5 min
10 min
30 min
60 min
120 min
B6
0.0 0.3 0.5 0.8 1.0
220 270 320
wavelength (nm)
ab
so
rb
an
ce
0 min
5 min
10 min
30 min
60 min
120 min
B9
0.0 0.5 1.0 1.5 2.0
220 270 320
wavelength (nm)
ab
so
rb
an
ce
0 min
5 min
10 min
30 min
60 min
120 min
B10
Figure 8: Time evolution of UV absorption spectra. (a) B2 (DOC0 = 100 mg C L-1; [H2O2] = 150
mmol L-1; [Fe(II)] = 0.4 mmol L-1); (b) B9 (DOC0 = 100 mg C L-1; [H2O2] = 20 mmol L-1; [Fe(II)] =
0.04 mmol L-1); (c) B6 (DOC0 = 100 mg C L -1
; [H2O2] = 7 mmol L -1
; [Fe(II)] = 0.04 mmol L-1); (d) B10 (DOC0 = 500 mg C L-1; [H2O2] = 100 mmol L-1; [Fe(II)] = 0.2 mmol L-1).
Fed-Batch Experiments
The same levels of [H2O2] and [Fe(II)] used in
experiment B11 were selected for the fed-batch operation of the solar reactor at DOC0 = 500 mg C L-1.
In this case, the feed solution containing phenol, H2O2
and Fe(II) was continuously fed to the system at a constant rate, for a specified time. Since the volume of the phenol solution in the system varied with time, the results were analyzed in terms of the accumulated degraded mass of organic carbon over time. Figure 9 shows the results of accumulated direct radiant energy and the degraded carbon mass over time. The marked points correspond to the time when the feed was stopped (F1, 60 minutes; F2, 120 minutes). In experiment F3, the feed remained constant during the whole experiment (180 minutes). As shown in Table 1, the three fed-batch experiments were carried out under the same phenol, [H2O2] and [Fe(II)] concentrations in
the feed solution. Thus, the differences among the three experiments are the solution feed rate (12.0, 6.0, and 4.0 L h-1 for experiments F1, F2, and F3, respectively), which affects the concentration in the system, and the
solar radiation. By comparing the upper and lower plots in Figure 8 it is apparent that the differences in the degradation rate among the three experiments are related only to the differences in solar radiation. The end of solution feed caused a small change in the slopes of the curves. Thus, the solution feed rate apparently did not affect the time profile of the degraded carbon mass.
0 2 4 6 8 10
0 50 100 150 200
time (minutes) ac cu m u la te d rea c te d m a ss (g ) F1 F2 F3 B11 F1end of feed
F2 end of feed (a) (a) 0 1000 2000 3000 4000 5000 6000 7000
0 50 100 150 200
time (minutes) accu m u la te d d ir ec t rad ian t en er g y (k J m -2) F1 F2 F3 (b) 0 1000 2000 3000 4000 5000 6000 7000
0 50 100 150 200
time (minutes) accu m u la te d d ir ec t rad ian t en er g y (k J m -2) accu m u la te d d ir ec t rad ian t en er g y (k J m -2) F1 F2 F3 (b) (b)
Figure 9: (a)Time evolution of the accumulated mass of carbon removed for the experiments B11, F1, F2, and F3 ([H2O2] = 188 mmol L
-1
; [Fe(II)] = 0.4 mmol L-1). B11 (batch); F1 (fed-batch, 12 L h-1); F2 (fed-batch, 6 L h-1); F3 (fed-batch, 4 L h-1). (b) Accumulated direct solar radiant energy in the fed-batch experiments.
CONCLUSIONS
The results presented in this study show that solar radiation can be advantageously used in the photodegradation of aqueous phenol solutions by the photo-Fenton process. Under the specific conditions of [H2O2], [Fe(II)] and solar radiation adopted in this
work, more than 90% of the organic carbon could be removed within 3 hours in the batch experiments, a performance equivalent to that of artificially-irradiated reactors (Will et al., 2004). The fitting of a non-linear multivariable model based on a neural network to the results of the batch experiments with DOC0 equal to 100 mg C L-1 enabled the evaluation
of the relative importance of the process variables considered. Based on the criterion of the sum of absolute values of the weights of each input variable, the Fenton reactants were the most important variables in the process, as expected. The sum of absolute weights associated with solar radiation is equivalent to that of reaction time, confirming previous results concerning a first order dependence of the DOC removal in relation to the solar radiation energy (Will et al., 2004).
In the fed-batch experiments, the direct solar radiation had a significant effect upon carbon removal. DOC removals of ca. 92% were achieved for experiments F1-F3, suggesting that the fed-batch operation is a convenient choice for solar-based wastewater treatment processes.
These results emphasize the strong importance of solar radiation and its variation for the operation of solar reactors, and indicate that manipulated variables (phenol, iron and peroxide concentrations,
phenol and peroxide feed rates) and operation mode (batch or fed-batch) could be suitably combined to compensate for the variation of solar radiant energy throughout the day and on different days. This is a direct consequence of the role played by absorbed photons in regenerating Fe(II) and hydroxyl radical from Fe(III), , which enhances thermal Fenton reactions and ultimately determines the rate at which oxidation proceeds.
ACKNOWLEDGMENTS
The authors wish to thank the support by CAPES and FAPESP. Sincere thanks are directed to the Laboratory of Micrometeorology, Astronomical and Geophysical Institute, University of São Paulo, for radiation data.
REFERENCES
Alfano, O. M., Bahnemann, D., Cassano, A. E., Dillert, R. and Goslich, R., Photocatalysis in water environments using artificial and solar light. Catalysis Today, 58, No. 2-3, p. 199 (2000). Bauer, R. and Fallmann, H, The photo-Fenton
oxidation - A cheap and efficient wastewater treatment method. Research on Chemical Intermediates, 23, No. 4, p. 341 (1997).
thermal and photochemically enhanced Fenton reactions. Journal of Physical Chemistry A 102, No. 28, p. 5542 (1998).
Braun, A. M.; Maurette, M. T. and Oliveros, E., Photochemical Technology. Chichester: John Wiley (1991).
Duffie, J. A. and Beckman, W. A., Solar engineering of thermal processes, 2nd. Ed., Wiley: New York (1991).
Emilio, C. A., Jardim, W. F., Litter, M. I. and Mansilla, H. D. EDTA destruction using the solar ferrioxalate advanced oxidation technology (AOT). Comparison with solar photo-Fenton treatment. Journal of Photochemistry and Photobiology A-Chemistry, 151, No. 1-3, p. 121 (2002).
Giroto, J. A., Guardani, R., Teixeira, A. C. S. C., Nascimento, C. A. O. Study on the photo-Fenton degradation of polyvinyl alcohol in aqueous solution. Chemical Engineering and Processing, 45, p. 523 (2006).
Göb, S., Oliveros, E., Bossmann, S. H., Braun, A. M., Guardani, R., Nascimento, C. A. O, Modeling the kinetics of photochemical wastewater treatment by means of artificial neural networks. Chemical Engineering and Processing, 38, p. 373 (1999). Goslich, R., Dillert, R.and Bahnemann, D., Solar water
treatment: principles and reactors. Water Science and Technology, 35, No. 4, p. 137 (1997).
Kim, S. M. and Vogelpohl, A., Degradation of organic pollutants by the photo-Fenton process. Chemical Engineering Technology, 21, No. 21, p. 187 (1998).
Kiwi, J.; Lopez, A.; Nadtochenko, V. Mechanism and kinetics of the OH-radical intervention during Fenton oxidation in the presence of a significant amount of radical scavenger (Cl-). Env. Sci. Tech., v. 34, p. 2162 (2000).
Legrini O., Oliveros E. and Braun A.M., Photochemical processes for water treatment. Chem. Rev. 93, No. 2, p. 671 (1993).
Malato, S., Blanco, J., Vidal, A. and Richter, C., Photocatalysis with solar energy at a pilot-plant scale: an overview. Applied Catalysis B-Environment, 37, No. 1, p. 1 (2002).
Meinecke, W. and Bohn, M, Solar Energy Concentrating Systems. Applications and Technologies. Deutsche Forschunsanstalt für Luft- und Raumfahrt e.V. (DLR), C.F. Muller, Heidelberg (1995).
Moraes, J. E. F.; Will, I. B. S.; Yu, J.; Teixeira, A. C. S. C.; Guardani, R. Photo catalytic degradation of phenol in water by the photo-Fenton process. 3rd European Congress of Chemical Engineering, June 25 - 28, Nuremberg, Germany. Proceedings (CD-ROM), 2001.
Oliveros, E., Legrini, O., Hohl, M., Müller, T. and Braun, A.M., Industrial waste water treatment: large scale development of a light-enhanced Fenton reaction. Chemical Engineering and Processing, 36, p. 397 (1997).
Sánchez, M., Technical Report - Access to Large-Scale Scientific Installations Program, Plataforma Solar de Almeria, Spain (1992).
Teixeira, A. C. S. C., Guardani, R. and Nascimento, C. A. O., Solar photochemical degradation of aminosilicones contained in liquid effluents. Process studies and neural network modeling, Industrial and Engineering Chemistry Research, 42, p.5751 (2003).
Will, I. B. S., Moraes, J. E. F., Teixeira, A. C. S. C., Guardani, R. and Nascimento, C.A.O., Photo-Fenton degradation of wastewater containing organic compounds in solar reactors. Separation and Purification Technology, 34, p.51 (2004).


![Figure 7: DOC/DOC 0 -time curves for experiments with DOC 0 = 500 mg C L -1 . B10 ([H 2 O 2 ] = 100 mmol L -1 ; [Fe(II)] = 0.2 mmol L -1 ); B11 ([H 2 O 2 ] = 188 mmol L -1 ; [Fe(II)] = 0.4 mmol L -1 ); B12 ([H 2 O 2 ] = 270 mmol L -1 ; [Fe(II)] =](https://thumb-eu.123doks.com/thumbv2/123dok_br/18894485.425965/9.918.281.645.687.904/figure-doc-doc-time-curves-experiments-doc-mmol.webp)
![Figure 8: Time evolution of UV absorption spectra. (a) B2 (DOC 0 = 100 mg C L -1 ; [H 2 O 2 ] = 150 mmol L -1 ; [Fe(II)] = 0.4 mmol L -1 ); (b) B9 (DOC 0 = 100 mg C L -1 ; [H 2 O 2 ] = 20 mmol L -1 ; [Fe(II)] = 0.04 mmol L -1 ); (c) B6 (DOC 0 = 100 mg](https://thumb-eu.123doks.com/thumbv2/123dok_br/18894485.425965/10.918.126.794.124.555/figure-time-evolution-absorption-spectra-doc-mmol-mmol.webp)
![Figure 9: (a) Time evolution of the accumulated mass of carbon removed for the experiments B11, F1, F2, and F3 ([H 2 O 2 ] = 188 mmol L -1 ; [Fe(II)] = 0.4 mmol L -1 )](https://thumb-eu.123doks.com/thumbv2/123dok_br/18894485.425965/11.918.128.804.124.344/figure-time-evolution-accumulated-mass-carbon-removed-experiments.webp)
