UNIVERSIDADE DE ÉVORA
ESCOLA DE CIÊNCIAS E TECNOLOGIA
DEPARTAMENTO DE QUÍMICA
Lipid lamellar mesostructures in
aqueous media
A study of the influence of temperature and ionic
environment on its stacking properties
JOANA RITA RIPADO VALÉRIO
Supervisor: Prof. Doctor EURICO MELO
Master in Chemistry
Specialization Area: Materials Chemistry Dissertation
UNIVERSIDADE DE ÉVORA
ESCOLA DE CIÊNCIAS E TECNOLOGIA
DEPARTAMENTO DE QUÍMICA
Mesoestruturas lamelares lipídicas em
meio aquoso
Estudos de empilhamento em função da temperatura e
força iónica.
JOANA RITA RIPADO VALÉRIO
Supervisão: Prof. Doutor EURICO MELO
Mestrado em Química
Área de especialização: Química de Materiais Dissertação
Évora, 2014
I
Agradecimentos
Porque um trabalho de investigação é impossível de realizar sozinho, várias são as pessoas/instituições que me ajudaram nesta caminhada, ou que me apoiaram fora dela:
Ao ITQB, FCT e DESY por me terem facilitado as infra-estruturas e o equipamento necessário para a realização deste trabalho.
Ao meu Orientador, Professor Eurico Melo, por me ter transmitido o gosto pela ciência e pela descoberta do saber. Foi um enorme privilégio ter trabalho com o Professor, não só pelos conhecimentos científicos que me transmitiu, mas também pela sua forma de estar na vida, que me tornou na pessoa que hoje sou. Obrigada Professor, pela sua inesgotável sabedoria e paciência, sem a sua ajuda este projeto tornar-se-ia praticamente impossível.
Aos professores que me lecionaram as unidades curriculares deste mestrado, em especial à Professora Manuela Carrott, obrigada pela colaboração, disponibilidade e pelos conhecimentos transmitidos.
Á Rita pela companhia, simpatia e dedicação no decorrer destes meses.
Ao Dr. Sérgio Funari pela experiência que me proporcionou, quer a nível científico como pessoal.
To Professor Gruebel for the opportunity to work at the HASYLAB. Á Catarina e restantes amigos do ITQB pela amizade, conversas e cafés.
Aos amigos e família pela enorme paciência e motivação que sempre me transmitiram.
Aos meus Pais, porque sem eles nada disto era possível e faria sentido. Ensinaram-me a ser Feliz!
Para a minha Irmã, por ser a minha melhor amiga. Ao Luís, por tudo.
III
Abstract
Biological membranes are self-associations of amphipathic bilayer-forming lipids in aqueous media, and their physicochemical properties reflect the characteristics of these lipids in interaction with cholesterol, proteins and other components.
In the work here reported we present: (i) A study of the thermal expansion of glycerophosphocholines by dynamic light scattering and its consequences for the analysis of X-ray diffraction, and (ii) The thermotropism of mixtures of ceramides with fatty acids and discuss the role of fatty acids for the properties of the stratum corneum lipid matrix.
We attained in (i) A novel interpretation for the lateral thermal expansion of lipid bilayers, how the chain characteristics may affect the expansion, and which are the consequences in bilayer stacking, and in (ii) Identify the modifications of molecular mesostructure of ceramide in excess water induced by ionized fatty acid at several ionic strength as a function of temperature.
V
Resumo
Título: Mesoestruturas lamelares lipídicas em meio aquoso. Estudos de empilhamento em
função da temperatura e força iónica
.
Membranas biológicas são associações de lípidos em bicamadas em meio aquoso, as suas propriedades físico-químicas refletem as características dos lípidos eles próprios, e da sua interação com colesterol, proteínas e outros componentes.
Neste trabalho apresenta-se: (i) O estudo da expansão térmica de glicerofosfocolinas por dispersão dinâmica de luz e as suas consequências analisadas por difração de raios-X, e (ii) O termotropismo de misturas de ceramidas com ácidos gordos e a discussão do papel destes nas propriedades da matriz lipídica do stratum corneum.
Em (i) Apresenta-se uma nova interpretação para a expansão térmica lateral das camadas lipídicas baseada na dinâmica das cadeias, e as suas consequências para o empilhamento de bicamadas (ii) Estuda-se as modificações da mesoestrutura de ceramidas em excesso de água induzidas pela adição de ácido gordo em função da força iónica e temperatura.
VII
Abbreviations List
a – cubic lattice parameter Al – area per lipid
a.u. – arbitrary units
C10-Cer - N-decanoyl-sphing-4-enine
C16-Cer - N-palmitoyl-D-erythro-sphingosine C24-Cer – N-lignoceroyl-D-erythro-sphingosine cac - critical aggregation concentration
CEMOVIS – cryo-electron microscopy of vitreous sections Cer - Ceramide
Chol - Cholesterol
d – distance between diffraction planes dB – bilayer distance
DEPE – 1,2, dielaidoyl-sn-glycero-3-phosphatidylethanolamine DESY - Deutsches Elektronen Synchrotron
DLS – dynamic light scattering
DSC – differential scanning calorimetry
DLPC - 1,2-dilauroyl-sn-Glycero-3-Phosphocholine DMPC - 1,2-dimyristoyl-sn-Glycero-3-Phosphocholine DOPC - 1,2-dioleoyl-sn-glycero-3-phosphocholine
dW – water spacing
e- elementary electronic charge (positive)
FA – fatty acid
FTIR – Fourier transform infrared spectroscopy FWHM – full width at half-maximum
GUV - giant unilamellar vesicles HI - straight hexagonal phase
HII - inverted hexagonal phase
HPLC – high performance liquid chromatography
h k l – Miller indices I – ionic strength
kB – Boltzmann´s constant
KC – bending modulus
LUV - large unilamellar vesicles Llamellar liquid crystalline phase Llamellar gel phase
L’ – lamellar gel tilted chains
Lc – lamellar crystalline phase
MI – normal micellar phase
MII – inverted micellar phase
VIII P – osmotic pressure PA - palmitic acid POPC - 1-palmitoyl-2-oleoyl-sn-glycero-3-phosphocholine POPE – 1-palmitoyl-2-oleoyl-sn-glycero-3-phosphoethanolamine. P - rippled phase
P’ – rippled phase tilted chains
pKa – logarithm of the acid dissociation constant QI – normal cubic phase
QII – inverted cubic phase
R – radius of curvature
R0 – spontaneous radius of curvature.
s - reciprocal stacking distance (s = 1/d)
SAXD - small angle X-ray diffraction SUV- small unilamellar vesicles
Tm – temperature of the main phase transition
Th – lamellar-nonlamellar transition temperature
TI – temperature of isotropic conversion to the micellar phase.
WAXD – wide angle X-ray diffraction
IX
Table of Contents
I. Introduction 1
I.1 The lipids used 3
I.2. Mesostructures of lipid aggregates 5
I.3. Area per lipid 10
I.4. Interaction between lipid bilayers 12
I.5. Structure of ceramides 16
I.6. Objectives 19
II. Thermal area expansion of phosphocholines bilayers 21
II.1. Measurement of expansion by DLS. Results and discussion: 23 i) Results from dynamic light scattering 23
ii) Discussion 27
II.2. Consequences of bilayer expansion for X-ray measurements. Results and discussion: 32 (i) SAXD of MLV and MLV-REV in water 32
(ii) Further comments on the experimental observations 43
II.3. General Conclusion 46 III. Ceramide : fatty acid in excess water . The case of palmitoyl ceramide and palmitic acid 49
III.1. Cer16:PA at 20ºC in excess water at pH = 9 as a function of ionic strength and PA molarfraction. Results and discussion: 51
(i) C16-Cer meso and molecular structure in excess water 51
(ii) Pure Palmitic acid structure 53
(iii) C16-Cer: Palmitic Acid 70:30 structure as a function of I 53
(iv) C16-Cer : PA structure as a function of PA molar fraction for I = 125 mM 58
III.2. Thermotropic behavior of Cer16:PA at pH = 9. Results and discussion: 60
(i) C16-Cer meso and molecular structure in excess water 60 (ii) Coexistence of thin and thick phase 61
X
(iii) C16-Cer: Palmitic acid (8:2) structure as a function I 63
(iv) C16-Cer: Palmitic acid (7:3) structure as a function of I 65 (v) C16-Cer: Palmitic acid (5:5) structure as a function of I 67 III.3. Preliminary studies with C10-Cer 68
III.4. General Conclusion 69
III.5. Further work 70
IV Experimental methods 73
IV.1. Materials 75
(i) Origin of reagents 75
(ii) Lipid purification 75
IV.2. Preparation of lipid aggregation in aqueous media 76
(i) Preparation of MLV 76
(ii) Preparation of MLV-REVs 77
(iii) Preparation of extrusion LUV (LUVET) 77
(iv) Samples for DLS. 78
(v) Samples for X-ray. 78
IV.3. Methodologies 78
(i) Dynamic light scattering. 78
(ii) X-Ray diffraction 79
XI
List of Figures
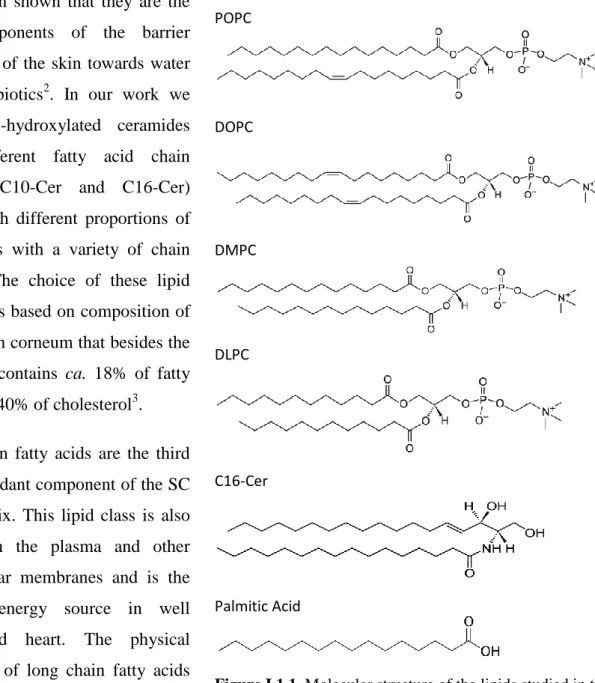
Figure I.1.1. Molecular structure of the lipids studied in this investigation 4
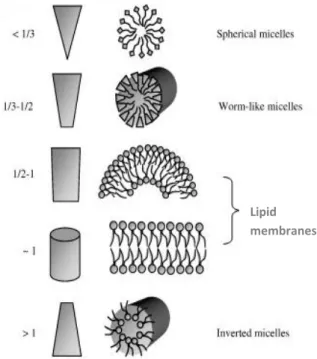
Figure I.2.1 The packing parameter for the most common structures formed 6
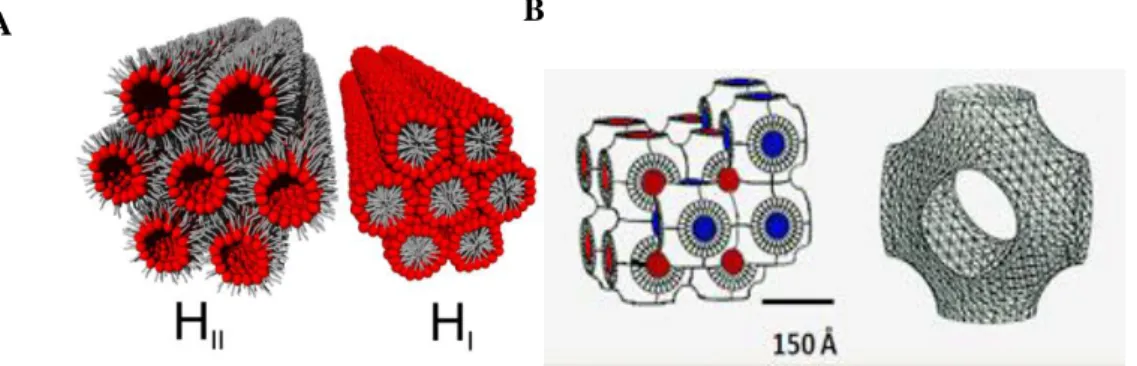
Figure I.2.2. Structures of an a) inverted (HII) and (HI) hexagonal and b) bilayer cubic phases 8
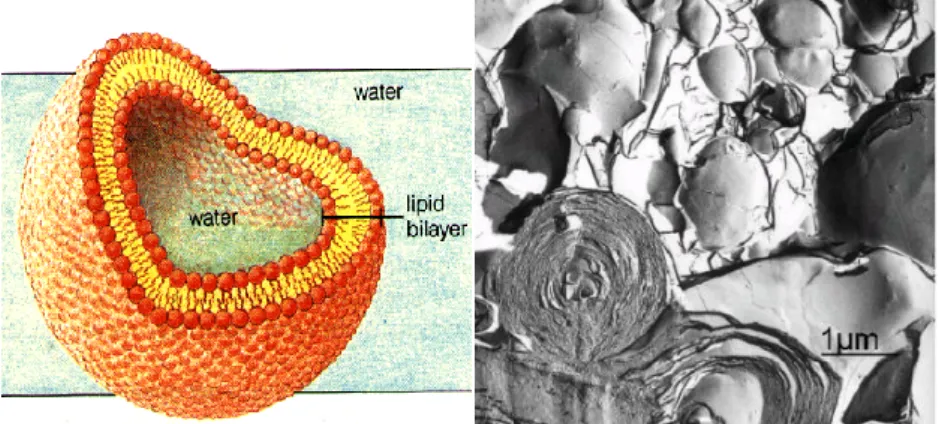
Figure I.2.3. Structures of a unilamellar vesicle and an onion-like multilamellar liposomes 9
Figure I.2.4 Schematic drawing of lipid–water phases 10
Figure I.4.1. Schematic presentation of two neighboring lipid bilayers 12
Figure I.5.1. CEMOVIS of the SC lipid matrix 16
Figure I.5.2. Molecular packing arrangements of hydroxyceramides 17
Figure I.5.3. Molecular packing arrangements of hydroxyceramides 18
Figure II.1.1. Dependence of the vesicle radius, RV, calculated from the hydrodynamic radius acquired by DLS of unilamellar liposomes with temperature: a)DOPC b)POPC c)DMPC d)DLPC 25
Figure II.1.2. Dependence of thermal area expansivity, A of lipid bilayers on the temperature for DOPC, POPC, DMPC and DLPC 27
Figure II.1.3. Dependence of thermal area expansivity, A of lipid bilayers represented as a function of the reduced temperature 30
Figure II.1.4. Plot of the values of area per lipid, AL, of DOPC and DMPC, as a function of temperature from the data obtained by Costigan et al 31
Figure II.2.1. Figure II.2.1. In panel A) the thermal evolution of the sample of DOPC MLV shows the formation of two main peaks, and a shoulder at lower reciprocal distances values, which begin to be visible at ca. 40 ºC. The shoulder eventually originates the long tail described by a Lorentzian at 0.174 nm–1 at 86 ºC, panel B). From 4 to 40 ºC the diffraction fits to a single Lorentzian as shown for 4 ºC in B), but increasing the temperature at the rate of 1 ºC/min, at least 2 or 3 components are needed as presented in B) for 86 ºC 33
Figure II.2.2. Evolution of the 1st order peak of the SAXD with the temperature, increased at a rate of 1 ºC/min, of a sample of MLV-REV of DOPC in water 37
XII
Figure II.2.3. 1st order SAXD peak of samples prepared, maintained and measured at the same temperature 38 Figure II.2.4. Diffractogram of the sample heated from 20 to 70 ºC and maintained at this temperature for 1 h, panel A. In panel B the first and last measurement of the 1st order peak at 70 ºC 40 Figure II.2.5. Schematic representation of the effect of the increase of 50 ºC on the geometry of DOPC spherical vesicles considering negligible the exchange of lipid between bilayers freely permeable to water 42 Figure II.2.6. Dependence on time and temperature of the maximum reciprocal distance, s, and intensity at peak maximum of the 1st order diffraction 45 Figure III.1.1. SAXD and WAXD measurements at 20ºC from pure C16-Cer with 200mM 52
Figure III.1.2. SAXD (A) and WAXD (B) X-Ray diffraction patterns from pure Palmitic acid pH = 9 20ºC and I of 125mM 53 Figure III.1.3. SAXD signals of the C16-Cer:PA 70:30 bilayers at 20 ºC for the I of the aqueous medium tested in this work 55 Figure III.1.4. A typical WAXD signal of the C16-Cer:PA 70:30 bilayers at 20 ºC 56 Figure III.1.5. Variation of the lamellar distance, d, of the C16-Cer:PA 70:30 bilayers in excess aqueous media at pH = 9.0 obtained by SAXD with the ionic strength of the aqueous medium. Each point represents an independent measurement of an independently prepared sample. 57 Figure III.1.6. Calculated forces for the interaction of 70:30 mixtures of C16-Cer with PA for I = 125 mM and pH = 9.0. The dashed curves represent the individual forces: hydration repulsion (green), electrostatic repulsion (red) and London-van der Waals attraction (blue). The solid line is the sum of these three components and crosses the zero force corresponding to the minimum of energy at 9.23 nm. 58 Figure III.1.7 Plot of the repeat distance determined for C16-Cer bilayers containing different amounts of PA for I = 125 mM and pH = 9 59 Figure III.1.8. SAXD (A) and WAXD (B) signals of the C16-Cer:PA 1:1 bilayers at 20 ºC for the I of the buffer medium of 76 mM and pH = 9 59 Figure III.2.1. SAXD and WAXD measurements as a function of temperature from pure C16-Cer 60
XIII Figure III.2.2. SAXD measurement of a mixture of C16-Cer : PA in a proportion of 7:3 62
Figure III.2.3. SAXD X-Ray diffraction patterns from Cer.16:FA16 (8:2) during a temperature scanning from 20-98°C at pH=9 with a variable I 64 Figure III.2.4. SAXD X-Ray diffraction patterns from Cer.16:FA16 (7:3) during a temperature scanning from 20-98°C at pH=9 with a variable I 66 Figure III.2.5. SAXD X-Ray diffraction patterns from Cer.16:FA16 (5:5) during a temperature scanning from 20-98°C at pH=9 with a variable I 67 Figure III.3.1.SAXD (A) and WAXD (B) signals of the C10-Cer bilayers at 20 ºC for the I of the aqueous medium of 125 mM and pH = 9 69
List of Tables
Table II.1.1. Hydrodynamic radius, RV, at 30 ºC determined from DLS measurements of the LUVET
prepared in this work. The values, from the literature, for the bending modulus, Kc, and for the lysis
tension, l, obtained from pipette aspiration, for the bilayers of the same lipids are also present 24
Table II.2.1. Data obtained from the Lorentzian decomposition of SAXD signals at low and high temperature for the lipids and several aqueous media and method of preparation characteristics 34 Table III.1.1. SAXD and WAXD maxima for 200 mM, pH = 9.0 and 20 ºC 52 Table III.1.2. Fraction of non-protonated PA headgroups, supposed located at the interface of the ceramide bilayers 54
1
3
Lipids are important molecules for the backbone of many biological structures. In particular, membrane-forming lipids play the main role in the outer layer of cells and in the compartmentalization of the eukaryotic cells. Their role as barrier components is not confined to cell membranes. The molecules that nature chooses as main components for the protection of organisms from external aggression are also lipids. The external envelope of all mammals is a layer of lipids and dead cells called the stratum corneum, SC.
In our work we have dealt with several glycerophospholipids and the physical chemical properties of the bilayers by them formed. We also studied ceramides, a class of sphingolipids that are the key components of the SC lipid matrix.
I.1 The lipids used
The above mentioned lipids are amphiphilic molecules having a polar head group and two hydrocarbon tails that are hydrophobic.
In Figure I.1.1 we show the several classes of lipids that constitute the object of the research presented in this report. The head groups of DMPC, POPC, DLPC and the DOPC are derivatives of phosphatidylglycerol. The choline group is bound to the carbon 3 of glycerol backbone and the carbons 1 and 2 are ester linked to fatty acids. The phosphocholines in Figure I.1.1 show the four main types of chain substitution. In DMPC and DLPC the two hydrocarbon chains are saturated myristoyl and lauroyl acid respectively. Both lipids are symmetric in which concerns chain length and saturation. While in DOPC the two monounsaturated chains are of oleoyl acid. In POPC, carbon 1 is substituted with palmitic acid while in position 2 there is oleic chain. This kind of lipids has been recently denominated hybrid lipids1. It is worth mentioning that POPC is the more abundant lipid in animal cell membranes and along the last years a convincement is developed in the scientific community that chemical physical particularities of hybrid lipids are the reason for nature to choose them as the main component of many bilayers membranes.
Ceramides are a sub-class of sphingolipids composed of the amino alcohol D-erythro sphingosine esterified to a long chain fatty acid. There are variants hydroxyl substituted but they are not used in the present work. In cells, ceramides are kwon to be involved in several regulation phenomena but, in general, their concentration is very small. Contrasting with this
4
low abundance in normal tissues, 40% of the lipids constitutive of the uppermost layer of the epidermis of mammals are ceramides2,3
It has been shown that they are the key components of the barrier properties of the skin towards water and xenobiotics2. In our work we used non-hydroxylated ceramides with different fatty acid chain lengths (C10-Cer and C16-Cer) mixed with different proportions of fatty acids with a variety of chain lengths. The choice of these lipid mixtures is based on composition of the stratum corneum that besides the ceramide contains ca. 18% of fatty acids and 40% of cholesterol3.
Long chain fatty acids are the third most abundant component of the SC lipid matrix. This lipid class is also present in the plasma and other intracellular membranes and is the primary energy source in well oxygenated heart. The physical properties of long chain fatty acids and its phase-behavior in the presence of water are strongly dependent on its ionization sate.
POPC DOPC DMPC DLPC C16-Cer Palmitic Acid
Figure I.1.1. Molecular structure of the lipids studied in this investigation.
5
I.2. Mesostructures of lipid aggregates
In aqueous solution phospholipids and sphingolipids have a very low critical aggregation concentration, cac, typically lower than picomolar4,5. While at first sight counterintuitive, this low solubility is not rooted on unfavorable enthalpic interaction between the hydrocarbons and water, but mainly due to entropic reasons. When dispersed in water the disruption of the water structure and formation of an ice-like nanotube of structured water around the hydrocarbon chain is highly unfavorable from an entropic point of view; an effect know since 1937 as “the hydrophobic effect”6, 7, 8.
The geometry acquired by the aggregates of amphiphilic molecules is dominated by the geometrical shape of the amphiphile and can be characterized by the critical packing parameter, P, defined as 9, 10:
where V is the molar volume of the acyl chains, a the molar cross-section of the polar head groups and the l the length of the molecule when extended. The more common structures formed are represented in Figure I.2.1. But many others are possible, namely those where the lipid molecules form cylinders with the polar groups facing outside, the hexagonal HI, or
inside, the inverted hexagonal, HII, of which the HII has been detected in our work. We have
also observed several cubic phases where both the lipid and the aqueous phase are bicontinuous, Figure I.2.2.
6
For lipids with packing parameters differing from unity, in excess water, thermotropic transitions frequently take place from lamellar to non-lamellar phases. In this case, above the chain-melting transition, the general sequence for two-chain phospholipids is:
where Th is the lamellar-nonlamellar transition temperature, and TI is the temperature of
isotropic conversion to the inverted micellar phase, MII 11.
The nonlamellar lipid phases are found normally in the fluid state, because this allows greater flexibility in molecular packing. Normal phases are usually found for single lipids with larger headgroups, at high water contents. Inverse phases are usually for two-chain lipids with small headgroups, as it is the case of ceramides, and at low water contents.
The thermodynamics of these transitions is generally determined by the energetic, structural and steric contributions and modulated by non-lamellar structure of the fluid phase12, 13. In the fluid lipid phase with radius of curvature R, it is possible to determine the tendency of
Figure I.2.1. The packing parameter for the most common structures formed10.
Figure 1.1. The packing parameter for the most common structures formed11.
Figure 1.2. – The packing parameter for the most common structures formed11.
Lipid membranes
7
spontaneous curvature, R0, and consequently the formation of normal (R0 < 0 ) or inverted
structures(R0 > 0 )14.
The hexagonal packing of the water cylinders (HII phases), or lipid cylinders (HI phases) gives
repeat spacings:
In the characteristics ratios 1:1; 3:1; 2:1; 7:1; 3, where the h k is the Miller indices of the two dimensional hexagonal lattice plans11.
For cubic phases, the X-ray repeat spacings are related to the cubic lattice constant, a, by:
Where h k and l are the Miller indices of the planes from which the Bragg reflections arise. Cubic phase either are bicontinuos if both, water and lipid components are continuous, and consist of a hydrated bilayer motif, or are discontinuous in either, the water or lipid components being composed of inverse or normal micelles, respectively11.
The bicontinuous cubic phases have specific space groups Pn3m, Ia3d, and Im3m, where the minimal surface lies at the midsurface in the water continuum, and consequently the lipid-water interfaces can reasonably be described by networks of interconnected rods. These cubic phases can appear in restricted regions of the phase diagram, and may also be present in excess water.
Cubic phases in excess water, normally, appear between the lamellar and inverted hexagonal phases and may frequently display metastability, as was found for phosphatidylethanolamines15 and lysophosphatidylcholines16. Additionally, Quinn and collaborators17, explained the formation of a Pn3m cubic phase, by X-ray, in a system with POPE; this cubic phase was stable and coexisted with inverted hexagonal or lamellar phases. This specific cubic phase it was also found in a DEPE system18.
Inverse cubic phases (QII) are produced by inverse micelles and, usually, appear following the
HII phase as it happens with unsaturated phosphatidylcholines11.
(3)
8
When dispersed in excess water the glycerophosphocholines form spontaneously closed lamellar phases named vesicles. The formation of closed structures avoids the contact between the hydrophobic region and water, Figure I.2.3. In fact, the structures formed spontaneously are onion-like multilamellar liposomes, MLV, consisting of larger vesicles encapsulating smaller ones with water between the bilayers, Figure I.2.3.
The simplicity of MLV preparation due to their spontaneous formation upon addition of the aqueous media to the lipid “out of the flask” makes them the choice for research and pharmaceutical application whenever possible. When two distinct compartments are needed, separated by a unique stable bilayer or if for some reason the stacking of several layers is inconvenient, other more specific preparation methods are used. However, multilamellar aggregates are the only choice for techniques that rely on the regular piling up of the bilayers such as in the case of small angle X-ray powder diffraction analysis (SAXD).
Figure I.2.2. Structures of: A) inverted (HII) and normal (HI) hexagonal phases. B) Im3m
cubic phase. Adapted from ref. 19.
As in general, in bilayers the physical state depends on temperature20. At low temperatures the saturated chains are in the all-trans configuration rigidly arranged as in a conventional crystal: the lamellar crystalline phase, Lc19,21. The crystalline arrangement of the carbon atoms is
confirmed by the sharp peaks observed in wide angle X-ray diffraction. At higher temperatures the large rotational and translational freedom of the lipid chains together with a fast trans-gauche isomerization lead to a system that can be correctly named as a liquid crystal: the lamellar fluid phase, L19,21. In some lipids, usually those with a head group cross-section larger than that of the tails (P > 1), e.g. saturated phosphocholines, there are intermediate states one of them called rippled phase and the other traditionally named gel
9
phase, Pand L respectively, or P’ and L’ if the chains are not perpendicular to the bilayer
plane21.These different structures are depicted in Figure I.2.4.
The thermotropic behavior above described is valid for pure lipids, in the case of lipid mixtures there are phase separations that are in every aspect similar to what is observed in a binary, ternary, etc. phase diagram for three dimensional systems as they are described in the usual textbooks. The only particularity found is that in the phospholipid lamellar temperature/composition regions were two phases coexist on the plane of the bilayer the phases are micro-disperse22.
Figure I.2.3. Structures of a unilamellar vesicle and an onion-like multilamellar liposomes.
That means that while in three dimensions the energy of the system is minimized by the reduction of the surface energy, leading to a complete macroscopic separation of the phases, in a bilayer, one phase forms small patches dispersed in a continuum of the other phase, not minimizing the line tension. The reason for this is out of the scope of the present dissertation. The MLV are useful for several types of measurements namely for X-ray studies, however, its often required to have single layer vesicles that according to their size are denominated giant, (5-300m), large, ( 50-500 nm) or small (20nm-50nm), respectively abbreviated as GUV, LUV and SUV 23. Several methods have been proposed to make each of these types of unilamellar liposomes. In our work we have used MLV, and LUV obtained by extrusion, LUVET. The diameter of LUVET is relatively small of the order of 100 nm 24,25. In one particular case we needed oligolamellar LUV (with a large central aqueous pool) that were prepared by a variant of the technique known as reverse phase evaporation 26,27.
10
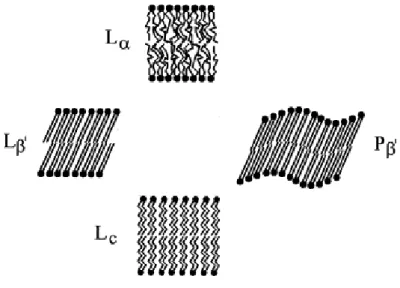
Figure I.2.4. Schematic drawing of lipid–water phases. Lc, lamellar
crystalline; Lβ′, Pβ′, lamellar gel; Lα, lamellar liquid–crystalline (Adapted
from ref.28).
Ceramides also form lamellar structures but because of being crystalline until very high temperatures and/or because of the very low hydration – thin water layer between lamellae – do not form closed liposomes29.
I.3. Area per lipid
Accurate experimental determination of second-order thermodynamic properties of lipid bilayers against temperature is of high interest for the understanding of their thermophysical properties, since it allows characterizing their thermodynamic behavior, which, evidently, has important consequences from both a fundamental and an applied point of view. They are important elements in the study of model bilayers and their interactions with membrane proteins and other amphipathic molecules, and are an input in computer simulations30. Quite extensive discussions about primary parameters such as bilayer thickness and area per lipid molecule, how to define them and which methods are more reliable for their determination, exist since the early days of research on phospholipid bilayers 31, 32. However, the evolution of properties with temperature, or other physical parameters, was mainly addressed from a mechanistic point of view by E. Evans and his collaborators using micropipette aspiration of GUV33.
11
The transversal thermal expansivity of bilayers is straightforward to obtain directly from the analysis of the electron density profiles calculated from SAXD data of stacked bilayers as a function of temperature. Many authors have worked on this subject. The lateral thermal expansivity is another matter since, besides the thickness of the bilayer it must also rely in very accurate measurements of the specific mass of the lipid-water mixture at equilibrium, measurements that are very delicate and difficult to obtain with enough accuracy.
We have recently proposed34 the use of dynamic light scattering as an expedite method for the determination of lateral thermal expansion and presented a preliminary application to the thermal behavior of DOPC. Our results were in reasonable accordance with those already published for the same lipid; however, the variation of the thermal expansivity with temperature was quite a novelty. We based our molecular interpretation of the data on the recent studies of the isobaric thermal behavior of hydrocarbons. According to the experiments and molecular simulations of Troncoso et al.35 the isobaric thermal expansivity of hydrocarbons go through a minimum as we observed for DOPC bilayers.
In this investigation, our objective is to make a comparative study of the isobaric thermal expansion properties of bilayers in the L phase of pure synthetic lipids, namely DOPC, POPC, DLPC and DMPC. As previously proposed we use DLS for the determination of the area expansion coefficient of lipid bilayers. The measurements are based on the evaluation of the variation of the hydrodynamic radius with temperature of unilamellar vesicles obtained by extrusion, LUVET. For the area calculation the vesicles are supposed spherical.
It was demonstrated that repetitive extrusion of multilamellar lipid vesicles in the L phase through filters of 100 nm, or smaller, pore produced a population of homogeneously sized unilamellar vesicles25,36. These vesicles are reported to be perfectly spherical if made in pure water and prolate if salt is added due to a difference between the internal and external ion concentration of unclear origin37. Being unilamellar, spherical and monodisperse the extrusion LUV are the perfect system for our intended measurements.
12
I.4. Interactions between lipid bilayers
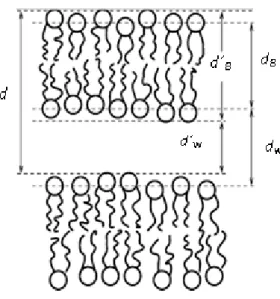
When lipids are mixed with water form smectic liquid crystals, structures that can be thought as a group of stacked bilayers as can be seen in Figure I.4.1. One of the major goals in studies related with membranes is to understand and describe the interaction between two adjacent membranes, such as the lamellar repeat spacing d and more specifically, the water spacing, defined as dW or d´W, as well as the bilayers thickness, indicated by subscript B, , represented
in Figure I.4.1, satisfying the equation d = dB + dW38.
If in equilibrium, the average aqueous spacing between bilayers should be regular and controlled by the interplay between attractive van der Waals forces and the joint effect of several repulsive phenomena. The repulsive forces have several origins: entropically driven steric forces 39,40,41between headgroups and water frequently called hydration forces, spacing due to thermal undulation, and, for charged bilayers, the double-layer repulsion modeled by the DLVO theory.
Figure I.4.1. Schematic presentation of two neighboring lipid bilayers (Adapted from ref.38).
Local distance variation due to undulations, average all over the system and, in practical terms, is reflected in the SAXD experiments by the extended asymmetric lateral wings of the peaks and is responsible for the difficulty in detecting and characterizing the higher order diffractions 42,43, specially at temperatures above 50 ºC. It is not important for the L and LC
13
Consequently the net pressure between the bilayers is given by11:
P
R= P
hyd+ P
fl+ P
ES- |P
vdW|
Attraction force: The van der Waals contribution is the only long range attractive force, and
is what maintains the bilayers together. This force can be quantified by the London-Hamaker constant also called the Hamaker constant, H 44. The attractive pressure between the bilayer surfaces is given by11:
The Hamaker constant is positive and has been estimated to lie in the range 10-14 – 10-13 J11,45 between two planar lipid surfaces. It is worth to notice that while the London potential interaction between two molecules/atoms depends inversely from the 6th power of the distance the dispersion forces between macroscopic surfaces are long-range forces what explains why many bilayer system do not swell indefinitely when water is added.
Hydration repulsion: Even in the absence of undulation, dW is nonzero what implies the
existence of some repulsive force to balance the van der Waals attraction. To this force, whose origin is not totally clear, has been given the name of hydration force Phyd. Rand, Parsegian and co-workers, have proposed a technique that by measuring d and dW while
tuning the osmotic pressure, P allows the quantification of this repulsive force 45.
The hydration force, Phyd may be quantified by an exponentially decaying repulsive pressure of correlation length, λhyd 45. These repulsions normally have short ranges, and are supposed to arise from the polarization of the water molecules at the bilayer surface46; it dominates for distances in the range dW = 0.4 – 0.8 nm47.
Undulation repulsion: When the bilayers are flexible, there is another important repulsive
force, called fluctuation force (Pfl), where the undulation modes play a role48.
(6) (5)
14
The fluctuation force arises from thermally excited bending fluctuations of the lipid bilayer, which result in a decrease in entropy when they are suppressed by the approach between two bilayers 48,49
. Helfrich analyzed this force in the absence of van der Waals or hydration interactions, only remaining the steric interactions caused by the collision of bilayers48
. This repulsive force is important for fluid bilayers at intermediate water spacings from dW =
0.8-1.0 nm up to the equilibrium separation47.
Electrostatic repulsion: For charged bilayers in low salt concentration, it has also to be
considered the repulsive electrostatic interaction between the two interfaces. These interfaces are separated by a layer of water that contains an amount of ions that depend of the ionic strength and pH of the surrounding aqueous media. However, the concentration of ions, protons and other, near the interface depends on, and modulates the interface potential, 0. In
our experiments we used ceramide mixed with fatty acid at pH = 9.0. At this pH the fatty acid should be 100% ionized since its pKa is around 5 in bulk water. It is not so in the vicinity of
the membrane for two reasons: first, the [H+] concentration at the interface, [H+]i, is not
identical to that in bulk, [H+]w, which is stabilized by an adequate buffer; second, because the
molecular environment of the carboxylate group at the interface is diverse from bulk water resulting in a pKa at the interface, pKai, different from the homogeneous aqueous pKaw. The
correction for the first effect is done, as we describe below, using the theory of the diffuse electro-chemical double layer developed by Gouy, Chapman, Debye and Hückel in the beginning of the XXth century 44. The determination of pKai is much more challenging and is
traditionally approached by considering that the interface is adequately simulated by a 1,4-dioxane:water mixture with dielectric constant of about 40, an approach that is not convincing. Much better is to stick to values of pKa obtained in the real systems by
non-perturbing techniques such as FTIR of NMR. We are fortunate because our exact system was studied by Gomez Fernandez and Vilallain50as we detail below.
The fraction of fatty acid ionized at the bilayer surface, that will determine its potential, can be calculated for a known bulk proton concentration, [H+]w, the fraction of fatty acid ionized,
with acidic constant Kai, is given by:
15 + w 0 ai 1 1 [H ] K
where, 0 is the surface enhancement factor, that is related to the potential at the interface, , by: 0 0 exp B e k T
where e is the positive elementary charge and the other constants have their usual meaning. While it may be considered a rough approximation, because the water layer between ceramide bilayers is thin, we will calculate the potential created by the ionized fatty acid, considered at the surface of the membrane, with the Gouy-Chapman formalism51:
0 2 2 sinh B L k T b e A
where b is the Bjerrum length, given by be2 4 0 k TB , and the reciprocal screening length, , by 8 b[S]. The value of AL, the average area per charged lipid, was calculated for the mixture of C16-Cer:Ch:PA 44:38:18 based on the relative proportions and the area occupied by each molecular species. For C16-Cer an area per molecule of 41 Å2 was calculated from the lattice parameters52, and 20.2 Å2 for PA (taken from the discussion of Casilla et al. 53 on fatty acids cross section), resulting in an approximate area per PA molecule of 180 Å2. The Debye screening length depends from the concentration of the 1:1 electrolyte, [S], and the value of the relative static permittivity, , was taken as that of water, = 80. All the other parameters have the usual meaning.
Of course the equations (9) to (11) are implicit in because the interface potential depends on the fraction of ionized fatty acid which, in turn, depends on the product [H+]w0, the effective
proton concentration at the interface, [H+]i. Therefore, an iterative calculation is carried out to
obtain and for a set of given conditions, AL, [H+]w and [S].
Once the conditions of the interface are known it is possible to calculate the electrostatic repulsive pressure that can be approximated by an exponentially dependent screening54:
P
ES= 64 [s]
k
BT tanh
2(e
/ 4k
BT) exp (- k
d
W)
(12) (9) (10) (11)16
At low surface potentials, the electrostatic pressure for large bilayer separations may be further approximated by11:
where s is the surface charge density.
I.5. Structure of ceramides
Over the past few decades, ceramides were mainly studied in the context of the only biological tissue where they were well-known to be structural ingredients: the lipid matrix of the stratum corneum (SC), the uppermost
layer of the skin of mammals. The SC lipids, ceramides, fatty acids and cholesterol, self-organize in lamellar structures that, since long, have been attributed the remarkable thickness of ca. 13 nm. The details of the molecular organization of these lamellae are still unknown. There are many works dealing with these, or related, lipid mixtures, but most of them use complex lipid blends and focus not on the lipids themselves but on replicating/explaining the properties of the SC55 However more recent images of the
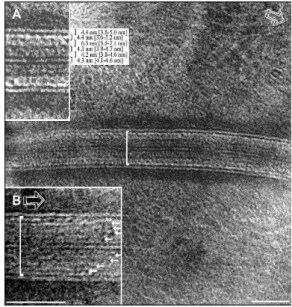
SC obtained by CEMOVIS, Figure I.5.1, show a lamellar repeat distance that seems built from 4.2 nm thick subunits not all of them with the same electron density forming multilamellar stacks, not limited to 13 nm. 56.
A highly relevant and exhaustive study of synthetic C16-Cer was presented by Shah et al.57, who examined its thermotropism and structure by DSC, SAXD, and WAXS in the presence and absence of water. Fourier transform infrared (FTIR) has been used for the study of short-range structure and dynamics of C16-Cer in aggregates58,59,60. Comparison of the dependence of the chain dynamics and thermotropic properties of C14-Cer, C16-Cer, C18-Cer, and
C20-(13)
Figure I.5.1. CEMOVIS of the SC lipid matrix 55.
Figure 1.6. Structure of SC lipid matrix.
17
Cer using FTIR show little dependence on chain length, at least much weaker than that in equivalent cholines59.The work of Shah et al. (1995) was complemented more recently by Souza et al. 52,61 and many questions were left open concerning the effect of the addition of fatty acid to the ceramide plus cholesterol mixture.
The pH of the SC changes in the normal to the skin surface from about 7 in the inner layers to 5.6 in the external surface. This pH gradient exists across a region as thin as 10 m. The FA is at least partially ionized and its carboxyl group necessarily in contact with water. So, the question remains where is the FA located in the structures depicted in the Figure I.5.1.
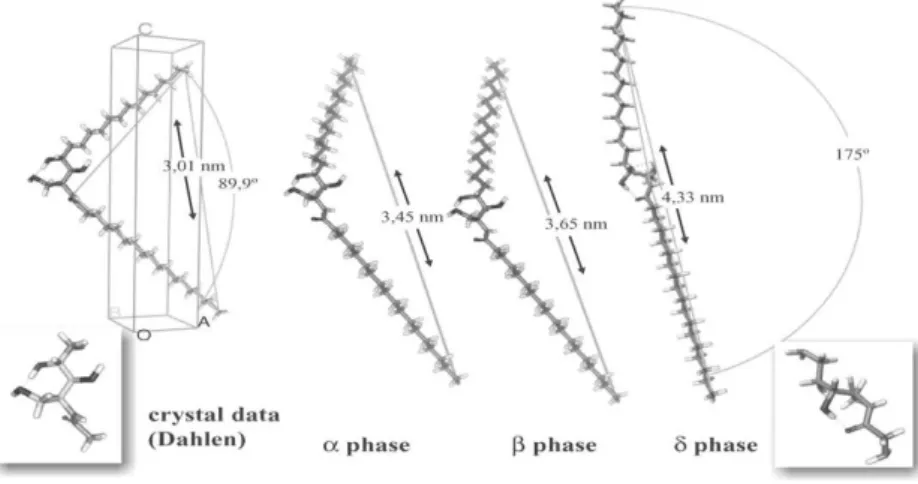
In many aspects ceramides are quite particular in their mesoscopic arrangements as first demonstrated by the pioneering work of Paschen and Dahlen62. These authors showed that, contrarily to the predictions of Langmuir, hydroxylceramides, namely with 18 and 24 carbons, may adopt a splayed conformation in which the two hydrocarbon chains, instead of the parallel arrangement characteristic of the common amphiphilic lipids, diverge in a V shape adopting different angles between the two chains that depend of the temperature or thermal history of the sample, Figure I.5.2. Another particularity of the ceramides is their high transition temperature at which they undergo a transition from a crystalline lamellar phase to a liquid crystal52,62. Therefore, ceramides with chains longer than 14 carbons are crystalline in all or nearly all temperature range of the stability of water in the liquid phase at normal pressure. Again, this makes the ceramides unusual among biological membrane-forming lipids that, even in conditions where the crystalline lateral arrangement is thermodynamically stable, remain trapped in a metastable state, either liquid crystalline or the so called “gel state”.
18
Joining the two informations, the splayed structure tendency of ceramides and the CEMOVIS pictures, we raised the question of the characteristics of the mesoscopic arrangement of ceramide:fatty acid mixtures in aqueous media.
Preliminary work obtained by us63 and by Souza et al.52, lead to suspect that non-hydroxylated ceramides could also organize in the same splayed conformation of the hydroxylated ceramides. If it was the case, this could explain the detection of
what is usually know in the SC literature as “thick phase”. This thick phase could result from the disruption at regular intervals of the structure created by the splayed ceramides, Figure I.5.3. These intervals can in certain conditions equal the observed 13 nm obtained by many authors including us.
One of the major goals of our work was to check the consistence of this hypothesis, with non-hydroxylated ceramides. The reader may question why the use of non-hydroxylated instead of hydroxylated ceramides. This is because in our laboratory we are mainly interested on the properties of non-hydroxylated ceramides with which we have a quite large experience. No doubt that it would be interesting to expand this work to the case of their hydroxylated counterparts.
The thermotropism of pure synthetic ceramide C16 has been
already studied52, it was found that C16-Cer forms a lamellar crystalline phase, that melts at 93 ºC to give a lamellar liquid crystalline phase. On the other hand, mixtures of ceramides with other lipids in the presence of water are the key components of the structure of the lipid matrix of the epidermal layer and are involved in lateral phase separation process occurring in lipid membranes.
To complete our study we also decided investigate the thermotropism of ceramide C16 to which palmitic acid is progressively added as a function of ionic strength using small angle X-ray powder diffraction
When fatty acids are added to ceramide it may be expected that they can substitute one of the ceramide chains without much structural distortion. Our experiments were made at pH = 9, Figure I.5.3. Molecular packing arrangements of hydroxylated ceramides.
19
theoretically allowing complete ionization of the fatty acid (see a detailed analysis in point I.4).
The thermotropic phase behavior of fatty acids is already studied64 and is influenced by their lyotropism.
When a neutral fatty acid, with a chain length of at least C16, is added to phosphatidylcholines, an inverted hexagonal phase is induced upon system melting, because of an excess of the acyl chain cross section65,66.
The formation of HII phases, in the presence of fatty acid, is not unusual in mixtures of
ceramide61, phosphocholines and phosphoetilamines at high temperatures 65,67,68.
I.6. Objectives
In this work we will made a comparative study of the thermal area expansion of the lipid bilayers, using the methodology developed by us for measuring by dynamic light scattering the temperature dependence of the hydrodynamic radii of unilamellar monodisperse populations of LUV.
The measurement is based on the evaluation of the variation of the surface area of unilamellar vesicles obtained by extrusion through 100 nm membranes as a function of temperature. In this investigation, we will report the structural and thermal properties of phospholipid bilayers in the fluid phase, namely those formed by a doubly unsaturated lipid, DOPC, an hybrid lipid, POPC, and two saturated lipids, DMPC and DLPC.
A discussion of the molecular mechanism of thermal expansion and a comparison of the behavior of the different lipids is the main goal of our work.
One of the consequences of the thermal bilayer expansion are the “since ever” observed irregularities in the SAXD measurements as a function of temperature obtained with many lipids that were not understandable until our study. By the time we did this research this abnormal behavior had never been reported in the literature, but was a well-known problem in the lipid community working with X-ray data. We tried to check the several hypotheses raised by different research groups to explain this unexpected misbehavior.
20
Another work presented in this dissertation refers to the testing of the above mentioned hypothesis of arrangement of ceramides mixed with fatty acid in excess water. As already said, ceramides organize in lamellar structures but do not form closed vesicles. Compared with common membrane-forming lipids, ceramides have the particularity of being in Lc state
until temperatures much above physiological. Compared with phosphocholines they have a much less polar head group which results in a much lower hydration. It is not even perfectly clear from what exists in the literature if in excess water the lamellar structures formed involve or not the existence of interlamellar water. A possible conformation has been determined by Pascher and Dahlen62 involving the two hydrocarbon tails of the single ceramide been separated each one pertaining to a different monolayer. This very rare spayed conformation was proved for hydroxyceramides but never clearly proved if non-hydroxyceramide, e.g. the C16-Cer used in our work, also adopt this arrangement. The first step in this study is to understand the structure of a mixture of C16-Cer and FA at 20ºC. We have remarked that the mixtures of ceramide C16 and PA have a rich thermotropic polymorphism. Another goal of our study was to characterize the structure of the intermediates in the thermotropic transitions of ceramide: fatty acid mixtures.
21
II. Thermal area expansion of
phosphocholines bilayers
23
In this chapter we will present a thermotropic study of the area expansion of unsaturated and saturated phosphocholines: DOPC, POPC, DMPC and DLPC.
These thermal properties were monitored by dynamic light scattering, an expedite method proposed by us for this determination. The measurement is based on the evaluation of the variation of the surface area of unilamellar vesicles, supposed spherical, as a function of temperature.
The consequences of this thermal expansion will also discuss, with the study of structural properties of phospholipid bilayers in the fluid phase, in excess water, by X-ray diffraction.
II.1. Measurement of expansion by DLS
Results and discussion
i) Results from dynamic light scattering
Prepared in the conditions described in the Preparation of Lipid Aggregates section, the LUVET of all four lipids are quite monodisperse in size as it is mandatory for our purpose. Using extrusion, for a given lipid the dimension of the vesicles obtained depend of the conditions of extrusion (applied pressure, flow rate, pore size and temperature) and concentration of the lipid suspension69,70,71. Their radius is also dependent of the bilayer physical properties namely bending modulus and lysis tension69,70,72. However, we observe small variations in the radius between batches for the same lipid even if an identical filter pore size, 0.1 m, temperature and applied pressure are used. This is because, in practice, a completely equal manually controlled extrusion pressure-flow rate is not feasible. Due to this variability we made several independent preparations of each lipid until at least 3 identical samples are obtained. Samples are considered identical when at a given temperature their radius is the same within the experimental error inherent to the DLS technique/equipment used: 0.5% in this radius range for measurements made as described in the Methods.
To obtain the external radius of the vesicle the thickness of the adjacent water layer, dw, had
to be subtracted from the hydrodynamic radius. Additionally, since the thickness of the bilayer is not negligible compared to the radius of the LUVET, the area of the bilayer should be defined by a sphere passing by its middle point, the region where the two leaflets juxtapose. Hence, the radius of the vesicle, RV, used to calculate the area of the bilayer was
24
determined with the expression RV = Rh – dw – dl/2. We consider dl to be the same for all lipids and equal to 4.6 nm and dw = 0.24 nm.
In Table II.1.1. we present our results for the hydrodynamic radius at 30 ºC of LUVET obtained as explained above for the phospholipids in study. For the comparison between the several lipids it is useful to recall that, while DOPC, POPC and DLPC were extruded at 25 ºC, DMPC had to be extruded at 30 ºC to ensure being well above its main transition temperature (23.8 ºC) along all the extrusion process.
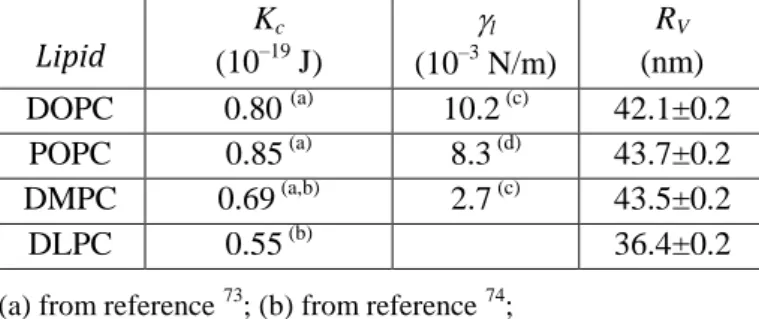
Table II.1.1. Hydrodynamic radius, RV, at 30 ºC determined from DLS
measurements of the LUVET prepared in this work. We also present values from the literature for the bending modulus, Kc, and for the lysis tension, l, obtained
from pipette aspiration, for the bilayers of the same lipids.
Lipid (10K–19c J) l (10–3 N/m) RV (nm) DOPC 0.80 (a) 10.2 (c) 42.1±0.2 POPC 0.85 (a) 8.3 (d) 43.7±0.2 DMPC 0.69 (a,b) 2.7 (c) 43.5±0.2 DLPC 0.55 (b) 36.4±0.2
(a) from reference 73; (b) from reference 74; (c) from reference 75; (d) from reference70.
In Figure II.1.1 we show the obtained variation of the radius, RV, of the LUVET with
temperature for the four phospholipids being studied. The temperature ranges between 5-10 and 70 ºC to the exception of DMPC beginning at 27.5 ºC. Below the dew temperature (ca. 17 ºC), and despite the cell holder compartment being dried with silica gel, some of the measurements are entirely out of correlation what we attribute to water vapor condensation on the cell wall and, therefore, were not considered. Instead of the average RV at each
temperature we opted to present all experimental points for the reader to have a better perception of the experimental dispersion. Each of the RV data points has an estimated error of
±0.2 nm inherent to the DLS measurement done according to the methodology described. However, other particles eventually in suspension, namely micro-bubbles resulting from the decrease of air solubility in water with the increase of temperature, have the consequence of the appearance of spurious experimental values that are clearly identified because the DLS correlation decay curve is abnormal. Those data points were rejected. In Figure II.1.1 the progression of RV vs. T is qualitatively similar for all bilayers and can be divided in three
regions: a region A at low temperature where RV increases steeply with temperature, a region
B where the expansion is much lower, which is followed at higher temperatures by a large increase in RV, region C. The temperature ranges and thermal behavior of the A, B and C
25 Figure II.1.1. Dependence of the vesicle radius, RV, calculated from the hydrodynamic radius
acquired by DLS of unilamellar liposomes with temperature: A) DOPC B) POPC C) DMPC D) DLPC. The lines are arbitrary functions that have been fitted to the data according to the criteria explained in the text. The triangles in the DOPC and POPC panels were obtained in the cooling of one of the samples and confirm that the LUVET maintain their integrity after the heating runs.
regions is dependent on the bilayer composition. The samples are, at least in which concerns these measurements, quite stable and the radius is reversible with temperature as shown in the
Figure II.1.1. panels A and B.
For our final goal, the calculation of the thermal area expansion coefficient, A, of the bilayer, a function describing the variation of RV with T is needed. Since there is no a priori model that can be adjusted to the experimental data we have to rely in the fit of an arbitrary function that describes as well as possible the trend of the data. However, the region A, in particular for the
39.0 39.5 40.0 40.5 41.0 41.5 42.0 42.5 43.0 43.5 44.0 44.5 0.0 10.0 20.0 30.0 40.0 50.0 60.0 70.0 80.0 RV (n m ) T (ºC) a 40.0 41.0 42.0 43.0 44.0 45.0 46.0 47.0 ,0.0 ,10.0 ,20.0 ,30.0 ,40.0 ,50.0 ,60.0 ,70.0 ,80.0 RV (n m) T (ºC) b 43.0 43.5 44.0 44.5 45.0 45.5 46.0 46.5 47.0 47.5 25.0 35.0 45.0 55.0 65.0 75.0 RV (n m ) T (ºC) c 33.0 35.0 37.0 39.0 41.0 43.0 45.0 47.0 0.0 10.0 20.0 30.0 40.0 50.0 60.0 70.0 80.0 RV (n m ) T (ºC) d A B C D
26
cases of DOPC, POPC and DMPC is apparently well behaved, meaning by this that the area expansion seems to follow the usual exponential trend observed in common materials when the thermal expansivity is constant. Consequently, the best-fit exponential was used to simulate region A, and the remaining data was fitted by an arbitrary polynomial. The lines in Figure II.1.1 were obtained by this procedure. For DLPC the initial A region is very short and hardly identifiable, probably ending around 15 ºC, but, for the sake of uniformity, we used the same approach in the calculation of the fitted line.
Contrarily to the regions A and B, the region C is not reproducible between samples, and even for a given sample it is extremely disperse. We have denoted this by describing this region with a dashed line indicating that it express the present results but could have another shape if more or other samples were measured.
The area thermal expansion coefficient is calculated with the usual expression,
A = (dA/dT)/A, where A is the effective area of the vesicle considered spherical. As said, this sphere is defined by the center of the bilayer, the region of contact between the two leaflets. From the derivative of the above curves we have calculated for each lipid the variation of A with temperature, Figure II.1.2. In these curves the sudden change from the constant expansion to the valley corresponding to the region B seems somewhat artificial.
This is the consequence of imposing a “normal” behavior to the region A, however nothing in the data allows postulating a downwards curvature in this region.
The transition between the two regimes, A and B, is certainly not sharp but it is evident and must be stamped in the A curves. We think this approach preferable to the alternative of not imposing the usual physical model for region A without being forced to do so by the experimental data.
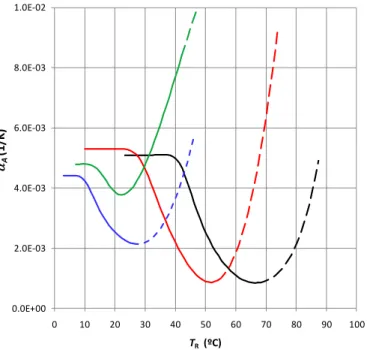
27 Figure II.1.2. Dependence of thermal area expansivity, A of lipid bilayers on the
temperature for DOPC (——), POPC (——), DMPC (——) and DLPC (——). The curves are obtained from the variation of the radii of unilamellar liposomes with temperature shown in Figure II.1.1.
ii) DISCUSSION
It is consensual that the size of the LUVET depends on the pressure used for the extrusion, the dimension of the filter pore and, to a certain extent, how many times the extrusion is repeated76. In which concerns other conditions such as lipid concentration, flow rate, temperature or characteristics of the lipid, not all works agree. It has been reported that concentration and flow rate do not influence the size of the final vesicles72
. The lipid composition and temperature determine the physical/mechanical properties of the bilayer, namely its bending modulus, KC, and lysis (or rupture) tension, l, reason why it is difficult to accept that the radius of the LUVET are independent of the lipid and extrusion temperature as sometimes said72. In our study the lipids were suspended in water and extruded using the same pressure, the same batch of polycarbonate filters and, with the exception of DMPC, at the same temperature. We observed a clear difference between the radii of the vesicles of DOPC, POPC and DLPC, Table II.1.1. This dependence on the lipid, or at least of the lipid properties, has been previously reported. It has been attributed to differences of the bending modulus of the bilayer of the different lipids69. The differences in KC are enough to explain the observed
variation in the determined radii of the LUVET, Table II.1.1. The role of the lysis tension is less explored in the literature. It has been said that it determines the pressure threshold for the extrusion72
and some authors also propose that the vesicle size should increase linearly with
0.0E+00 2.0E-03 4.0E-03 6.0E-03 8.0E-03 1.0E-02 0.0 10.0 20.0 30.0 40.0 50.0 60.0 70.0 80.0 A (1 /K ) T (ºC)
28
the square root of l69. Values of l are not available for all the lipids we would like to
compare, and in Table II.1.1 are presented l either derived from the extrusion pressure or pipette aspiration. However, for the lipids under study the trend is not as predicted. As already said the DMPC LUVET radius does not correlate with the bilayer bending modulus retrieved from the literature what can probably be traced to the temperature used for extrusion and goes against the much lower lysis tension reported for this lipid. In any case, in the work of Nayar et al.36 the egg-PC, essentially constituted by POPC, and DMPC vesicles have the same radius, the first extruded at 21 ºC and the second at 30 ºC.
The pattern of radius variation with temperature is qualitatively the same for all lipids. After a section of uniform increase the variation with temperature becomes less steep but is followed by a second region with large expansion. This variation is pictured in the plots of A vs.
temperature that exhibit a minimum, Figure II.1.2. Above about 50 ºC the DLS data is quite disperse and due to the uncertainty in the fit curve we represented this region with dashed line. A simple inspection of the heating and cooling data shows that this data dispersion does not result from a disruption of the vesicles because the LUVET maintain their properties unchanged in the time-scale of the experiment.
The in-plane thermal expansion of a fluid bilayer results from three partially independent factors: the usual effect of the anharmonicity of the intermolecular potential energy curve common to all molecular solids and liquids, the increase in the free volume characteristic of liquids, and additionally the progressive increase of the number of the gauche configurations along the hydrocarbon chains. A similar trend is observed for the isobaric thermal expansion of alkanes that was analyzed in detail by Troncoso et al.35. The reasoning presented by these authors is based on careful measurements and molecular simulation, and should apply to the case of the lateral thermal expansion of planar bilayers. Their explanation is the following: At low temperature the chains behave like hard spheres similar to other materials but, additionally, there is a component of the expansion that has origin on the trans-gauche isomerization of the hydrocarbon chain both resulting in an increase of the specific volume; the authors do not mention it, but during the low temperature regime certainly a number of voids are already being formed as it happens usually with common liquids. When the temperature attains a certain value that depends of the hydrocarbon in study, the number of voids already present in the system is enough to accommodate the chain conformation changes, reducing the importance of this parcel for the thermal expansion. Similarly, we think that in the region A of the R vs. T curves the lipid tails follow the normal expansion
29
mechanism of liquids, probably with the addition of trans-gauche bond rotation also contributing to the expansion. However, above a certain temperature the free volume already present in the bilayer is enough to accommodate increasingly more gauche conformers that are randomly being created along the chains, not contributing, in this way, to the expansion. The hard sphere mechanism is still present and the number of voids increases but, as the amount of free volume is larger, the kinetics of chain rotation contributes less to the expansion. This mechanism dominates the region B. After a minimum, the expansion increases for all lipids, region C. We question if this results from a real increase in the vesicle radius or from the shape of the vesicles diverging too much from a sphere. In this higher temperature region the geometrical shape of the unilamellar vesicles may suffer drastic changes acquiring morphologies that result in a slower diffusion and enhance light dispersion77,78. However, the integrity of the vesicles is not affected since, as we show in Figure II.1.1, the process is reversible. A similar increase after the minimum of expansion is observed for long-chain hydrocarbons35 and alcohols79. In the case of the hydrocarbons the invoked reason is the approach of a phase change with the inherent fluctuation in volume and enthalpy. For bilayers the decrease of the hydrophobic effect together with the possibility of interdigitation may result in a particular behavior of the lipids. We know from experiments with fluorescence recovery after photobleaching (FRAP) that the diffusion of a labeled phosphoethanolamine in DOPC, POPC, DMPC and DPPC is abnormally fast above ca. 60-70 ºC probably due to changes of the bilayer structure [W.L.C. Vaz, private communication].
Concerning the region C it is also interesting to observe that for DOPC, POPC and DMPC it begins at ca. 50 ºC and the data is very disperse and sample dependent. The case of DLPC seems quite different from the others in that the decrease of A is smaller, the minimum at
much lower temperature and the region C begins very early (25-30 ºC). However, like the other lipids, the dispersion of data is only present above 50 ºC indicating that it is the thermal energy and not the expansion regime, A, B or C, that determines the dispersion of R measurements.
In region A the lateral thermal expansion goes along with what would be expected from the lipid chain interaction in the sequence: the two unsaturated lipids, DLPC and DMPC. Besides this, DLPC has very short chains and is near the borderline of the membrane forming lipids, the first of which is the dicaproyl PC. According to the model proposed, the temperature at which there is the negative inflection of the R vs. T curves corresponds to the point where the