A new approach to estimate compressive strength
of concrete by the UPV method
Um novo procedimento para estimar a resistência
à compressão do concreto pelo método VPU
a Departamento de Engenharia Civil, Universidade Tecnológica do Paraná, Campus Pato Branco, Paraná; b Departamento de Engenharia Civil, Universidade Federal de Santa Catarina, Florianópolis.
Received: 14 Aug 2015 • Accepted: 15 Feb 2016 • Available Online 21 Mar 2016
Abstract
Resumo
Although the ultrasonic pulse velocity (UPV) method has been extensively used to estimate concrete compressive strength, the relationship between UPV and concrete strength is mixture dependent. As a result, the applicability of this method to estimate strength is well known to be limited. Aggregate type, cement type, mixture proportions, and water-cement ratio inluence such a relationship. Nevertheless, UPV and strength are both governed by cement hydration, and thus, a relationship between UPV in the cement paste phase and concrete compressive strength would be expected to exist. By not taking into account the type and volume content of aggregates, this relationship could be the same for concrete mixtures with same type of cement and water-cement ratio, regardless the aggregate type used. This study investigates the existence of such a relationship. Concrete mixtures with water-cement ratios of 0.48, 0.55 and 0.64, with diferent paste volumes were prepared in the laboratory. For each mixture, compressive strength and ultrasonic pulse velocity were evaluated at various ages. The UPV of each concrete phase: paste, ine aggregate, and coarse aggregate, was obtained through paste and mortar specimens. This study indicated that it is possible to establish a unique relationship between the UPV in cement paste phase and the concrete compressive strength. This unique relationship could be applied to several concrete mixtures, greatly expanding the use of the UPV method to estimate compressive strength.
Keywords: compressive strength, mechanical properties, ultrasonic pulse velocity, non destructive methods.
O método da velocidade do pulso ultrassônico (VPU) tem sido bastante utilizado para estimar a resistência à compressão do concreto, porém sabe-se que a relação entre a VPU e a resistência do concreto depende do traço da mistura. Como consequência, a aplicabilidade do referido método para estimativa da resistência torna-se limitada. Tipos de agregados, tipos de cimento, dosagem e relação água/cimento inluenciam diretamente na relação entre VPU e resistência do concreto. No entanto, tanto a VPU quanto a resistência do material dependem da hidratação do cimento e assim é de se esperar que exista uma correlação entre a VPU na pasta de cimento e a resistência do concreto. Por não levar em consideração o tipo e volume dos agregados, esta correlação poderia ser a mesma para concretos com o mesmo tipo de cimento e relação água/ cimento, independente dos tipos de agregados utilizados nas misturas. O presente estudo investiga a existência da referida correlação. Foram preparadas em laboratório misturas de concreto com relação água/cimento 0,48, 0,55 e 0,64, com diferentes volumes de pasta. Para cada mistu-ra e em diferentes idades, fomistu-ram obtidos valores da resistência à compressão e da velocidade do pulso ultmistu-rassônico. A VPU pamistu-ra cada constituinte do concreto (pasta, agregado ino e agregado graúdo), foi obtida por meio de corpos de prova de pasta e de argamassa. O estudo mostrou que é possível estabelecer uma correlação única entre a VPU na pasta de cimento e a resistência à compressão do concreto. Esta correlação única poderia ser aplicada para diversas misturas, ampliando sobremaneira a aplicação da VPU para estimar a resistência à compressão do concreto.
Palavras-chave: resistência à compressão; propriedades mecânicas; velocidade de pulso ultrassônico; ensaios não destrutivos.
M. A. P. IRRIGARAY a
[email protected] R. C. de A. PINTO b
[email protected] I. J. PADARATZ b
1. Introduction
Concrete compressive strength is the main mechanical property used in the design of concrete structures. Project criteria, construc-tion scheduling, and load capacity of a concrete structure depend upon the speciied compressive strength, which is usually deter-mined as the compressive strength at 28 days in a controlled tem-perature and relative humidity environment [1, 2].
Sometimes, however, it is necessary to assess concrete compres-sive strength on site in ages other than 28 days. Form removal, shoring, reshoring, the application of construction and service loads, and prestressing forces are only scheduled to take place after a cer-tain level of strength or elastic modulus is reached. In some cases, compressive strength must also be estimated at later ages to deter-mine the actual load capacity of the structural member.
Compressive strength like most of the mechanical and physical properties of concrete mixtures is continuously changing over time due to the hydration of cement particles. As the microstructure develops the mixture changes from a luid to a solid state. It loses its initial workability, and starts to develop its mechanical proper-ties. This continuous process can be indirectly followed by moni-toring the development of either chemical, electrical, physical, or mechanical properties of the concrete mixture.
One option is to use wave propagation methods to gather informa-tion on the development of the microstructure. The most important parameters of this non-destructive method are the propagation ve-locities and the elastic properties, as well as the derived quantities [3]. Wave velocities depend on the modulus of elasticity, poison ratio, and density of the material.
The longitudinal or compression wave (P-wave) velocity can be easily obtained when testing a concrete sample. Portable ultra-sound equipment is widely available and afordable. In order to continuously monitor changes in physical and mechanical proper-ties, it is necessary to record transient ultrasound waves transmit-ted through the mixture. There have been several examples of the application of such a technique to monitor the development of the microstructure of cementitious materials, as well as to assess the efects of chemical admixtures on the development of the micro-structure [4, 5].
Lin [6] presented a mathematical method to predict concrete UPV values based on the mixture proportions and on the UPV of each concrete phase, deined as cement paste, ine aggregate, and coarse aggregate. According to them, concrete UPV can be obtained by using a simple rule of mixtures, examining the vol-ume fraction of each phase with its individual UPV, in accordance with Eq. 1.
(1)
c
V
ca
V
ca
v
c
V
fa
V
fa
v
c
V
p
V
p
v
c
v
1
1
1
1
=
+
+
Where:
Vc - UPV in concrete; Vp - UPV in cement paste; Vfa - UPV in ine aggregate; Vca - UPV in coarse aggregate;
Vp /Vc - Volume ratio of cement paste to concrete; Vfa / Vc - Volume ratio of ine aggregate to concrete;
Vca / Vc - Volume ratio of coarse aggregate to concrete;
Although the volume fraction of each individual phase is given di-rectly by the mixture proportions, in order to estimate UPV in con-crete from Eq. 1, it is necessary to have previously established the UPV in the diferent individual concrete constituents. Lin [6] obtained UPV values directly from cement paste mixtures, and from cores of the coarse aggregate stones. The UPV in the ine aggregate, on the other hand, was indirectly obtained by compar-ing the UPV of cement pastes to that of mortar mixtures, uscompar-ing Eq. 2. Mortar was considered to be a two-phase composite material consisting of ine aggregate and cement paste.
(2)
m
V
fa
V
fa
v
m
V
p
V
p
v
m
v
1
1
1
=
+
Where:
Vm - UPV in mortar mixture;
Vp / Vm - Paste volume to mortar volume;
Vfa / Vm - Fine aggregate volume to mortar volume;
Lin [6] concluded that Eq. 1 can be used to estimate the UPV in concrete with an error of 2.5% at ages later than 7 days. For early ages, of less than three days, the authors believed that their model would not take into account possible free water inside the concrete mixture.
When using the ultrasonic pulse velocity (UPV) method to estimate the compressive strength of concrete mixtures, it is necessary to demonstrate that there is a relationship between compressive strength and UPV. Both concrete compressive strength and ultra-sonic pulse velocity in concrete are a consequence of the extent of cement hydration. Pinto et al [7] found a correlation between UPV in concrete and the non-evaporable water content of some mortar mixtures for UPV values greater than 2000 m/s. Although not a direct measure of the chemically combined water, the non-evaporable water content is still related to the extent of cement re-action, and can be used to assess the degree of cement hydration [8]. Similarly, Byfors [9] presented a linear relationship between compressive strength and degree of hydration for concretes with w/c ratios of 0.40 to 1.0, for degree of hydration values greater than 15%. For degree of hydration values smaller than 15%, Byfors [9] believed that compressive strength grows non-linearly with an increase of the degree of hydration values.
However, it has been well established that there is not a unique relationship between the UPV and compressive strength that can be applied to any concrete mixture [10, 11, 12]. Many factors af-fect the relationship between compressive strength and the UPV. Some of them are directly related to the concrete mixture, such as aggregate type, size, and content; cement type and content; and water-cement ratio. Thus, if the UPV method is used to esti-mate the compressive strength of concrete, the correlation curve between those two parameters for the particular concrete mixture must be previously determined.
development of UPV in concrete would be given by the develop-ment of UPV in the cedevelop-ment paste. UPV in the aggregates should be constant over time. Therefore, one could directly relate UPV in the cement paste phase to compressive strength of concrete. This new relationship could, in theory, be applicable to various con-crete mixtures. It would depend solely on the type of cement. The inluence of aggregate type, and its proportions in the concrete mixture would be suppressed. Thus, a relationship between the UPV in cement paste and concrete compressive strength could be applied to a family of concrete mixtures expanding the use of the ultrasound to estimate concrete compressive strength.
This relationship, nonetheless, would still not be applicable to con-crete mixtures in which the aggregates play an important role in concrete strength, such as for mixes with lightweight coarse ag-gregates or even high strength mixes. For normal strength con-crete mixtures, on the other hand, such a relationship would allow a much broader use of the ultrasound to estimate concrete com-pressive strength. It would still be necessary to have previously obtained the UPV in cement paste and in the aggregates, as well as, the correlation relationship between the UPV in cement paste and concrete compressive strength for one mixture. Such a rela-tionship could then be used to estimate the compressive strength on site for concrete mixtures with the same cement type, but made with any type of aggregate and with various mixture proportions. This work presents an experimental investigation in which the relationship between concrete compressive strength and the UPV in cement paste was investigated for concrete mixtures with same type of cement. The main goal of this study was to cor-relate compressive strength with UPV in cement paste regard-less of the type of aggregate and its proportions. Therefore, the UPV and compressive strength of concrete mixtures with three diferent water-cement ratios made of various aggregate propor-tions and two types of coarse aggregate (gravel and basalt) were monitored. The results indicated that there seems to be a unique relationship between the UPV in cement paste and concrete compressive strength for a given type of cement used in normal-strength concrete mixtures.
2. Experimental program
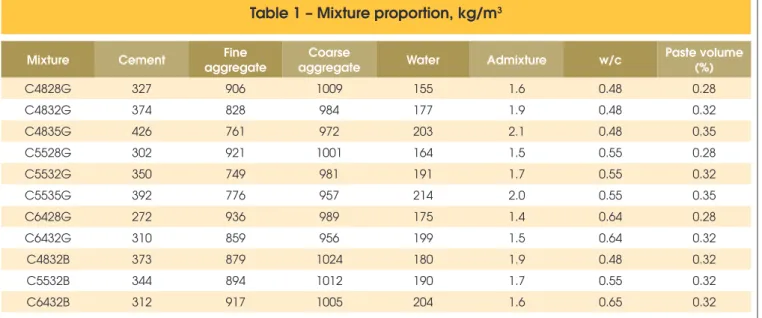
Concrete mixtures with water-cement ratios of 0.48, 0.55, and 0.64 were prepared in the laboratory. For each water-cement ratio, diferent paste volumes were chosen among the values of 28%, 32% or 35% of the total mixture volume. Table 1 shows the con-crete mixture proportions. Brazilian cement Type CP V-ARI-RS was used. The ine aggregate was made of a combination of 30% river ine sand and 70% medium gravel sand, crushed from gravel coarse aggregate. Coarse aggregate with a nominal size of 19 mm was used for all mixtures. Two types of coarse aggregates were chosen, gravel and basalt. A water reducer admixture was also added to the mixture in order to maintain workability.
Each concrete mixture was named according to the following rule: the irst letter identiies the mixture as a concrete mixture (C); the numbers that follow indicate the water-cement ratio and paste vol-ume; and inally the last letter indicates the type of coarse aggregate in the concrete mixture, either gravel (G) or basalt (B). For instance, mixture C5532G represents a concrete mixture with water-cement ratio of 0.55, paste volume of 32%, and gravel coarse aggregate. The materials were mixed in the laboratory in a 0.4 m3 drum
mix-er. For each concrete mixture, several 100 x 200 mm cylinders were cast. These cylinders specimens were kept inside their steel molds for the irst 24 hours, after which they were demolded, and wrapped with a thin plastic ilm to prevent loss of moisture. All cyl-inder specimens were kept in laboratory conditions before tested for UPV and compressive strength.
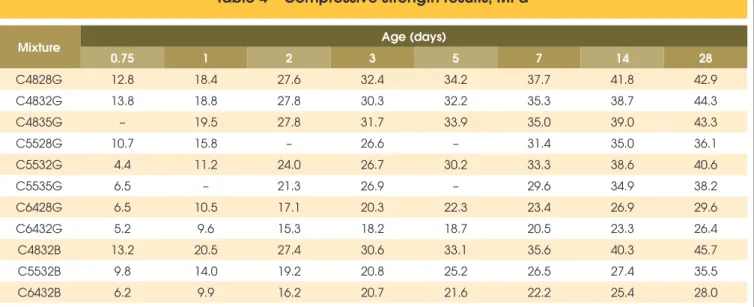
Compressive strength and ultrasonic pulse velocity were evalu-ated according to Brazilian Standards at various ages from 0.75 to 28 days after casting. The calculated compressive strength was the average of four individual tests performed on the cylin-der specimens. Measurements of the UPV were performed on all cylinder specimens just before compressive strength testing. Commercial ultrasound equipment was used along with 54 kHz cylindrical transducers.
The ultrasonic pulse velocity in the ine aggregate was indirectly obtained by applying Equation 2. Concrete mixture C5532G was
Table 1 – Mixture proportion, kg/m
3Mixture Cement Fine
aggregate
Coarse
aggregate Water Admixture w/c
Paste volume (%)
C4828G 327 906 1009 155 1.6 0.48 0.28
C4832G 374 828 984 177 1.9 0.48 0.32
C4835G 426 761 972 203 2.1 0.48 0.35
C5528G 302 921 1001 164 1.5 0.55 0.28
C5532G 350 749 981 191 1.7 0.55 0.32
C5535G 392 776 957 214 2.0 0.55 0.35
C6428G 272 936 989 175 1.4 0.64 0.28
C6432G 310 859 956 199 1.5 0.64 0.32
C4832B 373 879 1024 180 1.9 0.48 0.32
C5532B 344 894 1012 190 1.7 0.55 0.32
chosen as the basic mixture from which mortar and cement paste mixture proportions were calculated. Thus, a cement paste mixture and a mortar mixture with water-cement ratio of 0.55, (P55 and M55) were also prepared in the laboratory. Prismatic specimens of 100 x 200 x 200 mm size were prepared for the paste and mortar mixtures. The UPV in each specimen was obtained at 7, 14 and 28 days. The ultrasonic pulse velocities in the gravel and basalt coarse aggregates were obtained by a similar approach. Two concrete prismatic specimens of the same size as for the paste and mortar mixtures were prepared for C5532G and C5532B mixtures. UPV was also measured at 7, 14 and 28 days. UPV in the basalt coarse aggregate and the gravel coarse aggregate was calculated using Equation 1 together with the obtained values of pulse velocity in ine aggregate and in the paste mixture.
3. Experimental results and discussions
Table 2 and Figure 1 show the UPV results for the prismatic speci-mens used to obtain the ultrasonic pulse velocities in the paste, mortar and coarse aggregates. It can be observed that the ultra-sonic pulse velocities in both concrete mixtures were always high-er than the UPV in the mortar, which was always highhigh-er than the UPV in cement paste. Such behavior was expected, since with the
introduction of greater volumes of aggregates in the mixes, there was a consequent reduction of paste volume, and therefore an increase on the UPV values. Figure 1 also depicts the inluence of aggregate type on the value of UPV, since concrete mixture C5532B, with basalt coarse aggregate, presented a much higher UPV than mixture C5532G, with gravel coarse aggregate at the same volume content.
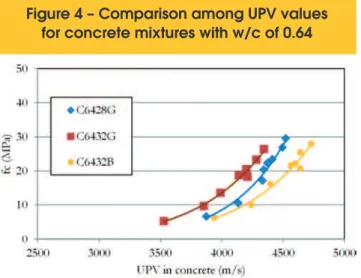
Table 3 shows the average UPV results over time for all concrete mixtures measured in the cylinder specimens, the accompanying average compressive strength results for such specimens are pre-sented in Table 4. These data can be graphically seen in Figures 2 to 4 where the relationship between the UPV in concrete and concrete compressive strength for all mixtures are presented. The
Table 2 – Ultrasonic pulse velocity
in the prismatic specimens, m/s
Mixture Age (days)
7 14 28
P55 3149 3231 3285
M55 3942 4036 4098
C5532G 4446 4436 4505 C5532B 4789 4788 4811
Figure 1 – Development of the UPV over time
for paste, mortar, and concrete
mixtures with the same w/c ratio
Table 3 – Ultrasonic pulse velocity in the cylinder specimens, m/s
Mixture Age (days)
0.75 1 2 3 5 7 14 28
C4828G 4099 4361 4422 4484 4549 4581 4604 4683
C4832G 4010 4131 4305 4393 4424 4477 4492 4618
C4835G – 4157 4307 4325 4359 4383 4511 4548
C5528G 4121 4249 – 4386 – 4490 4543 4576
C5532G 3577 4038 4340 4409 4366 4470 4590 4583
C5535G 3658 – 4221 4307 – 4347 4428 4450
C6428G 3874 4135 4332 4342 4372 4413 4496 4521
C6432G 3528 3854 3991 4211 4140 4201 4283 4345
C4832B 4313 4566 4737 4766 4858 4884 4910 4956
C5532B 4142 4394 4580 4638 4703 4716 4732 4823
behavior pattern of such a relationship was the same for all mix-tures, since for given water-cement ratio, mixtures with greater paste volumes, and therefore smaller aggregate volumes, dis-played smaller UPV values at the same level of compressive strength. On the other hand, mixtures with basalt coarse aggregate showed greater values of UPV at the same level of compressive strength. These results reinforce the inluence of aggregate pro -portions and aggregate types on the relationship between com-pressive strength and UPV in concrete mixtures.
The UPV in the ine and coarse aggregates were obtained from Equations 1 and 2 along with the UPV values in the prismatic samples. Table 5 presents the calculated UPV values in the ine aggregate, as well as in the gravel and basalt coarse aggregates. The results indicated that the UPV in the basalt coarse aggregate was approximately 36% higher than the one in the gravel coarse aggregate, explaining the higher UPV observed for the concrete mixtures made with basalt coarse aggregates.
Since the objective of this study is to evaluate the relationship be-tween UPV in cement paste phase and the compressive strength of concrete, it is necessary to estimate the UPV in the cement paste for each mixture. Even though, the value of UPV for M55 mixture was obtained from the M55 prismatic specimen, such a specimen is more than twice the volume of the cylinders, in which compressive strength was obtained. Moreover, paste specimens for 0.48 and 0.64 water cement ratio mixtures were not prepared. Therefore, it was decided to calculate the UPV in the cement paste phase of the cylinders themselves. This approach would allow to
directly relate compressive strength and UPV in paste phase of the same specimen.
Eq. 1 permits to estimate the UPV in the cement paste phase for each cylinder tested by knowing the UPV in the aggregates, in the concrete cylinder, as well as the volume fractions of each compo-nent. By rearranging the terms in Eq. 1, it is possible to mathemati-cally describe the direct dependence of UPV in the cement paste with the aforementioned variables, as presented in Eq. 3.
(3)
p
V
ca
V
ca
v
p
V
fa
V
fa
v
p
V
c
V
c
v
p
v
1
1
1
1
=
-
-Thus, for each cylinder tested, the UPV in the cement paste phase was calculated according to Eq. 3. The results are presented in Table 6 for the various concrete mixtures at all ages.
Table 4 – Compressive strength results, MPa
Mixture Age (days)
0.75 1 2 3 5 7 14 28
C4828G 12.8 18.4 27.6 32.4 34.2 37.7 41.8 42.9
C4832G 13.8 18.8 27.8 30.3 32.2 35.3 38.7 44.3
C4835G – 19.5 27.8 31.7 33.9 35.0 39.0 43.3
C5528G 10.7 15.8 – 26.6 – 31.4 35.0 36.1
C5532G 4.4 11.2 24.0 26.7 30.2 33.3 38.6 40.6
C5535G 6.5 – 21.3 26.9 – 29.6 34.9 38.2
C6428G 6.5 10.5 17.1 20.3 22.3 23.4 26.9 29.6
C6432G 5.2 9.6 15.3 18.2 18.7 20.5 23.3 26.4
C4832B 13.2 20.5 27.4 30.6 33.1 35.6 40.3 45.7
C5532B 9.8 14.0 19.2 20.8 25.2 26.5 27.4 35.5
C6432B 6.2 9.9 16.2 20.7 21.6 22.2 25.4 28.0
Figure 2 – Comparison among UPV
values for concrete mixtures with w/c of 0.48
Table 5 – UPV of aggregates, m/s
Fine aggregate 5346 Gravel coarse aggregate 5444
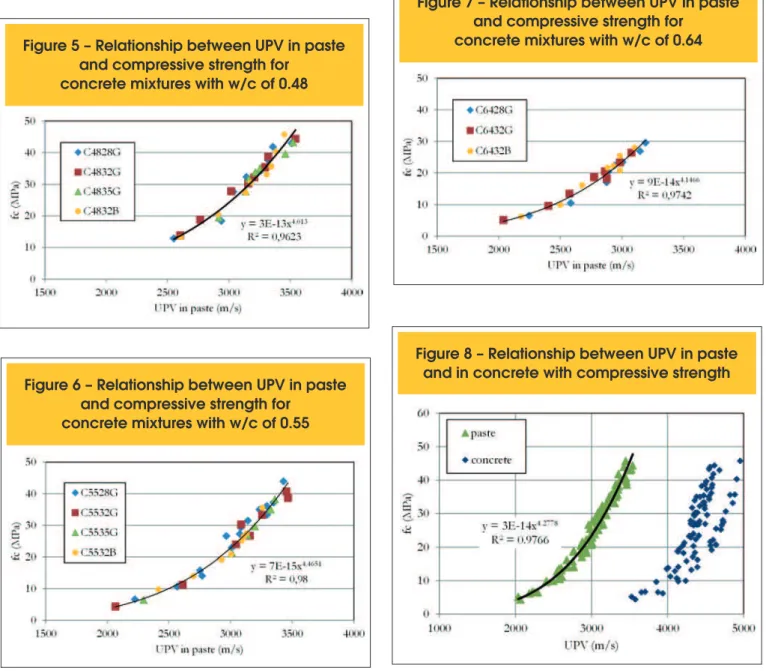
Figures 5 to 7 show the correlation between concrete compressive strength and UPV in cement paste phase for mixes with the same water-cement ratio. It can be noticed that for a given water-cement ratio, there seems to be a unique relationship between concrete strength and UPV in cement paste, which does not depend upon the aggregate proportion or aggregate type.
In order to assess the efect of diferent water-cement ratio on the relationship between UPV in cement phase and concrete compres-sive strength, all data were analyzed together, being presented in Figure 8. It can be observed that by using the UPV in the cement paste phase instead of the UPV in concrete as an indicator of the compressive strength acquired by the concrete mixture, concrete mixtures with diferent aggregates, aggregate proportions and wa-ter cement ratios may be grouped together as having the same relationship.
An analysis of variance procedure was performed to assess whether the relationship between UPV in cement paste phase and concrete compressive strength is afected by the water-cement ra-tio[14]. Initially, the best it power regression curve was obtained for each water-cement relationship. The best it curves are pre-sented in Figures 5 to 7. It was veriied that the error term vari-ances of each best it power regression curve were not signiicantly diferent, conirming the aptness of the regression model consid-ering all data together. Then, with a risk level a of 0.01, it was
concluded that there is not a signiicant diference among the three best it power curves. Therefore, it was possible to obtain the best it power curve for all data, as presented in Figure 8 along with the obtained coeicient of determination.
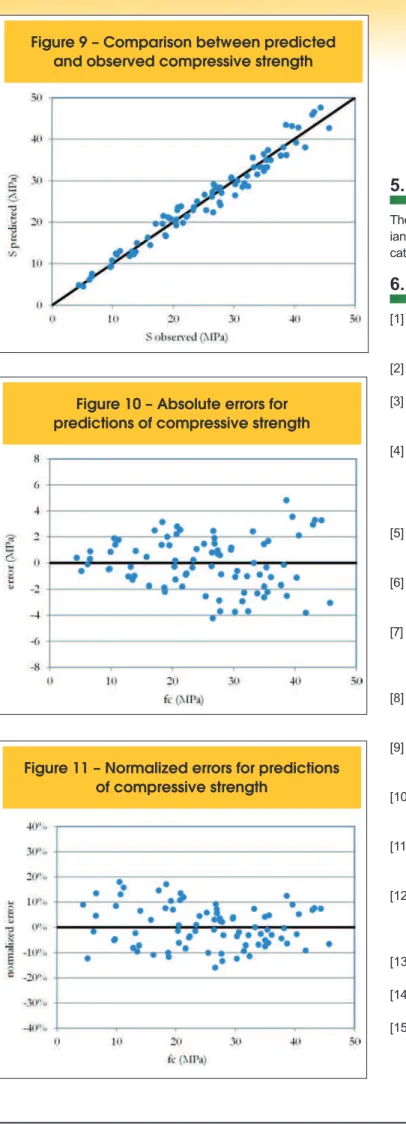
This mathematical expression was used to compare strength pre-diction given by the UPV in cement paste for the mixtures studied. Figure 9 presents the results of the estimated and the predicted strength values for all mixtures.
The absolute error of the predicted strength to the measured strength was calculated for each testing age. The calculated er-rors for all mixtures at the various ages are shown in Figure 10. The mean of the absolute errors was on the order of 1.6 MPa, with a maximum absolute error of 4.2 MPa. However, it is possible to note that the absolute errors seem to be heteroscedastic, since the scatter band increases over strength values. The variance of the absolute errors therefore does not remain constant [15]. It depends upon the strength level.
Due to the time-dependent behavior of the strength data, the normalized error, as given by Equation 4, is a more appropriate parameter to compare approaches, as suggested by Bazant and Panula [16]. This approach equally weights the efect of difering strengths at early ages versus those at later ages. The normalized errors versus age for all mixtures are shown in Figure 11. It can be observed that the normalized errors seem to be homoscedastic,
Table 6 – Calculated UPV in the paste phase, m/s
Mixture Age (days)
0.75 1 2 3 5 7 14 28
C4828G 2552 2940 3039 3145 3258 3318 3359 3512
C4832G 2603 2766 3019 3158 3207 3296 3321 3543
C4835G – 2919 3137 3165 3216 3255 3461 3524
C5528G 2568 2753 – 2966 – 3141 3235 3295
C5532G 2067 2612 3046 3157 3087 3257 3467 3454
C5535G 2295 – 3011 3137 – 3198 3326 3360
C6428G 2247 2584 2876 2892 2940 3006 3147 3192
C6432G 2038 2404 2574 2877 2775 2863 2983 3078
C4832B 2607 2912 3137 3178 3308 3346 3383 3453
C5532B 2415 2699 2929 3004 3091 3108 3131 3257
(4)
( )
( )
( )
i obsobs i pred i i
S
S
S
-=
D
Where,
∆
i= normalized error at test i (unitless);( )
S
i pred= value of predicted strength at test age i (MPa);( )
S
i obs= observed value of strength at test age i (MPa).4. Conclusions
Based on the work presented in this paper, the following conclu-sions may be drawn:
n For the mixtures studied here, the use of UPV values in the paste phase of concrete mixes, as calculated by Eq. 3 allowed to ind a unique relationship between the UPV in cement paste and the concrete compressive strength for a given type of
mean value of the relative errors was on the order of 6.9%.
n This study indicated that for a given type of cement, it is pos-sible to establish a unique relationship between the UPV in ce-ment paste phase and the concrete compressive strength. This unique relationship could then be used to estimate concrete compressive strength on site for any concrete mixture with the same type of cement, regardless of the type of aggregates, their volume proportions in the mixture, and the water-cement ratio of the mixture. It would be necessary, however, to have previ-ously deined UPV values in the aggregates. This could be ac-complished by comparing UPV values in cement paste, mortar, and concrete mixtures using Eq. 1 and Eq. 2.
n The use of UPV in cement paste rather than in concrete to
esti-mate concrete compressive strength could increase the use of this non-destructive test method to estimate concrete strength. Once a relationship has been established, it could be applied to
Figure 5 – Relationship between UPV in paste
and compressive strength for
concrete mixtures with w/c of 0.48
Figure 6 – Relationship between UPV in paste
and compressive strength for
concrete mixtures with w/c of 0.55
and compressive strength for
concrete mixtures with w/c of 0.64
a family of concrete mixtures of the same type of cement. This conclusion is limited to the range of w/c studied here and to concrete mixtures with normal weight aggregates.
5. Acknowledgements
The authors would like to express their gratitude to CAPES, the Brazil-ian Federal Agency for the Support and Evaluation of Graduate Edu-cation, and to GPEND/UFSC where this research was conducted.
6. References
[1] ACI Committee 318, 2008, Building Code Requirements for Structural Concrete and Commentary, American Concrete Institute, 456 pp.
[2] Eurocode 2, 2004. Design of Concrete Structures, 1.1 Gen-eral Rules and Rules for Buildings, EN 1992-1-1
[3] Reinhardt, H. W., and Grosse C. U. (2005), “Continuous Moni-toring of Setting and Hardening of Mortar and Concrete,” Con-struction and Building Materials, Vol. 18, 145-154.
[4] Belie, N.; Grosse, C. U.; Kurz, J.; and Reinhardt, H. W., (2005), “Ultrasound Monitoring of the Inluence of Diferent Accelerating Admixtures and Cement Types for Shotcrete on Setting and Hardening Behaviour,” Cement and Concrete Research, Vol. 36, No. 11, 2087-2094.
[5] Belie, N; Grosse, C. U.; Baert, G. (2008), “Ultrasonic Trans-mission to Monitor Setting and Hardening of Fly Ash Con-crete,” ACI Materials Journal, Vol. 105, No. 3.
[6] Lin, Y.; Lai, C.; Yen, T. (2003), “Prediction of Ultrasonic Pulse Velocity (UPV) in Concrete,” ACI Materials Journal, Vol. 100, No. 1, 21-28.
[7] Pinto, R. C. A.; Hobbs, S. V.; Hover, K. C. (1999), “Relationship Between Non-evaporable Water Content and Hardened Proper-ties of High-performance Mixtures,” High Performance Concrete: Research to Practice, SP - 189, American Concrete Institute. [8] Eglinton, M. (1998), “Resistance of Concrete to Destructive
Agencies,” in: P.C. Hewlett (Ed.), Lea´s Chemistry of Cement and Concrete, 4th Ed., John Wiley & Sons.
[9] Byfors, J. (1980), Plain Concrete at Early Ages, CBI Re-search Report, No. 3:80, Swedish Cement and Concrete Research Institute.
[10] Carino, N. J. (2004), “Stress Wave Propagation Methods,” in: T.R. Naik, V.M. Malhotra (Eds.), CRC Handbook on Non-destructive Testing of Concrete, CRC Press, pp 289-323. [11] ACI Committee 228 (2008), In-Place Methods to Estimate
Concrete Strength, ACI 228.1R-03, American Concrete Insti-tute, 44 pp.
[12] Stirrup, V. M.; Vecchio, F. J.; Caratin, H. (1984) “Pulse Veloc-ity as a Measure of Concrete Strength,” in: V.M. Malhotra (Eds), In Situ/Nondestructive Testing of Concrete, Publica-tion SP-82, American Concrete Institute.
[13] Neter, J.; Wasserman, W.; Kutner, M. H. (1990), Applied Lin-ear Statistical Models, Irwin, 3rd Ed., 1181 pp.
[14] McCuen, R. H. (1985), Statistical Methods for Engineers, Prentice-Hall, 439 pp.
[15] Bazant, Z. P., Panula, L. (1979), “Practical Prediction of Time-dependent Deformations of Concrete - Part VI: Cyclic Creep, Nonlinearity and Statistical Scatter,” Materials and Structures, Vol. 12, No. 3, 175–183.