*e-mail: [email protected]
The Effect of Alloying on the Resistance of Carbon
Steel for Oilfield Applications to CO
2Corrosion
David V. Edmonds*, Robert C. Cochrane
Institute for Materials Research, School of Process, Environmental and Materials Engineering,
University of Leeds, Leeds, LS2 9JT, United Kingdom
Received: July 19, 2004; Revised: October 21, 2005
A systematic study has been conducted to investigate the inluence of a wide range of alloying elements and different processing conditions on the resistance of low-carbon steels to CO2 corrosion. Strong carbide-forming microalloying elements such as Ti, Nb and V, along with Cr additions, and different levels of Mn, Si, Cu, Mo and Ni, have been explored, along with treatments simulating different processing conditions, for example, controlled rolling, and quenching and tempering. Corrosion testing, including low loop tests, has been carried out, along with evaluation of mechanical properties, weldability and hot ductility. The programme has developed steels with improved CO2 corrosion resistance and hence identiied a potential route for producing more economical carbon steels for oilield applications. The work has been carried out as part of the UK- Brazil Corrosion Network.
Keywords:CO2 corrosion, carbon steels, microalloying
1. Introduction
The project was conceived under a UK-Brazil Corrosion Network1 focused upon the oil and gas industries. Arising from exchange visits and workshops in both the UK and Brazil, enabled by this network, three principal inter-related themes for research have been identi-ied, which together could deliver innovative means of assuring the integrity of oilield installations. The irst of these themes is asset integrity management (AIM), which will extend plant life through life prediction and implementation of probabilistic inspection sched-uling. The second theme, to which this paper relates, is promoting relevant studies of the corrosion mechanisms in production condi-tions and hence should also develop realistic models to foresee its occurrence. The third area of focus is in developing radical means of corrosion control and engineered surfaces to enable inherently corrosion resistant carbon and low-alloy linepipe steels, together with remedial measures, to minimise the impact on the environment. The justiication, and economic and environmental beneits for the direction of this overall programme, stem from the fact that 10% of the cost of lifting a barrel of oil can be attributed to the cost of well-head and pipeline corrosion, and 95% of the constructional materials used in the oil and gas industries is, and will be for the foreseeable future, carbon steel. The overall objective of the network research programmes is to achieve a reduction in capital expenditure (CAPEX) costs of around 8% and a corresponding reduction in operating costs (OPEX) of close to 10%.
The more common forms of corrosion encountered in transmis-sion gas/oil pipelines and in well-head applications (‘down-hole’) are associated with the presence of H2S or CO2. Although CO2 in aqueous solution forms a weak acid, its ability to produce a signii-cant, deep, localized or uniform attack is considerable2. The problem with CO2 corrosion is that a wide variation in corrosion behaviour is frequently observed even for steels of nominally the same grade or similar steels manufactured by different processing routes. A particular issue is the localised form of corrosion known as mesa at-tack in which some local event initiates very rapid corrosion leading to premature failure3,4. Current strategies for dealing with this form of severe corrosion are deliberately conservative and often result in
the use of highly alloyed expensive duplex stainless steels in order to avoid premature failure particularly in ‘down-hole’ applications. An alternative strategy is to use corrosion inhibitors and corrosion monitoring to prolong the life of a more conventional low cost carbon steel. Even where carbon steels have been used in such applications high failure rates are not uncommon, about 60% of oilield failures result from CO2 corrosion, primarily due to inadequate knowledge or predictive capability, and the poor resistance of carbon and low alloy steels to this form of attack5-7. The same form of corrosion can also occur in gas or oil transmission pipelines where, for purely economic and weldability reasons, a carbon steel must be used and, despite efforts to predict installation lifetimes using models of the corrosion process, premature leaks are not uncommon. Consequently, more reliable corrosion performance of plain carbon pipeline steels in this medium is urgently required.
The experimental programme was sponsored and steered by an industry partnership of four oil companies, Agip (Italy), BP (UK), Elf (France) and Statoil (Norway); and three steelmakers, Corus Group (UK-Netherlands), Dalmine (Tenaris Group) (Italy) and Vallourec (France), and the work was carried out at the University of Leeds (UK) in association with the Institute of Energy Technol-ogy (IFE), Norway. This partnership group established a target and approach at the beginning of the programme.
1.1. The target
• CO2 corrosion resistance 3-4 times higher than the currently used grades of linepipe carbon steel;
• A price increase of no more than 1½ times the alloying cost of the currently used carbon steel grades; and
• Adequate mechanical properties and indicative weldability based upon bead-on-plate hardness test data.
1.2. The approach
• Increase CO2 corrosion resistance of a microalloyed carbon steel by alloying, principally with Cr, but also explore the same with minor additions of other elements e.g. Si, Mo, Cu; • Restrict the carbon concentration: target range 0.02-0.05 wt. (%),
thereby reducing the tendency for chromium carbide formation and also as a means of counteracting the effect of Cr on weld heat affected zone hardness; and
• Introduce strong carbide-forming microalloying elements and maintain concentrations at 50% above the respective alloy carbide stoichiometric ratios with carbon, both to protect the Cr in solid solution and also to achieve the mechanical prop-erties desired: strength and toughness requirements through grain size reinement, and also from the formation of acicular bainitic structures, and precipitation strengthening from alloy carbides.
In addition it was thought desirable to:
• Restrict alloying to 5 wt. (%) maximum to minimise any seg-regation problems; and
• Adjust C, S, P and O levels to that equivalent to an HIC-resistant steel: 0.02 – 0.05 C; < 0.002 S; < 0.015 P; < 0.002 O. The above resulted in an initial alloy base of: 0.04, C 0.5 Mn, 0.3 Si, plus combinations of Cr, Mo, Cu, Nb, V, Ti.
2. Experimental Procedures
Design of the compositions of the experimental steels was ac-cording to the following intentions: Base steel: Carbon 0.03-0.07; Manganese 0.5-1.0, but mainly held at 0.5; Silicon 0.3-1.0, but mainly enhanced to 0.6; Chromium 0, 0.5, 1.0, 1.5, 2.0, 3.0, 5.0; Microalloy-ing: based upon single or combination additions of Niobium 0.03-0.06, Titanium 0.03-0.36, Vanadium 0.14-0.36; and Others: Molybenum 0.3-0.5, Copper 0.25, Nickel 0.2-0.5. The compositions achieved are given in Table 1.
The steels were prepared and treated in various ways: at irst, 50 g argon arc and 800 g induction melts, mainly for sorting, followed by a more limited number of 60 kg vacuum induction melts of promis-ing compositions for simulatpromis-ing manufacturpromis-ing routes for different oilield applications, and for inal corrosion assessment:
(i) For pipelines (BOS/con-cast - TMCR/AC plate - formed and welded): Experimental Treatments: Increasing levels of simulation – Controlled cooling in a high-speed dilatometer; Gleeble experiments to introduce single-step deformation; Pilot plant scale controlled-rolling at Corus Group Technol-ogy Centre. This latter group were the most representative of commercially sized casts, and were examined in the
as-received hot-rolled condition (AR) and in the controlled-rolled state (CR). The 150 mm square 60 kg ingots were cut into two, soaked for 1 hour at 1250 °C, and then half was rolled to 15 mm plate in 10 passes with an 1150 °C roll start temperature, to give the samples designated AR, and the other half rolled to 90 mm thickness with an 1150 °C roll start temperature, and then held to 900 °C before rolling to 15 mm thickness with a inal rolling temperature of 850 °C, to give the samples designated CR; and
(ii) For downhole tubing (BOS or Electric Arc/con-cast - pierced and seamless rolled tube – quenched and tem-pered): Experimental Treatments: Samples in the as-rolled (AR) condition, i.e. soaked for 1 hour at 1250 °C, and then rolled to 15 mm plate in 10 passes with an 1150 °C roll start temperature, were re-austenitised for 45 minutes at 910 °C, water quenched into agitated brine and tempered for 1 hour at 625 °C (treatment QT).
The corrosion testing programme began with a large number of simple sorting tests, mainly of samples from the small-scale melts, followed by more limited low loop testing at the Institute of Energy Technology, IFE, Norway, of the more promising steel compositions identiied of samples processed in different ways from the 60 kg melts. Oxidised samples were also subjected to corrosion testing, in an attempt to simulate the effect on corrosion of mill scale. The oxidation was carried out in air at 550 °C for 1 week.
(i) Sorting corrosion tests: Full polarisation curve and linear polarisation resistance tests were made of the full range of experimental steels. The use of a high pH for full polarisation testing indicated the ability of the steels to passivate in the locally alkalinised conditions prevailing beneath corrosion ilms. Cylindrical dilatometer samples with a surface area of approximately 2 cm2 were used. Examples of the type of 1-litre corrosion cell apparatus used, designed according to ASTM Standard G5-87, are illustrated in Figure 1. Twin platinum counter-electrodes were used, place equi-distant from the sample and separated from the corrosion medium by fritted glass discs. A saturated calomel reference electrode was used, positioned close to the specimen surface using a luggin probe and vycor frit. A pH electrode located in the cell allowed con-stant monitoring of the solution pH throughout the test. CO2 was bubbled through the solution for 1 hour prior to testing; exiting the cell via a water lock, and vigorous stirring of the solution was employed throughout both conditioning and test-ing. Corrosion rate in mm/year was calculated from the full polarisation and linear polarisation resistance tests and steels could also be correspondingly ranked according to critical cur-rent density. Conditions: Full polarisation tests in 1% NaCl + NaHCO3 – pH 8.4 (20 °C, 0.6 Bar CO2); Linear polarisation tests in Forties brine – pH 5.4: (20 °C, 1.0 Bar CO2); and (ii) Flow loop corrosion tests: The low loop apparatus is
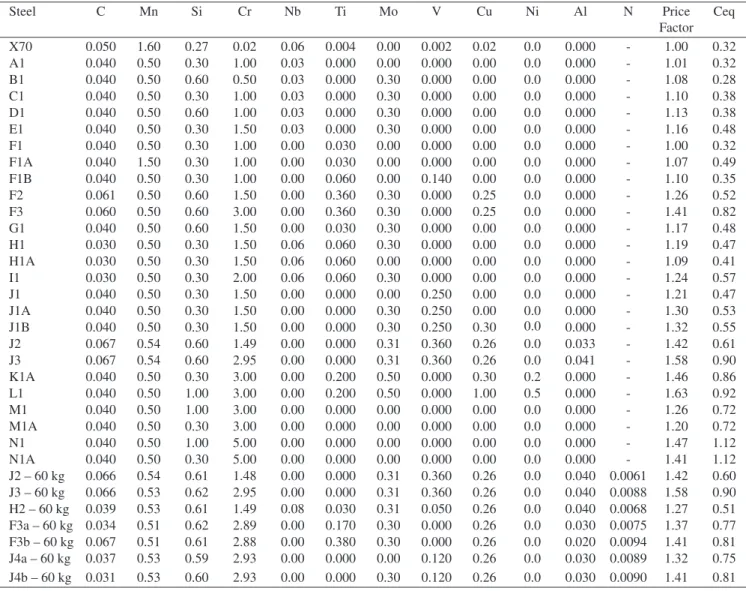
Table 1. Compositions of reference steel X70 and experimental steels (in wt. (%)) (Ceq is the carbon equivalent value).
Steel C Mn Si Cr Nb Ti Mo V Cu Ni Al N Price
Factor Ceq
X70 0.050 1.60 0.27 0.02 0.06 0.004 0.00 0.002 0.02 0.0 0.000 - 1.00 0.32
A1 0.040 0.50 0.30 1.00 0.03 0.000 0.00 0.000 0.00 0.0 0.000 - 1.01 0.32
B1 0.040 0.50 0.60 0.50 0.03 0.000 0.30 0.000 0.00 0.0 0.000 - 1.08 0.28
C1 0.040 0.50 0.30 1.00 0.03 0.000 0.30 0.000 0.00 0.0 0.000 - 1.10 0.38
D1 0.040 0.50 0.60 1.00 0.03 0.000 0.30 0.000 0.00 0.0 0.000 - 1.13 0.38
E1 0.040 0.50 0.30 1.50 0.03 0.000 0.30 0.000 0.00 0.0 0.000 - 1.16 0.48
F1 0.040 0.50 0.30 1.00 0.00 0.030 0.00 0.000 0.00 0.0 0.000 - 1.00 0.32
F1A 0.040 1.50 0.30 1.00 0.00 0.030 0.00 0.000 0.00 0.0 0.000 - 1.07 0.49
F1B 0.040 0.50 0.30 1.00 0.00 0.060 0.00 0.140 0.00 0.0 0.000 - 1.10 0.35
F2 0.061 0.50 0.60 1.50 0.00 0.360 0.30 0.000 0.25 0.0 0.000 - 1.26 0.52
F3 0.060 0.50 0.60 3.00 0.00 0.360 0.30 0.000 0.25 0.0 0.000 - 1.41 0.82
G1 0.040 0.50 0.60 1.50 0.00 0.030 0.30 0.000 0.00 0.0 0.000 - 1.17 0.48
H1 0.030 0.50 0.30 1.50 0.06 0.060 0.30 0.000 0.00 0.0 0.000 - 1.19 0.47
H1A 0.030 0.50 0.30 1.50 0.06 0.060 0.00 0.000 0.00 0.0 0.000 - 1.09 0.41
I1 0.030 0.50 0.30 2.00 0.06 0.060 0.30 0.000 0.00 0.0 0.000 - 1.24 0.57
J1 0.040 0.50 0.30 1.50 0.00 0.000 0.00 0.250 0.00 0.0 0.000 - 1.21 0.47
J1A 0.040 0.50 0.30 1.50 0.00 0.000 0.30 0.250 0.00 0.0 0.000 - 1.30 0.53
J1B 0.040 0.50 0.30 1.50 0.00 0.000 0.30 0.250 0.30 0.0 0.000 - 1.32 0.55
J2 0.067 0.54 0.60 1.49 0.00 0.000 0.31 0.360 0.26 0.0 0.033 - 1.42 0.61
J3 0.067 0.54 0.60 2.95 0.00 0.000 0.31 0.360 0.26 0.0 0.041 - 1.58 0.90
K1A 0.040 0.50 0.30 3.00 0.00 0.200 0.50 0.000 0.30 0.2 0.000 - 1.46 0.86
L1 0.040 0.50 1.00 3.00 0.00 0.200 0.50 0.000 1.00 0.5 0.000 - 1.63 0.92
M1 0.040 0.50 1.00 3.00 0.00 0.000 0.00 0.000 0.00 0.0 0.000 - 1.26 0.72
M1A 0.040 0.50 0.30 3.00 0.00 0.000 0.00 0.000 0.00 0.0 0.000 - 1.20 0.72
N1 0.040 0.50 1.00 5.00 0.00 0.000 0.00 0.000 0.00 0.0 0.000 - 1.47 1.12
N1A 0.040 0.50 0.30 5.00 0.00 0.000 0.00 0.000 0.00 0.0 0.000 - 1.41 1.12
J2 – 60 kg 0.066 0.54 0.61 1.48 0.00 0.000 0.31 0.360 0.26 0.0 0.040 0.0061 1.42 0.60 J3 – 60 kg 0.066 0.53 0.62 2.95 0.00 0.000 0.31 0.360 0.26 0.0 0.040 0.0088 1.58 0.90 H2 – 60 kg 0.039 0.53 0.61 1.49 0.08 0.030 0.31 0.050 0.26 0.0 0.040 0.0068 1.27 0.51 F3a – 60 kg 0.034 0.51 0.62 2.89 0.00 0.170 0.30 0.000 0.26 0.0 0.030 0.0075 1.37 0.77 F3b – 60 kg 0.067 0.51 0.61 2.88 0.00 0.380 0.30 0.000 0.26 0.0 0.020 0.0094 1.41 0.81 J4a – 60 kg 0.037 0.53 0.59 2.93 0.00 0.000 0.00 0.120 0.26 0.0 0.030 0.0089 1.32 0.75 J4b – 60 kg 0.031 0.53 0.60 2.93 0.00 0.000 0.30 0.120 0.26 0.0 0.030 0.0090 1.41 0.81
Figure 1. Two of the types of corrosion cell used.
Thermometer
Salt Bridge Connection
Gas Outlet
Gas Inlet
Auxiliary Electrode Holder
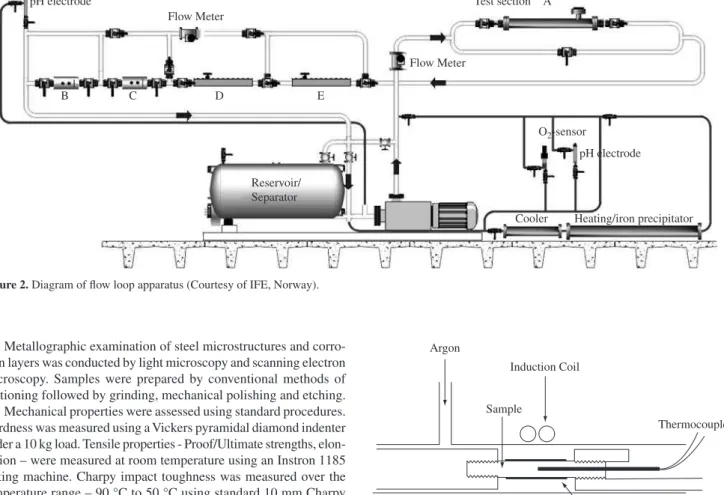
Reservoir/ Separator
B C D E
pH electrode
Flow Meter
Flow Meter
Test section A
Cooler Heating/iron precipitator
pH electrode O2-sensor
Figure 2. Diagram of low loop apparatus (Courtesy of IFE, Norway).
Silica Tube Sample
Argon
Induction Coil
Thermocouple
Figure 3. Schematic diagram of the apparatus used for hot ductility testing. (Courtesy of B. Mintz, City University, UK).
Metallographic examination of steel microstructures and corro-sion layers was conducted by light microscopy and scanning electron microscopy. Samples were prepared by conventional methods of sectioning followed by grinding, mechanical polishing and etching. Mechanical properties were assessed using standard procedures. Hardness was measured using a Vickers pyramidal diamond indenter under a 10 kg load. Tensile properties - Proof/Ultimate strengths, elon-gation – were measured at room temperature using an Instron 1185 testing machine. Charpy impact toughness was measured over the temperature range – 90 °C to 50 °C using standard 10 mm Charpy V-notch specimens.
Hot ductility tests were carried out to assess resistance to transverse slab cracking during continuous casting. The tests were conducted according to a method devised by Mintz18 and illustrated in Figure 3. Cylindrical specimens 7.9 mm diameter by 110 mm length, with threaded ends and an inserted central thermocouple, are encased in a silica tube under an inert atmosphere in an induction furnace. The centre of the sample is then melted at 1540 °C before cooling to temperatures in the range 700-1100 °C, holding at tem-perature for 5 minutes, and then tensile testing to failure at a strain rate of 3 x 10⁻³ s-1.
Standard bead-on-plate weldability tests were made according to BS7363:1990. Conditions: Arc voltage 10 ± 0.5 V Electrode DC Negative; Current 200 ± 5 A; Travel Speed 120 ± 5 mm/min; Nominal Arc Energy 1.0 kJ/mm.
Thermodynamic phase diagram calculations, using MTDATA and ThermoCalc, allowed construction of segments of the equilibrium phase diagrams of the experimental steels, to assist with interpretation of the effects of the alloying element additions upon microstructure during heat treatment and processing. An MTDATA package19 and SGTE (Scientiic Group Thermodata Europe) solution database20 were used.
3. Results and Discussion
Results of the initial bench-top corrosion testing programme are shown in Figure 4, and demonstrate that the alloying approach could improve the corrosion resistance above that of X70 steel. Chromium addition was most effective, as expected, but so were some of the other element additions considered. Differences could also be identi-ied between the different conditions of the steels: in the hot-rolled condition (AR), in the controlled-rolled state (CR) or quenched and
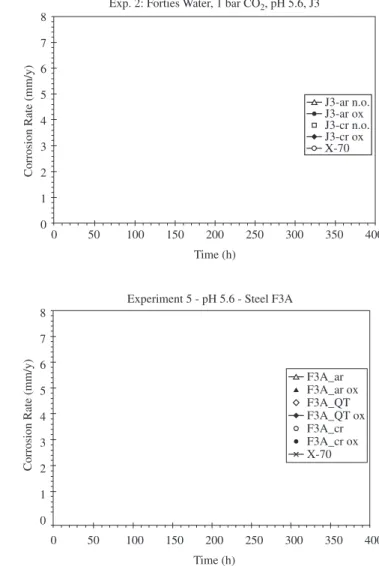
tempered (QT). Following the promise of these preliminary tests a schedule of low loop tests, more representative of oil-ield conditions, was conducted on the steels showing most potential, and the results are given in Figure 5. Again the alloyed steels exhibited more resist-ance to corrosion than X70 steel, and moreover, the best steels had a corrosion rate 5 times better than that of X70, meeting the initial target set. The tests also showed the initial corrosion rate of the experimental steels decreasing with time, whereas that of the X70 steel increased with time (Figure 6). This suggests the development of a protective surface ilm passivating the corrosion reaction, and evidence of this was observed. Figure 7 shows the cross-section of the corrosion ilm on a 3% Cr steel (J4a) low-loop tested for 14 days in Forties brine. This ilm was adherent, with uniform thickness (~ 50-100 µm), and few cracks (despite drying at 70 °C before observation by scanning electron microscopy). Energy dispersive X-ray analysis indicated that the ilm was Cr-rich, and also contained V that was an addition to this steel (0.12 wt. (%)).
Laboratory Melts Shown in Order of Corrosion Rate at pH 5.4
X70 G1 E1 J1 F1 D1 H1a J1a F2 F3 H1 I1 M1a K1a M1 N1
(mm/yr)
1.6
1.4
1.2
1
0.8
0.6
0.4
0.2
0
8
7
6
5
4
3
2
1
0
0 50 100 150 200 250 300 350 400
Time (h)
Corrosion Rate (mm/y)
Exp. 2: Forties Water, 1 bar CO2, pH 5.6, J3
J3-ar n.o. J3-ar ox J3-cr n.o. J3-cr ox X-70
60 kg Melts Shown in Order of Average Corrosion Rate at pH 5.6 (IFE Flow-Loop Tests 2 and 5)
X65 X70
J2
AR
H2
AR
F3B QT F3A
AR
F3B
AR
J3
AR
F3A QT F3B CR J4A CR J2 CR H2 CR F3A CR J4B CR J4A
AR
J3 CR
(m
m
/y
r)
8
7
6
5
4
3
2
1
0
Figure 5. Flow-loop corrosion tests showing corrosion rate for a range of steels from the 60 kg melts.
Figure 4. Laboratory sorting corrosion tests showing corrosion rate for a range of steels from the 25 g laboratory melts and 60 kg melts, illustrating the effect of alloying coupled with the processing route (AR = As-rolled; CR = Controlled-rolled; QT = Quenched and tempered).
60 kg Melts Shown in Order of Corrosion Rate at pH 5.4
J2
AR
H2
AR
H2 CR J2 CR J3
AR
J4a CR J3 CR J4b CR F3a QT H2 QT J2 QT J3 QT F3a
AR
J4a
AR
F3b QT F3b
AR
F3b CR F3a CR
Corrosion Rate (mm/yr)
1.4
1.2
1
0.8
0.6
0.4
0.2
0
8
7
6
5
4
3
2
1
0
0 50 100 150 200 250 300 350 400
Time (h)
Corrosion Rate (mm/y)
F3A_ar F3A_ar ox F3A_QT F3A_QT ox F3A_cr F3A_cr ox X-70 Experiment 5 - pH 5.6 - Steel F3A
Figure 6. Flow-loop corrosion tests showing corrosion rate as a function of time.
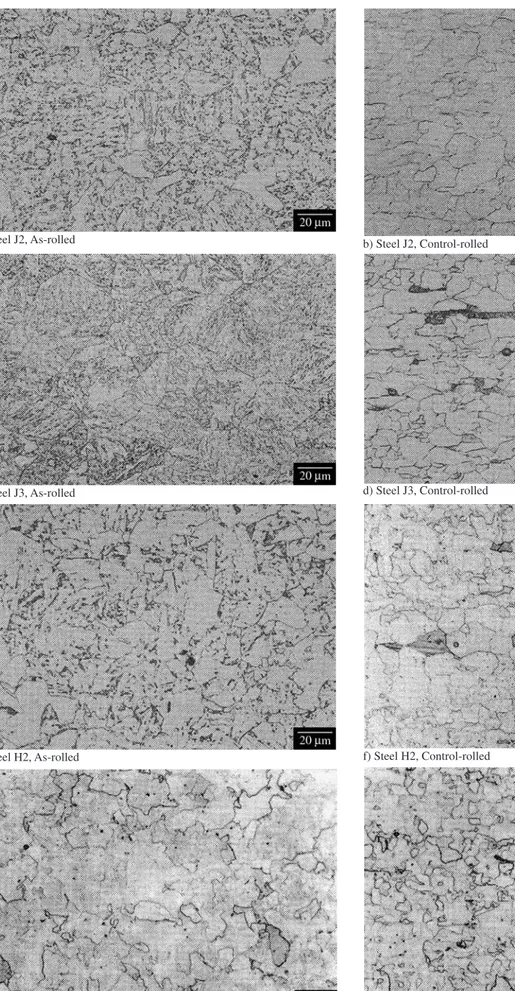
b) Steel J2, Control-rolled a) Steel J2, As-rolled
d) Steel J3, Control-rolled c) Steel J3, As-rolled
e) Steel H2, As-rolled f) Steel H2, Control-rolled
g) Steel F3a, As-rolled h) Steel F3a, Control-rolled
i) Steel J2, Quenched and tempered
j) Steel J3, Quenched and tempered
k) Steel H2, Quenched and tempered
Figure 8. Light micrographs illustrating the microstructures of a selection of the experimental steels.
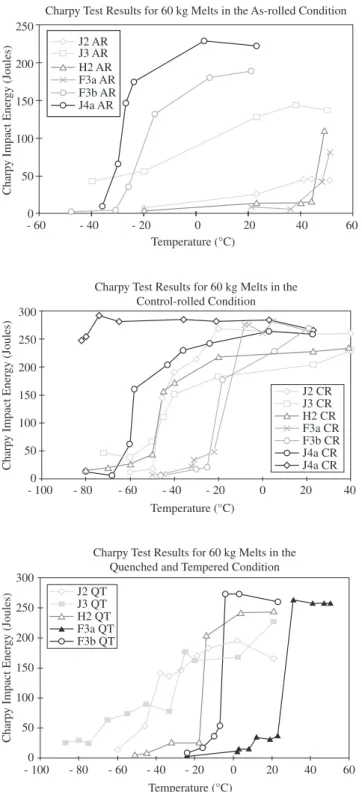
Charpy Test Results for 60 kg Melts in the As-rolled Condition
Charp
y Impact Ener
gy (Joules)
250
200
150
100
50
0
- 60 - 40 - 20 0 20 40 60
Temperature (°C) J2 AR
J3 AR H2 AR F3a AR F3b AR J4a AR
Charpy Test Results for 60 kg Melts in the Control-rolled Condition 300
250
200
150
100
50
0
- 100 - 80 - 60 - 40 - 20 0 20 40
Temperature (°C)
Charp
y Impact Ener
gy (Joules)
J2 CR J3 CR H2 CR F3a CR F3b CR J4a CR J4a CR
Charpy Test Results for 60 kg Melts in the Quenched and Tempered Condition 300
250
200
150
100
50
0
- 100 - 80 - 60 - 40 - 20 0 20 40 60
Temperature (°C)
Charp
y Impact Ener
gy (Joules)
J2 QT J3 QT H2 QT
F3b QT F3a QT
Figure 9. Charpy impact energy versus test temperature.
carbon microalloyed steels21: quasi-polygonal ferrite (for controlled-rolled, CR) and quasi-polygonal ferrite plus granular bainitic ferrite (for as-rolled, AR). The QT samples exhibited a more customary tempered martensite microstructure.
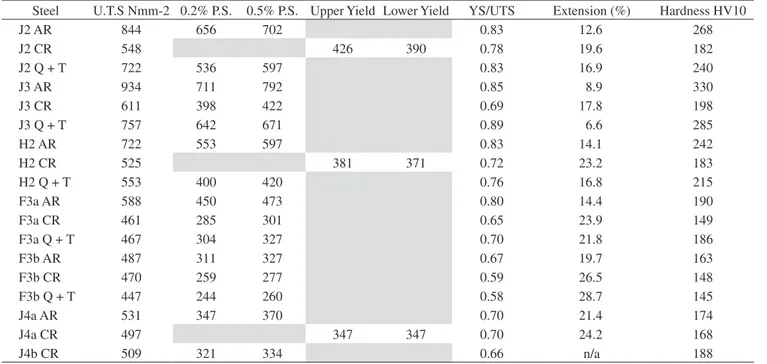
The mechanical properties of the experimental steels are illus-trated in Table 2 and Figure 9. Table 2 lists the hardness and tensile properties, and Figure 9 shows the Charpy impact energy values plotted against temperature, giving a clear indication of the relative ductile-brittle transition temperatures (DBTT). In general, the results
Table 2. Hardness and tensile properties of the 60 kg melts in the various processed conditions.
Steel U.T.S Nmm-2 0.2% P.S. 0.5% P.S. Upper Yield Lower Yield YS/UTS Extension (%) Hardness HV10
J2 AR 844 656 702 0.83 12.6 268
J2 CR 548 426 390 0.78 19.6 182
J2 Q + T 722 536 597 0.83 16.9 240
J3 AR 934 711 792 0.85 8.9 330
J3 CR 611 398 422 0.69 17.8 198
J3 Q + T 757 642 671 0.89 6.6 285
H2 AR 722 553 597 0.83 14.1 242
H2 CR 525 381 371 0.72 23.2 183
H2 Q + T 553 400 420 0.76 16.8 215
F3a AR 588 450 473 0.80 14.4 190
F3a CR 461 285 301 0.65 23.9 149
F3a Q + T 467 304 327 0.70 21.8 186
F3b AR 487 311 327 0.67 19.7 163
F3b CR 470 259 277 0.59 26.5 148
F3b Q + T 447 244 260 0.58 28.7 145
J4a AR 531 347 370 0.70 21.4 174
J4a CR 497 347 347 0.70 24.2 168
J4b CR 509 321 334 0.66 n/a 188
thermodynamic calculation of the equilibrium diagram, which in this case also predicted part of the Ti addition in the form of undis-solved Ti(C,N), meaning that the Ti is not fully participating in the expected way in this composition. Thermodynamic analysis also indicated that more pronounced segregation, as would be expected in continuously cast products, could result in delta-ferrite formation in the higher Si and Cr casts.
A typical result of the hot ductility tests, conducted to detect whether transverse cracking during continuous casting may be a problem with these new steel compositions, is shown in Figure 10 for steel J3. The reduction in hot ductility is not severe, with a minimum reduction in area of 56% recorded at 850 °C, which should not present any problems for continuous casting.
In contrast, the bead-on-plate weldability tests on J and H series steels in the controlled-rolled condition (Table 3) showed that it would be dificult to meet heat affected zone hardness below the accepted minimum of 248 VPN common to fabrication welding speciications at these levels of alloying element addition. Whilst the bead-on-plate data suggest it may be dificult to deploy these compositions for linepipe steels that require fabrication by fusion welding, the heat affected zone hardness under fabrication conditions is more closely related to girth welding procedures than to alloying per se. However, as the hardness was borderline in many cases, it is felt that this is an issue that should be addressed further.
4. Conclusions
• Performance against targets: A corrosion rate 5 times lower than X70 and 6 times lower than X65 was achieved, surpassing the initial target requirement set. This was achieved at a price factor of 1.58 times the cost of X70, only marginally above the initial target cost of 1.5. Adequate mechanical properties were achieved but the steels exhibiting the best corrosion resistance required alloying element levels that caused them to fall short of the weldability criteria required of linepipe steels; • Cr addition was the most effective in reducing corrosion rate,
provided that suficient Cr is left in solid solution;
Table 3. Maximum hardness values recorded from the bead-on-plate weld-ability test specimens.
Hardness VPN
Steel Parent HAZ Weld metal
J2 CR 179 283 327
J3 CR 185 351 351
H2 CR 179 242 281
J4b CR 169 285 279
Hot Ductility Curve for Steel J3
750 800 850 900 950 1000 1050
Temperature (°C)
Reduction of
Area (%)
100
90
80
70
60
50
40
30
20
10
0
Figure 10. An example of the hot ductility test results.
• 3 wt. (%) Cr addition offered the target reduction in corrosion rate; 1.5 wt. (%) Cr was insuficient to ensure this level of resistance;
• Enhanced Si, and additions of Mo and Cu, were beneicial to corrosion rate;
• Corrosion rates from 3 to 10 (steel composition J4b) times less than the reference steel were recorded;
• The best corrosion rates (of selected steels in low-loop tests) were recorded for steels in the controlled-rolled condition rather than as-rolled;
• The effect of the pre-oxidation experiments was inconclusive and needs further work - it is probable that it does not accurately relect mill-scale;
• The most promising steel compositions (in terms of both corro-sion resistance and mechanical properties) were in the J series e.g. J3 based upon 3 wt. (%) Cr at 0.07C – 0.53 Mn + enhanced Si (0.6) + V microalloying (0.36) + Mo (0.31) + Cu (0.26). (Ti addition can be beneicial to corrosion but the mechanical properties were more variable and dificult to control); • The corrosion rate is improved by formation of a Cr-rich ilm:
this ilm forms under conditions when iron carbonate ilms are barely stable and grows down to pH 5. V addition improves the adherence of this ilm;
• The mechanical properties achievable were found to be: PS 400 – 700 MPa; UTS 600 – 900 MPa; El% 9 – 20; Charpy impact energies up to > 250 J with DBTT down to < – 80 °C. (However, some problems were identiied with the cleanliness of the casts and the formation of incorrect microstructures for the heat treatments used, which means that there is some scope to improve the mechanical properties above those measured for some of the experimental steels);
• Hot ductilities are suficient (in the steels assessed) to avoid transverse cracking problems during continuous casting; and • Weldability remains an issue for the best composition ranges
identiied, limiting their suitability at the present time to downhole applications.
Acknowledgments
The programme was sponsored by Agip, BP, Elf, Statoil, Corus Group, Dalmine (Tenaris Group) and Vallourec. The project work was largely conducted and managed by Dr M Dougan with assistance from Dr RM Grau; the low loop tests were carried out at IFE, Norway under the direction of Dr A Dugstad and M Seiersten, and the hot ductility tests at City University, London, by Professor B Mintz. The following members of the Steering Group are also gratefully acknowledged for their advice: A Kopliku (Agip), MB Kermani (BP), J-L Crolet (Elf), S Olsen (Statoil), AW Johnson (Corus Group), G Cumino, S Renato (Dalmine), C Linne (Vallourec) and especially the late Professor J Nutting, Emeritus Professor at the University of Leeds.
References
1. UK-Brazil Integrity & Corrosion Control Network. http://www.uk-brazil-corrosion.net.
2. Crolet J-L. 10thEuropean Corrosion Congress. Barcelona, Spain. 1993.
p. 473.
3. Cross DE. ‘Corrosion 93’. NACE Annual Conference. Houston. 1993. p. 118.
4. Crolet J-L. In ‘Predicting CO2Corrosion in the Oil and Gas Industry’.
Kermani M.B. and Smith L.M., editors. EFC (European Federation of Corrosion); 1994.
5. Kermani MB, Smith LM. ‘CO2Corrosion Control in Oil and Gas Produc-tion – Design ConsideraProduc-tions’. EFC (European Federation of Corrosion); London: IoM; 1999.
6. Rabald V. ‘Corrosion Guide’. Elsevier; 1968.
7. ASM Metals Handbook. ‘Corrosion’. vol. 13, 1987.
8. Dugstad A. ‘Mechanism of protective ilm formation during CO2 corrosion
of carbon steels’. ‘Corrosion 98’. NACE Annual Conference. San Diego. 1998. p. 31.
9. Dugstad A, Hemmer H, Seiersten M. ‘Effect of steel microstructure upon corrosion rate and protective iron carbonate ilm formation’. ‘Corrosion 00’. NACE Annual Conference. Orlando; 2000.
10. Alhajji JN, Reda MR. Corrosion Science. 1993; 34:1899.
11. Ikeda I, Ueda M. ‘CO2Behaviour of Cr-Containing Steels’, EFC (Euro-pean Federation of Corrosion); London: IoM. 1994. p. 13.
12. Nice PI, Ueda M. ‘The effect of microstructure and chromium alloy-ing content to the corrosion resistance of low-alloy steel well tuballoy-ing in seawater injection service’. ‘Corrosion 98’. NACE Annual Conference. San Diego. 1998. p. 3.
13. Nyborg R, Dugstad A, Dronen P. ‘Effect of chromium on mesa corro-sion attack of carbon steels’, ‘Corrosion 00’. NACE Annual Conference. Orlando. 2000.
14. Nice PI, Takeda H, Ueda M. ‘The development and implementation of a new alloyed steel for oil and gas production wells’. ‘Corrosion 00’. NACE Annual Conference. Orlando. 2000. p. 154.
15. Ueda M. and Takebe H. ‘Corrosion resistance of low Cr bearing steel in sour and sweet environments’. ‘Corrosion 02’. NACE Annual Conference. Denver. 2002. p. 41.
16. Kermani MB, Gonzales JC, Linne C, Dougan M, Cochrane RC. ‘Develop-ment of low carbon Cr-Mo steels with exceptional corrosion resistance for oilield applications’. ‘Corrosion 01’. NACE Annual Conference. 2001. p. 1065.
17. Kermani MB, Gonzales JC, Turconi GL, Edmonds DV, Dicken G, Scop-pio L. ‘Development of superior corrosion resistance 3%Cr steels for downhole applications’. ‘Corrosion 03’. NACE Annual Conference. San Diego. 2003. p. 3116.
18. Mintz B. City University, London, UK, private communication.
19. Davies RH, Dinsdale AT, Chat TG, Barry TI, Rand MH. High Temp. Sci.; 1990; 26:251.
20. Ansara I, Sundman B. in ‘Computer Handling and Dissemination of Data’. Report CODATA. 1987. p. 154.