ISSN 1517-7076 artigo 11625, pp.571-579, 2015
Corresponding Author : Edgardo Roque Benavidez Received on: 27/03/2015 Accepted on: 03/06/2015
10.1590/S1517-707620150003.0058
Thermal and mechanical properties of
commercial MgO-C bricks
Edgardo Roque Benavidez 1, Elena Brandaleze 1, Yamila Soledad Lagorio 1, Sebastián Emiliano Gass 2, Analía Gladys Tomba Martinez 2
1 Dto. Metalurgia / DEYTEMA - Facultad Regional San Nicolás (UTN) - Colón 332, (2900) San Nicolás, Argentina.
e-mail: [email protected]
2 INTEMA– CONICET/Fac. Ingeniería (UNMdP) - Av. Juan B. Justo 4302 (7600) Mar del Plata.
e-mail: [email protected]; [email protected]; [email protected]; [email protected]
ABSTRACT
MgO-C (magnesia-carbon) refractories are widely used in several steelmaking linings. These refractories are exposed to extreme stress due to high temperatures (T > 1600 °C) required to cause the metallurgical reactions. These working conditions produced refractory wear through various related processes. The different types of degradation that the material suffers can be from thermochemical or thermomechanical origin. In this work, the Young's modulus, the fracture resistance and the thermal expansion coefficient of three commercial magnesia-carbon bricks (A, B, and C) were measured to evaluate their resistance to thermomechanical degradation. These data provided an estimation of the thermomechanical stresses that they can withstand. According to the results, the lowest fracture toughness is developed by brick C. This behavior is associated to a higher porosity and quality of the binder and magnesia used. Furthermore, while the brick B has the highest resistance to crack initiation due to thermal shock, the brick A proves to be the most suitable, taking into account the relationship between resistance to the initiation and propagation of cracks. A greater degree of strain to the level of the fracture stress is also presented in the bricks A and B. This is connected to their higher content of graphite (9-12 %) compared to brick C (~ 4 %).
Keywords: Refractories, MgO-C, Mechanical Properties, Thermal Properties, Microstructure.
1. INTRODUCTION
MgO-C (magnesia-carbon) refractory bricks are widely used in steel industry, the primary consumer of refractory linings, such as basic oxygen furnaces, electric arc furnaces, and ladle furnaces. The steelmaking requires extreme chemical, thermal and mechanical conditions that demand a high performance of materials, able to withstand the action of the steel bath and slag [1]. These working conditions produce refractory wear through various related processes. The different types of degradation that the material suffers can be from (a) thermochemical origin (corrosion), mainly due to slag attack and the interaction of the material with the atmosphere or (b) thermomechanical origin, due to (i) stress, generated by temperature gradients, agitation of the converter, the impact of the load and (ii) abrasion, caused by the presence of gases, liquid and particles moving. The main properties which determine the resistance to the refractory thermomechanical degradation are the stiffness (evaluated by the Young´s modulus), the fracture resistance, the thermal expansion coefficient and the thermal conductivity.
572 Optimum mechanical properties are related to inelastic deformation (or flexibility) offered by the presence of graphite. In the mechanical evaluation of these materials, (i) modulus of rupture (MOR), (ii) the compressive strength (CCS), (iii) the hot modulus of rupture (HMOR) and (iv) deformation, are used. Moreover, the stress-strain curves are a suitable source to access to this information and they can be obtained in different conditions of temperature and atmosphere.
In this work the Young’s modulus, the rupture strength and the thermal expansion coefficient of three commercial MgO-C bricks were determined. In order to link the thermal and mechanical properties to the structure of each material, the percentage of the aggregate and the matrix phases present in the three materials was determined.
2. MATERIALS AND METHODS
Three commercial MgO-C bricks, called A, B and C, of different qualities were studied. From the original bricks, some samples were taken for porosity and density testing. Five samples of each material were evaluated by Archimedes method using kerosene as immersion liquid.
Prismatic shape samples (mass between 10-15 g) were extracted from the original bricks and were dried at 100 ºC (over 2 hours). Then, these samples were calcined at 1000 ºC (in air) for 2 hours to determine the loss on ignition (LOI). The mass was determined, before and after the calcination, to an accuracy of 0.0001 g. Other similar samples were grounded in a laboratory milling (Pulverisette). The powder obtained was analyzed in a simultaneous DTA-TG equipment (Shimadzu DTH-60) up to 1000 ºC in air at a heating rate of 10 ºC/min.
Internal protocols to evaluate the mechanical stress-strain curves in compression on prisms of square cross section (30x50 mm) were followed [5]. An universal servohydraulic mechanical testing machine (Instron 8501) was used and the sample deformation was determined by an axial capacitive extensometer (Instron ± 0.6 μm). The mechanical tests were carried out at room temperature with a speed of 0.1 mm/min until failure of the specimen.
A horizontal dilatometer (Theta Dilatronic II) was used to determine the thermal expansion coefficient with samples 45-50 mm in length. The heating and cooling rate were of 3 ºC/min in air atmosphere up to 1200 °C.
A zoom stereo microscope (Olympus SZ61) and an inverted metallurgical microscope (Olympus GX51) with image analyzer Leco IA 32 were used for microstructure observations, as shown in Figs. 1-3. The samples of the bricks were cut, embedded in acrylic resin, and polished with diamond paste down to 1 μm particle size.
Figure 1: Image of the microstructure of brick A (G: graphite, A: antioxidants, and ME: electrofused magnesia).
Fig. 1 shows an optical microscopy image of brick A, highlighting electrofused magnesia grains (ME). Besides, the presence of antioxidants (A), graphite (G) in the form of flakes, and smaller ME grains (< 100 µm) are observed in the matrix.
Brick B presents electrofused (ME) and sintered (MS) magnesia grains of different sizes, as shown in Fig. 2. Generally, this sample presents ME particles larger than MS ones. In the matrix, graphite flakes (G) are observed as occurs in the others samples. Even though metallic antioxidants (bright spots) are observe in
ME
573 the brick B, they are present in a minor proportion than in bricks A and C.
Figure 2: Image of the microstructure of brick B (ME: electrofused magnesia, and MS: sintered magnesia).
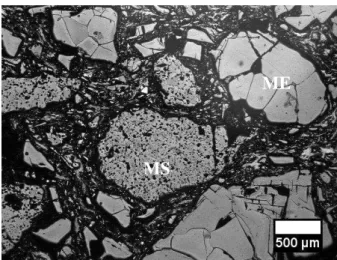
Figure 3 shows the microstructure of brick C that presents electrofused and sintered magnesia grains with a higher proportion of the latter. Both types of MgO grains are observed in the matrix and as the aggregates (size > 500 µm).
Figure 3: Image of the microstructure of brick C (ME: electrofused magnesia and MS: sintered magnesia).
3. RESULTS
3.1 Physical properties and microstructure
Table 1 shows several characteristics of the studied materials. These data correspond to technical information of each material. The values of oxides are in weight percentage (wt %).
ME
MS
MS
574
Table 1: Technical data of bricks.
DESCRIPTION A B C
Bond Resin Resin Mix
MgO 98 > 97 > 96
Al2O3 0.10 < 0.20 < 0.20
Fe2O3 0.40 < 0.60 < 0.60
CaO 1.10 > 0.80 > 0.80
SiO2 0.40 < 0.40 < 0.40
C-residual (wt %) 14 > 12 > 7
Bulk density (g/cm3) 2.97 > 2.99 > 2.90
Apparent porosity (vol %) 4 < 5 < 7
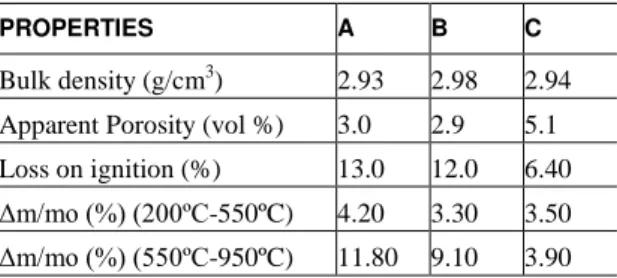
Table 2 list the values of apparent porosity, bulk density and loss on ignition of the bricks obtained by laboratory test. The values of porosity and bulk density of the bricks are consistent with the technical data values of Table 1. The loss on ignition (LOI) at 1000 °C, reported in Table 2, can be associated to the percentage of residual carbon (C-residual) in Table 1.
Table 2: Physical properties of bricks.
PROPERTIES A B C
Bulk density (g/cm3) 2.93 2.98 2.94
Apparent Porosity (vol %) 3.0 2.9 5.1
Loss on ignition (%) 13.0 12.0 6.40 Δm/mo (%) (200ºC-550ºC) 4.20 3.30 3.50 Δm/mo (%) (550ºC-950ºC) 11.80 9.10 3.90
The main losses of mass (m/mo), according to thermogravimetric curves, were observed in two temperature ranges. The first range, between 300-550 ºC, is attributed to loss of volatiles in the organic bond. The second range, between 550-950 ºC, is assigned to graphite oxidation [6]. In Table 2 the mass loss percentages in both temperature ranges are presented. In agreement to these TG data, the brick A has the highest contents of organic bond and graphite, which is corroborated by the loss on ignition at 1000 ºC.
Table 3 is constructed according to the computing phase (in % of area occupied) performed on images of the microstructure observed in the three bricks. In this Table, the percentages of MgO aggregates (sintered or electrofused) and matrix are presented.
Table 3: Percentage of phases (area %) in the bricks, where ME are aggregates of electrofused-MgO and MS are
aggre-gates of sintered-MgO.
BRICK ME (%) MS (%) MATRIX (%)
A 47 0 53
B 40 4 56
C 17 34 49
From these data the following information is obtained: (i) brick A contains only electrofused magnesia, (ii) brick B presents the highest percentage of matrix phase, and (iii) brick C has the highest percentage of sintered-MgO aggregates and the minor percentage of matrix.
3.2 Thermal and mechanical properties.
575 these curves, the fracture strength (σF) and the strain at fracture (εF) are determined, taking as fracture criterion the maximum stress value recorded. Young´s modulus is calculated as the slope of the secant line of the curve drawn from the origin to a predetermined strain point ( = 0.005 for these materials).
Figure 4: Compression stress-strain curve for brick A.
Figure 5: Compression stress-strain curve for brick B.
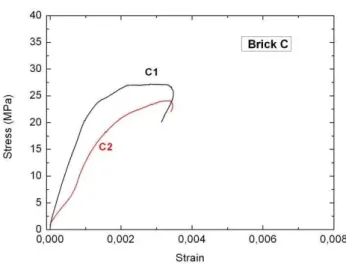
Figure 6: Compression stress-strain curve for brick C.
The mechanical parameters obtained from stress-strain curves corresponding to two testing samples of each material are reported in Table 4. The average value of each parameter is also listed for each material.
576
Table 4: Mechanical parameters of refractory bricks.
BRICK SAMPLE σF(MPA) εF (%) E0.0005(GPA)
A A1 23.8 0.38 10.6
A2 23.4 0.50 13.5
B B1 37.4 0.31 9.0
B2 34.1 0.62 8.9
C C1 27.1 0.33 11.9
C2 24.1 0.34 5.5
The coefficients of linear thermal expansion (α) of the three bricks are listed in Table 5. In this case, the average value of α was selected at 300 ºC, taking into account that at this temperature, each sample has (approximately) the same components as at room temperature (RT). Namely, no loss of any carbonaceous compound at 300 ºC is considered, because in the range 100-300 °C any change in the mass of samples was detected from TG data.
Table 5: Coefficients of linear thermal expansion at 300 ºC.
BRICK α (300 ºC)
A 8.6 x 10⁻⁶ B 10.8 x 10⁻⁶ C 11.3 x 10⁻⁶
The lowest coefficient of thermal expansion is associated to material A, which has the highest content of carbonaceous material.
4. DISCUSSION
The stress-strain curves indicate a quasi-fragile behavior in all materials studied. This means that, for small deformations, curves are almost linear and then diverge from linearity up to the maximum load. MgO-C refractories exhibit a non-linear behavior even for extremely low strains. Schmitt et al [7] concluded that elastic properties such as Young´s modulus is limited to strains below 10-5. In the mentioned work, the authors obtained E = 10.6 GPa (for axial strain = 0.0005) in a compression uniaxial crushing test of a MgO-C refractory brick bonded with a resin binder. That material, containing 13.1 wt% in MgO-C, exhibited a similar value of the Young´s modulus obtained in the present work to sample A1 (brick A).
According to the thermomechanical data the degree of thermal shock resistance which presents each of refractory bricks can be analyzed and compared. Thermal shock can be defined as severe cracking due to rapid temperature changes. Failure due to thermal shock is caused by changes in dimensions of the bricks and occurs at points where the stress exceeds the tensile strength of the material. This usually occurs when the material is fragile and it is unlikely above 1100 ºC where the plastic flow can occur in ceramics. Considering only the material properties, the thermal shock is aggravated by (i) a high coefficient of thermal expansion, (ii) a low thermal conductivity and (iii) a low fracture stress [8].
For infinite slabs, long cylinders (solid or hollow) and spheres (solid or hollow), the maximum stress occurs at the surface during cooling according to the expression [9,10]:
T
E
T
1
(1)577 decrease, increasing the thermal conductivity (k) of the material. In our case, this can be achieved by increasing the content of phases with a high thermal conductivity (like carbonaceous phases) or by reducing porosity.
The equation (1) can be reordered giving a thermal shock resistance parameter (R) according to the expression [9,10]:
E
R
1
(2)The R parameter is indicative of resistance to crack initiation by thermal shock; the same has units of °C, and represents the maximum temperature gradient before cracks in the material are formed. That is, the higher the value of R, the greater the resistance to nucleate cracks due to stress by thermal origin.
Also, the resistance to crack propagation (R´´´) may be analyzed, from the expression [9,10]:
1
´´´
E
2R
(3)In this case the unit is Pa-1, and indicates the minimum elastic energy, in the fracture zone, available for the crack propagation.
These parameters can be used in the selection of materials for certain applications with determined thermal and mechanical conditions. In this case, the higher values of R and R´´´ indicates the greater resistance to the initiation and the propagation of cracks, respectively.
Taking the values obtained in the compressive tests and the dilatometric runs (Table 4 and 5), and considering 0.15 as Poisson´s coefficient [11], then the parameters R and R´´´ can be estimated for the three bricks, as shown in Table 6.
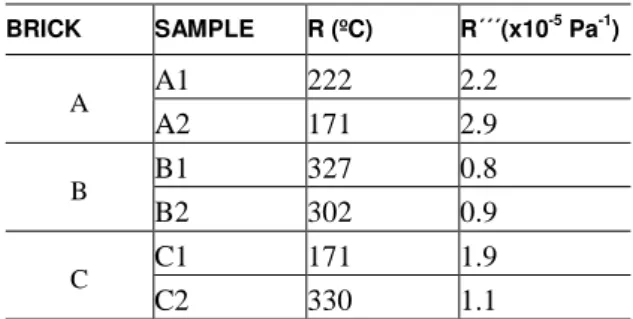
Table 6: Resistance to the initiation and propagation of cracks by thermal shock.
BRICK SAMPLE R (ºC) R´´´(x10-5
Pa-1
)
A A1 222 2.2
A2 171 2.9
B B1 327 0.8
B2 302 0.9
C C1 171 1.9
C2 330 1.1
Note that the effects of σT and E are opposite for the creation and for the propagation of the crack. Thus, while brick B presents high resistance to the initiation of the crack by thermal shock (high R), the same brick presents the lowest energy necessary for the propagation of the crack. The low value of R´´´ can be attributed to the quotient σF2/E (Eq.3) corresponding to the stored elastic energy at the level of σF. In applications where the crack by thermal shock should be avoided, the parameter R must be considered. Considering this aspect, the brick B is the most indicated for this type of application.
On the other hand, the parameter R´´´ is relevant in refractories bricks since these materials often contain a large population of inherent flaws (pores and microcracks). Samples A1 and A2 (brick A) present the highest value of R´´´ (Table 6) indicating brick A has the highest resistance to the crack propagation.
578 brick B could be given by the higher content of graphite, because brick A only contains electrofused magnesia of high strength.
Greater values of deformation (εF) are presented in the materials with a higher percentage of graphite (bricks A and B). In these cases, the presence of graphite allows the brick to adjust the effort applied through the creep, thus increasing the strain at the fracture [13].
Considering the thermal shock resistance of the three materials, the brick A appears to meet the best combination of thermomechanical properties considering the resistance to both the nucleation and the propagation of cracks (parameters R and R```).
5. CONCLUSIONS
According to mechanical and thermal properties determined at room temperature, and the structural assessment of commercial MgO-C bricks, the present study highlights that:
(i) At room temperature, these properties are mainly governed by the carbonaceous materials present in the matrix of the bricks.
(ii) The carbon content presents in both the binder and the graphite, contributes to achieve a higher resistance to initiation of cracks due to thermal shock.
(iii) A higher content of graphite is directly related to a greater deformation at the fracture level. (iv) A higher porosity and a higher percentage of sintered magnesia, along with the quality of the
binder, would contribute to reduce the firebrick´s fracture strength at room temperature.
6. ACKNOWLEDGEMENTS
The authors wish to thank Universidad Tecnológica Nacional (Argentina) for the partial financial support of this work.
7. BIBLIOGRAPHY
[1] LASQUIBAR, J.I., RIBERA, C., “Refractarios de magnesia-carbono para cucharas”, Boletín de la Socie-dad Española de Cerámica y Vidrio, v. 28, n. 5, pp. 385-393, Sep.-Oct. 1989.
[2] ZHANG, S., MARRIOTT, N.J., LEE, W.E., “Thermochemistry and microstructures of MgO–C refracto-ries containing various antioxidants”, Journal of the European Ceramic Society, v.21, n. 8, pp.1037-1047, Aug. 2001.
[3] BAUDIN, C., ALVAREZ, C., MOORE, R.E., “Influence of Chemical Reactions in Magnesia-Graphite Refractories: I, Effects on Texture and High-Temperature Mechanical Properties”, Journal of the American Ceramic Society, v. 82, n. 12, pp. 3529-3538, Dec. 1999.
[4] COOPER, C.F, “Refractory Application of Carbon”, British Ceramic, Transaction and Journal, v. 84, pp. 48-53, 1985.
[5] CABRERA, M.S., CALAFIORE, C.A., TOMBA MARTÍNEZ, A.G., et al., “Comportamiento mecánico a alta temperatura de refractarios MgO-Al2O3-C de uso siderúrgico”, In: 7º Congreso SAM-CONAMET, pp. 1039, Argentina, Sept. 2007.
[6] VIEIRA JR, W., RAND, B., In: Proceeding UNITECR `97, pp. 815, New Orleans, USA, 1997.
[7] SCHMITT, N., BERTHAND, Y., POIRIER, J., “Tensile behaviour of magnesia carbon refractories”, Journal of the European Ceramic Society, v.20, n. 12 , pp.2239-2248, Nov. 2000.
[8] LEE, W.E., RAINFORTH, W.M., In: Lee, W.E and Rainforth, W.M (eds), Ceramic microstructures, 1st ed., Cambridge, Chapman & Hall, 1994.
[9] HASSELMAN, D.P.H., “Elastic Energy at Fracture and Surface Energy as Design Criteria for Thermal Shock”, Journal of the American Ceramic Society, v. 46, n. 11, pp. 535-540, Nov. 1963.
[10] HASSELMAN, D.P.H., “Unified Theory of Thermal Shock Fracture Initiation and Crack Propagation in Brittle Ceramics”, Journal of the American Ceramic Society, v. 52, n. 11, pp. 600-604, Nov. 1969.
579 [12] BELLANDI, N.E., BRITO, M.A., SCHÄNZLE, A., et al., In: 2º Jornada de Refractarios IAS, pp. 85, Argentina, Nov. 2013.