ISSN 0104-6632 Printed in Brazil
www.abeq.org.br/bjche
Vol. 32, No. 02, pp. 609 - 627, April - June, 2015 dx.doi.org/10.1590/0104-6632.20150322s00003417
Brazilian Journal
of Chemical
Engineering
APPLICATION OF A SURFACE-RENEWAL MODEL
TO PERMEATE-FLUX DATA FOR
CONSTANT-PRESSURE CROSS-FLOW MICROFILTRATION
WITH DEAN VORTICES
G. Idan and S. G. Chatterjee
*Department of Paper and Bioprocess Engineering, SUNY College of Environmental Science and Forestry, 1 Forestry Drive, Syracuse, New York 13210, USA.
Phone: +1-315-470-6517, Fax: +1-315-470-6945 E-mail: [email protected]
(Submitted: April 5, 2014 ; Revised: September 22, 2014 ; Accepted: October 14, 2014)
Abstract -The introduction of flow instabilities into a microfiltration process can dramatically change several elements such as the surface-renewal rate, permeate flux, specific cake resistance, and cake buildup on the membrane in a positive way. A recently developed surface-renewal model for constant-pressure, cross-flow microfiltration (Hasan et al., 2013) is applied to the permeate-flux data reported by Mallubhotla and Belfort (1997), one set of which included flow instabilities (Dean vortices) while the other set did not. The surface-renewal model has two forms ─ the complete model and an approximate model. For the complete model, the introduction of vortices leads to a 53% increase in the surface- renewal rate, which increases the limiting (i.e., steady-state) permeate flux by 30%, decreases the specific cake resistance by 14.5% and decreases the limiting cake mass by 15.5% compared to operation without vortices. For the approximate model, a 50% increase in the value of surface renewal rate is shown due to vortices, which increases the limiting permeate flux by 30%, decreases the specific cake resistance by 10.5% and decreases the limiting cake mass by 13.7%. The cake-filtration version of the critical-flux model of microfiltration (Field et al., 1995) is also compared against the experimental permeate-flux data of Mallubhotla and Belfort (1997). Although this model can represent the data, the quality of its fit is inferior compared to that of the surface-renewal model.
Keywords: Critical-flux model; Dean vortices; Microfiltration; Surface-renewal model.
INTRODUCTION
Microfiltration is the physical removal of solid particles from a liquid by means of a membrane in order to concentrate suspensions. It is similar to ul-trafiltration and nanofiltration with the difference being the pore size of the membrane (Cheryan, 1998). This technique is often used to separate cells, proteins and bacteria from a liquid (e.g., fermenta-tion broths) and in wastewater treatment, besides having numerous biotech uses like enzyme recovery
(Kroner et al., 1984; Le et al., 1984; Marston et al., 1984), hormone production (Shoner et al., 1985), pro-tein recovery (Titchener-Hooker et al., 1991), and cell lysate recovery (Bailey and Meagher, 1997a, 1997b). In cross-flow membrane filtration, an incoming feed solution or suspension flows across the surface of a membrane and the permeate flow is that portion of the liquid which passes through the membrane in a direction perpendicular to that of the main flow.
Figure 1, both permeate and retentate (i.e., concen-trate) are returned to the feed vessel, which is a com-mon practice in laboratory studies; thus, the feed concentration remains invariant with process time. The system shown in Figure 2, in which only the retentate is returned to the feed vessel, is used in industry to concentrate a feed suspension (Rudolph and MacDonald, 1994); here the feed concentration changes with process time. The analysis presented in this paper is concerned with the system shown in Figure 1. Depending upon the application, the filtra-tion membrane can be either polymeric or ceramic and contained in a module which comes in different configurations, e.g., tubular, spiral wound and hol-low fiber.
Pump Permeate
Tank containing feed suspension
Cross-flow microfiltration unit
Pressure gauge Pressure
gauge Pressure gauge
Concentrate or retentate
Figure 1: Schematic representation of a laboratory-scale microfiltration unit with both permeate and concentrate returned to the feed tank.
Pump Cross-flow microfiltration unit Pressure gauge
Permeate
Tank containing feed suspension
Pressure gauge
Pressure gauge Concentrate or retentate
Figure 2: Schematic representation of an industrial-scale microfiltration unit with only the concentrate returned to the feed tank (adapted from Rudolph and MacDonald, 1994).
There is a common problem with any filtration process whether it is microfiltration, ultrafiltration, vacuum filtration, or gravity-driven filtration (typical
in student laboratories). This problem is the decline of the permeate flux with process time. The impor-tance of understanding the permeate-flux decline is crucial for industrial processes, laboratory practices or other uses of filtration since it is important to main-tain a high permeate flow rate so that the process can be run in a reasonable amount of time, which trans-lates into the efficiency and cost of the whole opera-tion. The decline of permeate flux looks similar to an exponential-type decay that approaches a zero value for dead-end filtration, but a final nonzero value in the case of cross-flow filtration. According to Gurian (2010), large-scale microfiltration has not been com-petitive cost-wise in the past, but is now being adopted in plants with design flows as large as 20 MGD (million gallons per day). The modeling of CFMF can contribute to the effectiveness and effi-ciency of membrane technologies, including the scale-up of such technologies from the laboratory- or pilot-scale to the industrial scale.
It is commonly held that the primary reasons for permeate-flux decline are two fouling mechanisms known as pore blocking and cake formation. As soon as the CFMF operation is started, some of the parti-cles in the feed suspension become lodged in the pores of the filter, which can be blocked either par-tially or completely. This phenomenon, according to Song (1998), is a rapid process with barely one layer of particles sufficing to complete maximum blocking of the membrane, and is the cause of permeate flux decline during the initial moments of filtration. As time goes on, solid or colloidal particles begin to collide, forming, at first, a few layers on the mem-brane wall — a phenomenon called "gel polariza-tion.” With the further progress of time, these layers build upon one another and form a “cake” on the membrane surface. In this phase, the cake resistance increases as the cake gets thicker and flux decline continues until the cake layer attains an equilibrium thickness, when a steady-state (nonzero) plateau in the permeate flux is established.
In a series of publications, Belfort and co-workers conducted comprehensive theoretical and experimen-tal investigations on the nature of the flow field in curved channels and the effects of the resulting cen-trifugal instabilities, known as Dean vortices, on the performance of nanofiltration, ultrafiltration and mi-crofiltration membrane modules (Chung et al., 1996; Mallubhotla and Belfort, 1997; Chung et al., 1998; Gehlert et al., 1998; Mallubhotla et al., 1998; Luque
particulates away from the membrane wall and dra-matically enhance permeation rates compared to operation without vortices, although at the expense of a larger axial pressure drop. Flux improvements of up to 43% have been reported by Mallubhotla and Belfort (1997) in CFMF of particulate suspensions, while Gehlert et al. (1998) found enhancements of 30−120% for ultrafiltration and microfiltration of relatively low concentrated baker’s yeast suspen-sions and 30-90% for microfiltration of relatively concentrated beer yeast. The flux enhancement was found to increase with feed flow rate and transmem-brane pressure drop, and decrease with increasing feed concentration of suspended matter (Mallubhotla and Belfort, 1997). Although these researchers pre-sented a considerable body of numerical results and experimental data, they did not correlate their data on permeate flux with a coherent theoretical model that could rationally indicate the influence of vari-ables like feed concentration, transmembrane pressure drop, axial velocity, etc. on the behavior of the per-meate flux with process time.
The surface-renewal concept has been used to theo-retically model cross-flow microfiltration and ultra-filtration by a number of workers (Koltuniewicz, 1992; Koltuniewicz and Noworyta, 1994; Koltuniewicz and Noworyta, 1995; Constenla and Lozano, 1996; Arnot
et al., 2000; Chatterjee, 2010; Sarkar et al., 2011; Hasan et al., 2013, Zhang and Chatterjee, 2014). In contrast to the film and boundary-layer models of cross-flow membrane filtration, the surface-renewal model has the potential to more realistically describe the transfer of dissolved/suspended solids due to Dean vortices mentioned above, and also due to random hydrodynamic impulses generated at the membrane-liquid interface, e.g., due to membrane roughness or by the use of spacers or turbulence promoters.
The surface-renewal model of CFMF (Hasan et al., 2013) postulates that the dominant fouling mecha-nism that causes permeate-flux decline is cake for-mation, with pore blocking (if any) occurring only during the initial moments of filtration. The three parameters of the model are: Rm (membrane resis-tance), kc [a parameter that is related to the specific cake resistance α — see Eq. (7)] and S (rate of re-newal of liquid elements at the membrane surface). The values of these parameters were estimated by fitting the model to experimental permeate flow rate data in the CFMF of fermentation broths in labora-tory- and pilot-scale units (Hasan et al., 2013). The parameter S increases with velocity of the main flow (Koltuniewicz, 1992; Koltuniewicz and Noworyta, 1994; Koltuniewicz and Noworyta, 1995), and can be thought of as a “scouring” term that represents the
removal of deposited material from the membrane wall (Arnot et al., 2000), and which depends on the level of flow instability. From dimensional considera-tions, Hasan et al. (2013) proposed a correlation for S
as a function of the diameter of the membrane chan-nel, axial flow velocity, relative roughness of the membrane wall, and viscosity and density of the feed suspension.
The primary objective of this paper is to investi-gate whether the surface-renewal model of Hasan et al. (2013) can quantitatively explain the permeate-flux data of Mallubhotla and Belfort (1997), which were taken without and with Dean vortices, and to draw appropriate conclusions. A secondary objective is to compare the well-known critical-flux model of microfiltration (Field et al., 1995) against the above-mentioned permeate-flux data.
SURFACE-RENEWAL MODEL
In the surface-renewal model of Hasan et al. (2013), it is postulated that the chief fouling mecha-nism causing permeate-flux decline is cake forma-tion. Flow instabilities are assumed to constantly bring fresh liquid elements from the bulk liquid to the membrane-liquid interface. A liquid element remains at the membrane surface for a certain amount of time, after which it departs and re-mixes with the bulk liquid. Above the surface elements, the liquid is assumed to be well mixed and the concen-tration of solids constant due to a high rate of trans-port (because of flow instability) from this location to the bulk liquid. Gradually, a cake layer builds up on the membrane wall, causing a decline in permeate flux with process time until it reaches a steady value. Using the above concept of surface renewal, combin-ing it with classical cake-filtration theory (McCabe
et al., 1993) and using the (unsteady) Danckwerts distribution function (Danckwerts, 1951) to represent the ages of surface elements, Hasan et al. (2013) de-rived explicit expressions for the permeate flux and cake mass as functions of process time for CFMF; the reader is directed to their paper for details.
For later use, we define the following dimen-sionless quantities and also give the definition of the extended Euler gamma function Γ(x, y):
2 0 2
∗=
c
S S
k J (1)
∗ =
p p
( )
( )
0
∗ ∗ = a p a p
J t J t
J (3)
( )
,( )
0 ,∗ ∗ = c a p c c a p
b
m t J k m t
c (4)
(
)
1Γ ,
∞ − −
=
∫
x yx y e d (5)
where 0 Δ = m p J
R (6)
and = Δ b c c α k
p (7)
In the above, S (assumed to be constant) = the rate of renewal of liquid elements at the membrane surface, tp = process time, J0 = permeate flux when
tp = 0 (assumed equal to the pure water flux in this work; this aspect will be discussed later), Δp = trans-membrane pressure drop, µ = viscosity of the filtrate,
Rm = resistance of the membrane or filter medium,
cb = mass of solids deposited in the filter per unit volume of filtrate (approximately equal to the feed concentration), and α = specific cake resistance. Also, Ja(tp) represents the age-averaged permeate flux, while mc,a(tp) is the age-averaged mass of cake accu-mulated per unit area of the membrane surface at process time tp.
In the following, we present the main theoretical results of Hasan et al. (2013), which will be desig-nated as the complete model, and also an approxi-mate model, which can be derived from the complete model.
Complete Model
The dimensionless permeate flux Ja∗
( )
t∗p and cakemass m∗c a,
( )
t∗p are given by the following theoretical expressions (Hasan et al., 2013):( )
erf(
) ( )
erf1 ∗ ∗ ∗ ∗ ∗ ∗ ∗ ∗ − ⎡ ⎤ = ⎢ + − ⎥ ⎣ ⎦ − p S
a p p
t
e
J t πS S t S
e (8) and
( )
(
) (
)
, 1 3 3Γ , Γ , 1
2 2 ∗ ∗ ∗ ∗ − ∗ ∗ ∗ ∗ = ⎛ − ⎞ ⎜ ⎟ ⎝ ⎠ ⎡ − + ⎤− ⎣ ⎦ p S
c a p
t
p
e m t
e S
S S t
(9)
It may be shown that as tp*→ 0:
(
0)
1∗ ∗→ =
a p
J t (10)
and
(
)
, 0 0
∗ ∗→ =
c a p
m t (11)
while as t∗p →∞:
(
)
(
)
( )
0 0 1 erf ∗ ∗ ∗ ∗ → ∞ → ∞ = = = ⎡ ⎤ = ⎢ − ⎥ ⎣ ⎦ a p * lim a p S * limJ t J
J t
J J
J e πS S
(12) and
(
)
(
)
, 0 , , 3Γ 2, 1
∗ ∗ ∗ ∗ ∗ ∗ → = = = −
c lim c
c a p c lim
b
S
m J k
m t m
c e S S ∞ (13)
where Jlim is the value of the limiting or steady-state permeate flux and mc lim, is the steady-state value of the cake mass.
The three parameters of the model can be esti-mated as follows: The membrane resistance Rm can be determined from the value of the initial flux J0
and Eq. (6), while the dimensionless surface-renewal rate S∗ can be calculated from the experimental value of Jlim and Eq. (12). The surface-renewal rate S
can then be obtained by fitting Eq. (8) to experimen-tal, transient permeate-flux data such that the root-mean-square (RMS) deviation between predicted and experimental values of the flux is minimized. Fi-nally, kc and α can be calculated from Eqs. (1) and (7), respectively.
Approximate Model
given by Hasan et al. (2013). This section presents a detailed derivation and discussion of this approxi-mate model.
In some situations, the value of J0 can be high (e.g., a clean membrane), i.e., J0→∞. Equations (8) and (9) then simplify to:
( )
erf(
)
1 −
=
− p
p
a p lim St
St
J t J
e
(14)
and
( )
(
)
, ,
3 2
1 Γ ,
2
1 −
⎡ − ⎜⎛ ⎞⎟ ⎤
⎢ ⎝ ⎠ ⎥
⎣ ⎦
=
− p
p
c a p c lim St
St
π
m t m
e
(15)
where
2 2
Δ
= =
lim
c b
πS πS p
J
k c α (16)
and
,
2 2
Δ
= = b = b
c lim b lim
c
πc p c
π
m c J
Sk S α S (17)
As Hasan et al. (2013) pointed out, Eq. (14) has the same (mathematical) form as the transient perme-ate flux in cross-flow ultrafiltration (Chatterjee, 2010). The value of S can be obtained from the experimen-tal value of Jlim and by fitting Eq. (14) to transient permeate-flux data, after which α can be determined from Eq. (16).
Equation (16) suggests that an increase in the sur-face-renewal rate S (e.g., caused by an increase in the level of flow instability), an increase in the trans-membrane pressure drop Δp or a reduction in feed concentration cb will increase the value of Jlim, which is expected on physical grounds. According to Eq. (17), increases in cb and Δp will increase mc,lim which, however, can be compensated for by an increase in S. At a fixed value of cb, the ratio mc,lim/Jlim is inversely proportional to S; thus, the introduction of vortices, which will increase S, will decrease this ratio.
Equations (16) and (17) also show the crucial im-portance of both the surface-renewal rate S and spe-cific cake resistance α in governing the values of Jlim
and mc lim, . The introduction of flow instabilities like Dean vortices is expected to increase S while de-creasing α (i.e., a looser, less compact cake). In this case, the limiting permeate flux, which is propor-tional to S/α, may increase significantly, while
there will be a smaller influence on the limiting cake mass since the latter is proportional to 1 / (Sα).
As Stp→ 0, i.e., as S → 0 (low flow instability) or as tp → 0 (“initial period of filtration”), it can be shown that Eqs. (14) and (15) reduce to:
(
)
2 20 Δ
→ = =
a p
c p b p
p
J St
k t c αt (18)
and
(
)
,
2 2
2 2
0
3 3
Δ
→ = p= b p
c a p b
c
t c pt
m St c
k α (19)
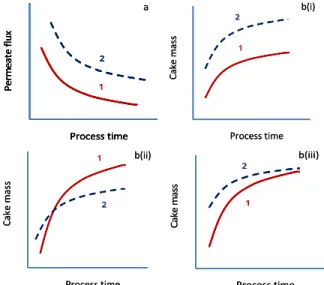
At tp = 0, Eq. (18) shows that the permeate flux becomes unbounded, which is a consequence of as-suming that the initial flux J0→∞ in the derivation of the approximate model. Further, during the initial period of filtration, or for low levels of flow instabil-ity, Eqs. (18) and (19) predict that the permeate flux is inversely proportional to the square root of process time tp while the cake mass grows as the square root of tp starting from a value of zero at tp = 0. Equations (18) and (19) also show that, for Stp→ 0, the perme-ate flux is inversely proportional to the square root of the feed concentration cb, whereas the cake mass is directly proportional to the square root of cb. The absence of the surface-renewal rate S in Eqs. (18) and (19) is a consequence of the Danckwerts age-distribution function that was assumed to represent the ages of surface elements in the derivation of Eqs. (8) and (9) (see Hasan et al., 2013); this distribution approaches a uniform distribution as Stp → 0. As mentioned earlier, the introduction of Dean vortices into the flow field is expected to decrease the spe-cific cake resistance α, with a consequent higher permeate flux [Eq. (18)] compared to the situation when no such vortices are present. This can, there-fore, lead to greater cake deposition on the mem-brane surface [Eq. (19)] because of the higher con-vective flow of solids to it due to the greater perme-ate flux during the initial period of filtration. This theoretical conclusion will be validated by calcula-tions for the dynamic growth of the cake mass to be presented later. It should be noted that for small values of S, the initial period of filtration [when Eqs. (18) and (19) are valid] will be greater compared to the situation when S is large; this is the meaning of the condition Stp→ 0.
Although the purpose of introducing Dean vor-tices into the flow field is to increase permeate flux, the relative magnitudes of the two parameters α and
behavior of the permeate-flux and cake-mass curves as a function of process time, and, in some situations, the introduction of such vortices can be detrimental. This is primarily due to greater cake compaction because of an increased permeate flow due to vor-tices immediately after the start of filtration, i.e., during the “initial moments of filtration.” More pre-cise definitions of the “initial moments of filtration” and “initial period of filtration” are given in the Ap-pendix, which also presents a qualitative analysis of the behavior of the permeate-flux and cake-mass curves as a function of process time.
In cake filtration, the specific cake resistance α is often expressed by the empirical relation (McCabe et al., 1993):
0 = Δ n
α α p (20)
where α0 and n are empirical constants with n being
the compressibility coefficient of the cake, which is zero for incompressible sludges and lies between 0.2 and 0.8 for compressible ones (McCabe et al., 1993). Substituting Eq. (20) into Eqs. (16) and (17) yields:
1 2 0 2
−
= Δ
n
lim
b
πS
J p
c α (21)
and
1 2 ,
0 2
−
= Δ
n b
c lim π
c
m p
S α (22)
The following observations can be drawn from Eqs. (21) and (22): (1) Jlim is directly proportional to S , whereas mc,lim is inversely proportional to it; (2)
Jlim is inversely proportional to cb whereas mc,lim is directly proportional to it; (3) both Jlim and mc,lim are inversely proportional to μ and α0 ; and (4) both
Jlim and mc,lim are directly proportional to 1
2
−
Δ n
p . All of these conclusions are in accord with physical intuition. Although the inverse dependency of mc,lim
on μα0 may at first sight appear counterintuitive, smaller values of the permeate viscosity µ and the compressibility coefficient α0 will result in a higher
permeate flux, which will lead to greater cake deposition by the convective flow of liquid towards the membrane surface.
For a perfectly incompressible cake (n = 0), Eq. (21) predicts a 0.5 power dependence of the limiting
permeate flux Jlim on the transmembrane pressure drop Δp, with the curve of Jlim versus Δp becoming increasingly flatter with increasing n, which is, once again, in accord with physical intuition since for highly compressible cakes, Jlim will be much less sen-sitive to changes in Δp. We note that for a perfectly incompressible cake (i.e., n = 0), the resistance model used by Mallubhotla and Belfort (1997), which does not include the effect of (axial) liquid flow, predicts the limiting flux to be proportional to Δp. Thus, assuming all other factors remain constant, in the case of a perfectly incompressible cake, a doubling of the transmembrane pressure drop will double the limiting permeate flux according to the resistance model, but only increase it by a factor of 1.414 according to the surface-renewal model.
CRITICAL-FLUX MODEL
The general equation of the critical-flux model is given by (Field et al., 1995):
(
)
2
−
− nc = −
crit p
dJ
J k J J
dt (23)
where k is a constant and nc equals 0, 1, 1.5, and 2 for cake filtration, intermediate blocking, standard blocking, and complete blocking mechanisms, re-spectively. Jcrit is the critical flux which is the value of the permeate flux below which a decline of flux with time does not occur, and which depends upon the prevailing hydrodynamics and other factors, whereas J is the process flux at time tp. For compari-son with the previously presented surface-renewal model whose dominant fouling mechanism was as-sumed to be cake accumulation on the membrane surface, which was the most likely cause for permeate-flux decline in the experiments of Mallubhotla and Belfort (1997) (to be discussed later), only the case for nc = 0 (i.e., cake filtration) will be considered here. For nc = 0, Eq. (23) reduces to:
(
)
2 1
− = − crit
p
dJ
k J J dt
J (24)
whose solution, subject to the initial condition that at
tp = 0, J = J0, is (Field et al., 1995):
0 2
0 0
1 ⎡ ⎛ ⎛ − ⎞⎞ ⎛1 1 ⎞⎤
= ⎢ ⎜⎜ ⎜ − ⎟⎟⎟− ⎜ − ⎟⎥
⎢ ⎝ ⎝ ⎠⎠ ⎝ ⎠⎥
⎣ ⎦
crit
p crit
crit crit
J J J
kt ln J
J J J J J
which is an implicit equation for the permeate flux
J as a function of process time tp, in contrast to the explicit form for the surface-renewal model [see Eqs. (8) and (14)]. It can be seen that Eq. (25) contains three parameters: J0, Jcrit and k. J0 can be expressed in terms of Rm and Δp through Eq. (6). According to Eq. (24), dJ/dtp = 0 at J = Jcrit, and, since this is ex-pected to occur as tp → ∞, it has been assumed in this work that Jcrit is equal to the experimental value of the limiting or steady-state flux Jlim (see also Arnot
et al., 2000). The third parameter k can then be ob-tained from the slope of a plot of the right-hand-side of Eq. (25) as a function of tp. It is to be noted that k
and Jcrit can be expressed in terms of the following more fundamental parameters (Field et al., 1995):
0 = cake
m
αK
k
J R (26)
and
= crit
cake
E J
K (27)
Here, Kcake is a cake-filtration constant (a function of certain physical properties) and E is the rate of cake erosion per unit area. Thus, according to Eq. (27) [which is analogous to Eqs. (12) and (16) of the surface-renewal model], an increase in E (say, due to an increase in the liquid velocity or level of flow instability) and a decrease in Kcake will cause an in-crease in Jcrit (i.e., the limiting or steady-state flux). Unfortunately, Field et al. (1995) did not provide a definition for Kcake, which precluded calculating values of the basic quantities α, E, and Kcake from values of
Jcrit and k, which can be obtained from experimental permeate-flux data as discussed earlier. From Eqs. (26) and (27) it follows that:
0
= =
mod crit m
E αE kJ J R (28)
Thus, although α and E cannot be separately de-termined, their product Emod, which is a modified cake erosion parameter, can be calculated.
A BRIEF SUMMARY OF THE EXPERIMENTAL METHODOLOGY OF MALLUBHOTLA AND
BELFORT (1997)
As mentioned earlier, Belfort and co-workers in-vestigated the use of Dean vortices in cross-flow membrane filtration. Such vortices reduce concentra-tion polarizaconcentra-tion and solids buildup at the
membrane-liquid interface, which greatly enhance the flux of permeate compared to operation without vortices. In what follows, both the complete and approximate surface-renewal models presented earlier are corlated against the dynamic permeate-flux data re-ported in Figure 3 of the paper by Mallubhotla and Belfort (1997). These data were obtained from CFMF runs using a polysulfone membrane with a nominal pore size of 0.2 µm and a feed suspension containing polydispersed particles (average nominal diameter dp = 25 µm, density ρp = 1052 kg/m3) that
was made by suspension polymerization of styrene-divinyl-benzene (S/DVB). The particle volume frac-tion φ in the suspension was 0.0015 (base case), which upon multiplying by the particle density ρp
yields a value of 1.578 kg/m3 for the bulk concentra-tion cb of particles in the suspension. These were the only dynamic permeate-flux data that we could find on CFMF with Dean vortices in the publications of Belfort and co-workers that were cited previously. It should be mentioned that such data are necessary for estimating the parameters of the surface-renewal model (i.e., Rm, S and α of the complete model, and S
and αof the approximate model).
We note that the vortex intensity is expressed as a Dean number ratio D, defined as De/Dec where the Dean number De can be interpreted as the ratio of centrifugal to viscous forces (Mallubhotla and Belfort,
1997). Here, , where d is the
half channel height (2d = R2 – R1), u is the mean axial liquid velocity, is the kinematic viscosity of the feed suspension, rc is the centerline radius of the curved channel (see below), while R1 and R2 are the radii of curvature of the inner and outer walls of the curved channel, respectively. Dec is the critical value of the Dean number [equal to 35.71 in the experi-mental system of Mallubhotla and Belfort (1997)] above which the fluid becomes unstable and vortices are produced. Their test cell, which had an active surface area A of 48.4 cm2, consisted of a thin chan-nel with width W, height H and length L of 63.5, 1.6 and 76.2 mm, respectively. There was a 180º U-bend (R1 = 61.9 and R2 = 63.5 mm) through which the feed flowed before it entered the test cell; this arrange-ment generated Dean vortices in the flow field. By reversing the flow direction, they could conduct their CFMF operation in the absence of such vortices. The experiments were performed at a liquid velocity u = 0.57 m/s, transmembrane pressure drop Δp = 69.8 kPa and Dean number ratio D = 4.77 (base case).
Rm calculated from Eq. (6). As discussed by Hasan et al. (2013), in conventional cake-filtration theory, no complete analysis of the buildup of the (initial) tance of the filter cloth is possible since this resis-tance will depend on how the pressure is developed and on the support geometry; it is therefore usual to combine the resistance of the cloth with that of the first few layers of deposited particles, which have a tendency to block the pores of the cloth (Richardson
et al., 2002). The value of Rm will then reflect the combined resistance of the membrane and those particle layers that deposit on it during the initial moments of filtration. In the microfiltration of sugar-maple wood extract, Hasan et al. (2011) observed a significant difference between values of the initial permeate flux J0 and the clean-water flux, which they attributed to a difference in viscosity. Huang and Morrissey (1998) found that J0, which they called the apparent initial permeate flux, depended on the feed concentration — the higher this concen-tration, the lower was the initial flux. According to them, it is difficult to measure the true initial perme-ate flux since it is not possible to stabilize the system pressure instantaneously as the feed is pumped into the filter. According to Koltuniewicz (1992), the first measurement point can be obtained only after some ‘lag’ time that depends upon the measurement tech-nique; he recommended that pure solvent permeabil-ity measurements, after correction for the osmotic pressure effect, be used to calculate J0 in the case of ultrafiltration. This points to uncertainty associated with experimental data of permeate flux near the beginning of filtration. In light of these considera-tions, it is (generally) best to treat Rm as an empirical parameter, which would also include any resistance to flow in the pipes to and from the filter (McCabe et al., 1993). In the modeling of microfiltration, Arnot
et al. (2000) also used J0 as an adjustable parameter in order to minimize experimental errors in the initial flow rate measurement — although they found that in most cases it was not significantly different from the clean-water flux under equivalent operating conditions.
As mentioned earlier, the permeate-flux data of Mallubhotla and Belfort (1997) that will be analyzed in this work were obtained with a feed suspension that consisted of polydisperse particles of S/DVB having an average nominal diameter of 25 µm. Measure-ment of the number and volume size distributions by a Coulter counter revealed that the highest fre-quency of particles occurred between 2 and 10 µm (Mallubhotla and Belfort, 1997). Since these values are much greater than the nominal pore size of 0.2 µm of the polysulfone membrane used in their
experimental work, it can be safely conjectured that there was minimal or negligible pore blocking of the membrane in their microfiltration experiments. We therefore assumed that the value of the initial perme-ate flux J0 in Eq. (6) could be calculated from the pure water flux, which was equal to 221 L/(m2 h). Since Mallubhotla and Belfort, (1997) did not report the experimental temperature, a temperature of 20 ºC was assumed, at which the viscosity of water is esti-mated to be 0.0011 kg/(m s) (Perry et al., 1984). This value, the pure water flux value and the value of the transmembrane pressure drop Δp (= 69.8 kPa) were used in Eq. (6) to estimate the membrane resistance
Rm as 9.6 × 10¹¹ m-1. In the calculations, the viscosity of the filtrate was also assumed to be 0.0011 kg/(m s).
A brief summary of the experimental parameters of Mallubhotla and Belfort (1997) is provided in Table 1 and the reader is referred to their paper for a schematic of the experimental apparatus, detailed discussion of the experimental conditions and proce-dures, and interpretation of the results.
Table 1: Experimental parameters of Mallubhotla and Belfort (1997).a
Parameter Description or value
Membrane type polysulfone with a 0.2 µm pore size Particle type in the feed
suspension
styrene-divinyl-benzene (S/DVB)
Particle average nominal diameter (dp)
25 µm Particle density (ρp) 1052 kg/m3
Particle volume fraction (φ) 0.0015 (base case) Active area of the test cell (A) 48.4 cm2 Height of the test cell (H) 1.6 mm Length of the test cell (L) 76.2 mm Width of the test cell (W) 63.5mm Critical Dean number (Dec) 35.71
Dean number ratio (D = De/Dec) 4.77 (base case)
Transmembrane pressure drop (Δp)
69.8 kPa
Liquid velocity (u) 0.57 m/s Pure water flux 221 L/(m2 h)
a
An experimental temperature of 20 ºC was assumed in the calculations.
RESULTS AND DISCUSSION
Surface-Renewal Model
Complete Model
process time and eventually attains a steady-state value as predicted by theory, (2) the experimental permeate flux with Dean vortices is significantly greater and approaches the limiting or steady-state value faster when compared to that without vortices, and (3) there is a fairly good fit of the model [Eq. (8)] to the experimental data, both in the absence and presence of vortices.
Figure 3: Comparison of the surface-renewal com-plete model [Eq. (8)] and experimental (Figure 3 of Mallubhotla and Belfort, 1997) permeate fluxes in the microfiltration of a S/DVB particulate suspension. Experimental and model parameters are provided in Ta-bles 1 and 2, respectively.SR denotes surface renewal.
With no vortices, the average root-mean-square (RMS) deviation between the theoretical and experi-mental permeate fluxes is 2.6% with the surface-renewal rate S being estimated at 1.5 × 10⁻³ s-1. The specific cake resistance α, which measures the resis-tance offered by the accumulated material on the membrane surface to the flow of permeate, and which depends on the packing density and nature of the cake, is estimated to be 8.42 × 10¹⁴ m kg-1, while the limiting or steady-state cake mass mc lim, , calcu-lated from Eq. (13), is found to be 9.70 × 10⁻³ kg m-2. If this value is multiplied by the value of the active area A of the test cell (Table 1), the total mass of accumulated solids on the membrane is calculated to be 47 mg when the steady-state is reached.
The introduction of flow instabilities due to Dean vortices increased the surface-renewal rate by 53% (S = 2.3 × 10⁻³ s-1), decreased the specific cake resis-tance by 14.5% (α = 7.20 × 10¹⁴ m kg-1), with a con-sequent increase in the limiting permeate flux Jlim by 30% and a decrease in the limiting cake mass by 15.5% (mc lim, = 8.19 × 10⁻³ kg m-2, total accumulation of solids on the membrane surface at steady-state = 39.7 mg). The RMS error of fit between theory and experiment is 4.3%, which is higher than the value of 2.6% obtained for the case when vortices were absent.
Figure 4 exhibits the predicted, age-averaged cake mass mc,a, [calculated from Eq. (9)] as a function of process time tp in the absence and presence of vor-tices. Both curves start at a value of zero and ap-proach the corresponding steady-state values re-ported earlier as the filtration progresses. During the first 10 min, the mass of cake deposited on the mem-brane wall is greater in the presence of vortices com-pared to that in the absence of vortices. Thereafter, the situation is reversed, with the growth of cake in the absence of vortices gradually outpacing that in the presence of vortices. This behavior was theoreti-cally anticipated earlier, although the discussion was presented in the context of the approximate model.
Figure 4: Predicted cake buildup with process time according to the surface-renewal complete model [Eq. (9)] in the microfiltration of a S/DVB particu-late suspension. Experimental and model parameters are provided in Tables 1 and 2, respectively.SR de-notes surface renewal.
Approximate Model
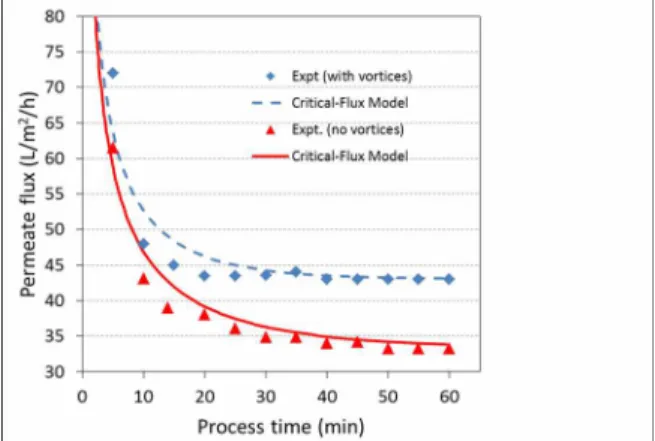
Calculations made with the approximate model show the same qualitative features as the complete model with somewhat different values estimated for the model parameters. Figure 5 shows the fit of the approximate model [Eq. (14)] to the experimental permeate-flux data of Mallubhotla and Belfort (1997) without and with Dean vortices. With no vor-tices, the RMS deviation between the theoretical and experimental permeate fluxes is 2.3%, with the sur-face-renewal rate S estimated at 1.6 × 10⁻³ s-1. The specific cake resistance α is estimated to be 1.10 × 10¹⁵ m kg-1 and the limiting cake mass mc lim, , calcu-lated from Eq. (17), is found to be 9.1 × 10⁻³ kg m-2 (total accumulation of solids on the membrane sur-face at steady-state = 44 mg).
9.87 × 10¹⁴ m kg-1, the limiting permeate flux Jlim in-creased by 30%, and the limiting cake mass mc lim,
decreased by 13.7% to 7.85 × 10⁻³ kg m-2 (total accu-mulation of solids on the membrane surface at steady-state = 38 mg). The RMS error of fit between theory and experiment is 3.9%, compared to 2.3% obtained for the case without vortices.
Figure 5: Comparison of the surface-renewal
ap-proximate model [Eq. (14)] and experimental (Figure 3 of Mallubhotla and Belfort, 1997) permeate fluxes in the microfiltration of a S/DVB particulate suspen-sion. Experimental and model parameters are pro-vided in Tables 1 and 2, respectively.SR denotes sur-face renewal.
Figure 6 shows the dynamic behavior of the theo-retical, age-averaged cake mass mc,a, [calculated from Eq. (15)] as a function of process time in the absence and presence of vortices. This behavior is similar to that observed for the complete model.
Figure 6: Predicted cake buildup with process time according to the surface-renewal approximate model [Eq. (15)] in the microfiltration of a S/DVB particu-late suspension. Experimental and model parameters are provided in Tables 1 and 2, respectively. SR de-notes surface renewal.
Using subscripts 1 and 2 to denote the situations without and with vortices, respectively, Table 2 gives
S2/S1 = 1.5 and α1/α2 = 1.11 for the approximate model.
Since α1/α2 < S2/S1, the behavior of the permeate flux
and cake buildup on the membrane surface as a func-tion of process time shown in Figures 5 and 6 corre-sponds to Figures A1(a) and A1[b(ii)], respectively, in the Appendix.
For the benefit of the reader, the model parame-ters, along with the RMS deviations between theory and experiment, are gathered together in Table 2 for both the complete and approximate models.
Table 2: Parameter values of the surface-renewal model and RMS deviations between theory and experiment (Figures 3 and 5).
Parameter Without vortices With vortices
Complete model
Approx. model
Complete model
Approx. model Rm (m-1) 9.6 × 10¹¹ − 9.6 × 10¹¹ − S (s-1) 1.5 × 10⁻³ 1.6 × 10⁻³ 2.3 × 10⁻³ 2.4 × 10⁻³
α (m kg-1) 8.42 × 10¹⁴ 1.10 × 10¹⁵ 7.20 × 10¹⁴ 9.87 × 10¹⁴ RMS
deviation (%)
2.6 2.3 4.3 3.9
Mallubhotla and Belfort (1997) also reported re-sults on the limiting permeate flux and flux enhance-ment (due to Dean vortices) as a function of trans-membrane pressure drop under different experimen-tal conditions. However, we were unable to use these data to estimate values of the surface-renewal rate S
and compressibility constants of the cake (α0 and n)
because of their steady-state nature and their unavail-ability at low values of the transmembrane pressure drop (i.e., below 36 kPa). In what follows, we pre-sent an approximate analysis that will indicate the relationship between the change in the quantity
0 /
S
ω= α (due to vortices) and the Dean number
ratio D, which, as mentioned earlier, is a measure of vortex intensity.
Using subscripts 1 and 2 to denote the situations without and with vortices, respectively, the limiting flux enhancement FE as a function of transmembrane pressure drop Δp can be obtained from Eq. (21) as:
1 2 1 2
,2 ,1 2 2
,1 1 1
2 02 2 2 2
1 01 1
/ 1 /
/
1 1
/
lim lim
lim
n n n n
J J S α
FE
J S α
S α ω
p p
S α ω
− −
−
= = −
= Δ − = Δ −
(29)
with vortices, respectively. According to Eq. (29), the flux enhancement will be much less sensitive to the transmembrane pressure drop than the individual limiting permeate fluxes [see Eq. (21)]. Figure 6 in the paper of Mallubhotla and Belfort (1997) shows the behavior of FE as a function of Δp (in the range 36−74 kPa) at four different levels of D (obtained by varying the liquid velocity) at a S/DVB particle volume fraction φ = 0.00075 for a 0.2 µm polypro-pylene membrane. Beyond a value of 36 kPa (the lowest Δp at which FE data are available), FE in-creases only weakly with Δp; i.e., the curve of FE
versus Δp flattens out. This implies that n1≈n2, i.e., vortices do not affect the compressibility coefficient of the cake, which reduces Eq. (29) to:
(
)
2 21 1 = +
ω
FE
ω (30)
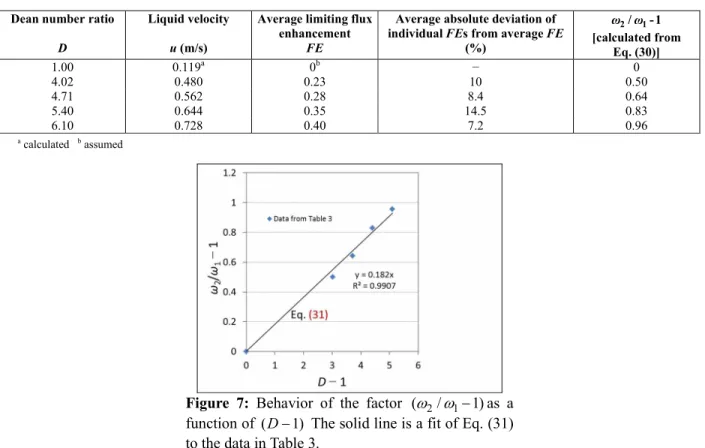
where FE is now to be interpreted as the average flux enhancement over the range of Δp (i.e., 36−74 kPa) at a given value of D. Average values of FE over the Δp range can be estimated from Figure 6 of
Mallubhotla and Belfort (1997) at different values of
D; such estimates are reported in Table 3. The aver-age absolute deviation of the individual FE values from the average FE value at a particular D value is also shown in this table; this will give an idea of the magnitude of the error involved in making the as-sumption that led to Eq. (30). As may be seen, the maximum average deviation is 14.5% at D = 5.4. The factor ω ω2/ 1−1 can be calculated from the average FE value using Eq. (30); values of this factor are shown in Table 3 and plotted as a function of
(
D−1)
in Figure 7. We observe that the data fall fairly well on a straight line and can be expressed as:(
)
2 1
1 1
− = −
ω
K D
ω (31)
where K = 0.182. It should be noted that vortices are only generated when D is larger than 1; thus the line in Figure 7 passes through the origin. Equation (31) clearly shows that the fractional increase in the ratio
0 /
S α because of vortices is directly related to the vortex intensity (represented by D).
Table 3: Average limiting flux enhancement (FE) as a function of the Dean number ratio (D). Data are
derived from Figure 6 of Mallubhotla and Belfort (1997) for a S/DVB particle volume fraction φ = 0.00075
and a 0.2 µm polypropylene membrane over a transmembrane pressure drop (Δp) range of 36−74 kPa.
Other experimental parameters are shown in Table 1.
Dean number ratio
D
Liquid velocity
u (m/s)
Average limiting flux enhancement
FE
Average absolute deviation of individual FEs from average FE
(%)
2/ 1- 1 ω ω
[calculated from Eq. (30)]
1.00 0.119a 0b − 0
4.02 0.480 0.23 10 0.50
4.71 0.562 0.28 8.4 0.64
5.40 0.644 0.35 14.5 0.83
6.10 0.728 0.40 7.2 0.96
a
calculated b
assumed
Mallubhotla and Belfort (1997) also studied the effect of particle concentration on the steady-state or limiting flux enhancement FE. For example, the data presented in Table 4, which were extracted from Figure 8 of their paper, show that FE increases as the particle volume fraction φ is raised from a value of zero, reaches a maximum of 27% at φ = 0.0015, and then again drops to zero at φ = 0.002. We note the 3% discrepancy between the FE value of 27% at φ = 0.0015 given in Table 4 and the value of 30% (at the same value of φ) that was mentioned previously in the discussion of Figures 3 and 5. The likely cause for this discrepancy is human subjectivity in extract-ing the data for the limitextract-ing flux (Figure 3 or Figure 5) from Figure 3 in the paper of Mallubhotla and Belfort (1997). These authors attributed the flux loss to com-pression of the deposited cake and increased viscos-ity and particle-particle interactions near the mem-brane surface as φ is increased. This, however, does not explain the increase in FE as φ varies from zero to 0.0015. We now offer a hypothesis for the experi-mentally observed initial increase and subsequent decrease of FE as φ as raised (Table 4). As φ is in-creased, the nature of the cake will change, i.e., the specific cake resistance is expected to increase, both in the absence and presence of vortices. Although the effect of particle concentration cb (=φ ρp) does not
explicitly appear in Eq. (29), it is indirectly mani-fested through the magnitudes of the specific cake resistances α1 and α2, with the latter also depending
on the strength of the vortex intensity (reflected by the value of S2). At a fixed value of the Dean number ratio D, the value of S2/S1 (> 1) would be fixed (assuming that the surface-renewal rate is independ-ent of particle concindepend-entration since it is a hydrodynamic parameter). As φ→ 0 (i.e., cb→ 0 or kc→ 0), it can be shown from Eqs. (6) and (12) in the paper of Hasan et al. (2013) that the permeate flux becomes independent of time and the surface-renewal rate (i.e., becomes equal to the initial flux J0). From this it follows that FE→ 0, which also implies that cake buildup with and without vortices would be the same, and would approach zero as shown by Eqs. (8) and (22) in the paper of Hasan et al. (2013). Table 4 also reports numerical values of the ratio α1/α2 as a
function of FE calculated from Eq. (29) by using a value of S2/S1 = 1.5, which was obtained from Table 2 (approximate model). As φ increases from a value of zero, α1/α2 reaches a maximum value of 1.08 at
φ = 0.0015 (FE = 0.27) and then drops to 0.67 at φ = 0.002 (FE = 0). The increase in FE implies that,
al-though both α1 and α2 increase with φ, α1 increases at a greater rate than α2; in this region, FE increases with φ. But this increase occurs only up to a certain value of φ, beyond which the trend is reversed, and, as φ is increased further, α2 increases at a greater rate than α1. In this region, FE decreases as φ increases, i.e., vortices become less and less effective, with FE
becoming zero when a threshold value of φ is
crossed (0.002 in Table 4). On the ascending side of the FE versus φ plot [Figure 8 in the paper of Mallubhotla and Belfort, 1997], α α1/ 2≈1 at φ = 0.0005 where FE = 0.22 (Table 4), whereas on the descending side, these same values of α1/α2 and FE
occur at approximately φ = 0.00165. Thus, within the range of 0.0005 < φ < 0.00165, α1/α2 > 1 and vortices
are especially effective. Outside this range, α1/α2 < 1,
i.e., vortices increase the specific cake resistance. We attribute this behavior to greater cake compaction (causing a reduction in cake porosity) due to a height-ened permeate flux in the presence of vortices imme-diately after the beginning of filtration, with the compaction effect being much more severe at higher values of φ. Thus, in the ascending part of the FE
versus φ plot, a change in φ of 0.0015 leads to an increase of 27% in FE, whereas in the descending part of the plot, a change in φ of only 0.0005 leads to the same amount of decrease in FE. It can be ob-served from Eq. (29) that another critical factor gov-erning the behavior of FE is S2/S1. Since this factor will be greater than 1 when vortices are introduced into the flow field, there will be some flux enhance-ment even when α1 < α2, with the enhancement being
especially significant when α1 > α2, which will occur
in a specific particle volume fraction range [0.0005 < φ < 0.00165 in the experiments of Mallubhotla and Belfort, 1997]. Thus, there is a range of φ within which the use of vortices is advantageous and outside of which the need for them disappears (Mallubhotla and Belfort, 1997). Table 4 also lists the number of the figure in the Appendix that corresponds to each indi-vidual case.
It was assumed in the preceding discussion that the specific cake resistance α is a function of the feed concentration cb. For a cake consisting of rigid indi-vidual particles, this is not expected to be true and, in such a case, both α1 and α2 (and thus their ratio) will
be independent of the feed concentration. Also, in this case, α1/α2 > 0 (no cake compaction) and thus FE
Case 1 in the Appendix. However, for a compressible cake formed from a flocculated suspension, the resis-tance of the cake will be governed by floc properties, the method used in preparing the feed suspension and age and temperature of the material constituting it, floc distortion and breakage due to forces within the cake, and variation of cake properties within the cake layer (McCabe et al., 1993). Also, due to con-solidation and creep effects, the local (and average) value of α can vary with process time and the intro-duction of fluid shear (e.g., vortices) will restrict the suspension of flocs with different material properties compared to those in the absence of shear (Kovalsky
et al., 2009). These effects will be different for sus-pensions of differing feed concentrations, which will be manifested as a dependence of α on cb. It becomes evident that the surface-renewal model used in this work, which tacitly assumes that, during the initial moments of filtration, a complete cake layer is formed on the membrane surface, whose resistance (repre-sented by α) thereafter does not change with time, is a highly idealized picture of a very complex process. This is a usual feature of a scientific model, which is an interpretative and partial description of a phe-nomenon and which facilitates access (perceptual and intellectual) to that phenomenon (Bailer-Jones, 2009).
Table 4: Limiting flux enhancement (FE) as a func-tion of particle volume fracfunc-tion (φ) with a S/DVB particulate suspension at a Dean number ratio (D) = 4.77 and transmembrane pressure drop (Δp) = 69.8 kPa for a 0.2 µm polysulphone membrane. Liquid velocity (u) = 0.57 m/s and critical Dean num-ber (Dec) = 35.71. Data were derived from Figure 8 of Mallubhotla and Belfort (1997).
Particle volume fraction
φ
Limiting flux enhancement
FE
α1/α2 [calculated
from Eq. (29)]
Figure No.
0.0 0 - -
0.0005 0.22 0.99 ≈ 1 A2 [a and b] 0.0015 0.27 1.08 A1 [a and b(ii)] 0.0020 0 0.67 A3 [a and b(iii)]
0.0025 0 - -
The average values of S calculated from Table 2 are 1.55 × 10⁻³ s-1 (without vortices) and 2.35 × 10⁻³ s-1 (with vortices), which is an increase of 52%. These values of S are comparable to those reported previ-ously for cross-flow ultrafiltration and microfiltration (Koltuniewicz and Noworyta, 1994; Chatterjee, 2010;
Hasan et al., 2013). Hutchinson and Sherwood
(1937) studied the absorption of eight different pure gases at 25 ºC in a stirred flask containing water with the gas exposed above the stirred surface. Table 5 shows values of the mass-transfer coefficient kL, which they calculated from dissolved-gas concentra-tion measurements, for hydrogen and oxygen at two different stirrer speeds. Using the theoretical equa-tion kL= D Si (Danckwerts, 1970) where Di is the diffusion coefficient of the dissolved gas in the liquid, we calculated values of S that are also reported in Table 5, along with values of Di that were estimated from values of the diffusion coefficient of the dis-solved gas (in water) at 20 ºC given in Table 3 in the paper of Hutchinson and Sherwood (1937) and using the Wilke-Chang correlation (Perry et al., 1984) to correct them to 25 ºC. As the stirrer speed changes from 171 RPM (revolutions per minute) to 1025 RPM,
S varies from 1.86 × 10⁻² s-1 to 1.76 × 10⁻¹ s-1 for hydrogen and 3.28 × 10⁻² s-1 to 2.13 × 10⁻¹ s-1 for oxygen. Since Sis a hydrodynamic parameter, which should be independent of Di, it can be speculated that the difference in the values of S between hydrogen and oxygen at a given RPM arises from uncertainty in the value of Di. The average values of S at 171 and
1025 RPM are 2.57 × 10⁻² s-1 and 1.94 × 10⁻¹ s-1, respectively, which indicates an increase of 659% for a change in RPM of 500%, and which also indicates that S varies with the RPM raised to a power of 1.13. The values of S derived from the absorption data of Hutchinson and Sherwood (1937) are about one to two orders of magnitude greater than those for cross-flow microfiltration, as found in this work. It can be conjectured that high values of S can be obtained in a rotating-disk membrane module such as the one used by Sarkar et al. (2011), which will dramatically en-hance the permeate flux.
operat-ing in the turbulent flow regime, the flux increases in proportion to the tangential flow rate. It should also be noted that, in the case of ultrafiltration, according to Cheryan (1986), the permeate flux is proportional to u0.3 tou0.6 for laminar-flow units and u0.8 tou1.2 for turbulent-flow systems.
Table 5: Values of the surface-renewal rate (S) calculated from the absorption data of pure gases at 25 ºC in a stirred flask containing water with the gas exposed above the stirred surface. Values of the mass-transfer coefficient (kL) and diffusion
coefficient (Di) were derived from the paper of
Hutchinson and Sherwood (1937).
Type of gas RPM
Hydrogen 171 1025
kL(m s-1) 1.06 × 10⁻⁵ 3.25 × 10⁻⁵ Di (m2 s-1) 6.00 × 10⁻⁹ 6.00 × 10⁻⁹ S (s-1) [= 2/ ]
L i
k D 1.86 × 10⁻² 1.76 × 10⁻¹
Oxygen 171 1025
kL(m s-1) 8.33 × 10⁻⁶ 2.12 × 10⁻⁵ Di (m2 s-1) 2.12 × 10⁻⁹ 2.12 × 10⁻⁹ S (s-1) [= 2/ ]
L i
k D 3.28 × 10⁻² 2.13 × 10⁻¹
Critical-Flux Model
Finally, the results for the critical-flux model are displayed in Figure 8 (permeate flux) with the model parameters shown in Table 6. With no vortices, the average RMS error between the critical-flux and experimental permeate fluxes is 4.5% [compared to 2.6 and 2.3% for the complete and approximate sur-face-renewal models, respectively], while with vor-tices the error increases to 5.1% [compared to 4.3 and 3.9% for the complete and approximate surface-renewal models, respectively].
Figure 8: Comparison of the critical-flux model [Eq. (25)] and experimental (Figure 3 of Mallubhotla and Belfort, 1997) permeate fluxes in the microfiltration of a S/DVB particulate suspension. Experimental and model parameters are provided in Tables 1 and 6, respectively.
As can be seen by comparing Figure 8 with Figures 3 or 5, the quality of the fit of the critical-flux model to the experimental permeate-critical-flux data is not as good as that of the surface-renewal model. Vortices cause an almost 30% increase in the modified cake erosion parameter Emod (Table 6).
Table 6: Parameter values of the critical-flux model and RMS deviations between theory and experi-ment (Figure 8).
Parameter Without vortices With vortices
Rm (m-1) 9.6 × 10¹¹ 9.6 × 10¹¹ Jcrit (m s-1) 9.222 × 10⁻⁶ 1.194 × 10⁻⁵ Emod (m s-3) 5.43 × 10⁹ 7.04 × 10⁹
RMS deviation (%) 4.5 5.1
CONCLUSIONS
RMS errors were 2.6 (no vortices) and 4.3% (with vortices), while those for the approximate model were 2.3 and 3.9%, respectively. One can speculate that, if more data were available at small values of the process time (see Figures 3 or 5), when the flux drops drastically, the complete model would have smaller errors than the approximate model.
The cake-filtration (n = 0) version of the well-known critical-flux model of microfiltration (Field et al., 1995) was also compared against the experimen-tal permeate-flux data of Mallubhotla and Belfort (1997). Although this model can represent these data, the quality of its fit is inferior compared to that of the surface-renewal model.
Dean vortices, by increasing flow instability, which is manifested in an increased rate of renewal of liquid elements at the membrane surface, can cause a looser, less compact cake, and a smaller buildup of cake on the membrane wall when com-pared to the situation when such vortices are absent. This allows for a heightened permeate flux with a quicker approach to steady-state, which is of para-mount importance in CFMF. However, as discussed earlier, this effect is only manifested within a certain range of feed concentrations. The approximate two-parameter surface-renewal model mirrors its three-parameter counterpart and should be adequate for representing experimental permeate-flux data provided one starts the experiment with a clean membrane.
Overall, the surface-renewal model for CFMF was shown to be sensitive, consistent and precise since the RMS deviations of the model from experi-ment, as observed in this study, would most likely fall within the magnitude of the experimental error. The essence of the surface-renewal model is its abil-ity to explicitly account for flow instabilities gener-ated at the membrane surface (e.g., due to membrane roughness, presence of spacers, or vortices) through the hydrodynamic parameter S, in contrast to the other models of membrane filtration (e.g., the film, boundary-layer or resistance models). For future work, we suggest that the model be tested further by means of a rigorous experimental protocol for its ability to predict the influences of variables like transmembrane pressure drop, feed concentration and axial liquid velocity on the transient flux of permeate.
ACKNOWLEDGEMENT
S. G. C. thanks Mr. Susumu Ikuta and Dr. Noshir Mistry for thought-provoking discussions on cross-flow microfiltration, which has had a significant in-fluence on this work.
NOMENCLATURE
A filtration area (cm2)
cb mass of solids deposited in the filter per unit volume of filtrate (approximately equal to the concentration of solids in the feed or bulk liquid) (kg m-3)
d half channel height [= (R2 – R1)/2] (mm)
dp average nominal diameter of particles in the feed suspension (µm)
D Dean number ratio (= De/Dec)
Di Diffusion coefficient of the dissolved gas in the liquid (m2 s-1)
De Dean number
Dec Critical Dean number
E rate of cake erosion per unit area
(kg m-2 s-1)
Emod modified cake erosion parameter; defined by Eq. (28) (m s-3)
FE Limiting or steady-state flux enhancement
due to vortices; defined by Eq. (29)
H height of test cell (mm)
J(tp) permeate flux at process time tp in the critical-flux model (m s-1)
Ja(tp) age-averaged permeate flux when the
process time is tp (m s-1) ( )
∗ ∗
a p
J t dimensionless age-averaged permeate flux when the dimensionless process time is t∗p; defined by Eq. (3)
Jcrit critical permeate flux (m s-1)
Jinit permeate flux as tp→ 0 (m s-1)
Jinit,1 permeate flux as tp→ 0 when no vortices are present (m s-1)
Jinit,2 permeate flux as tp→ 0 when vortices are present (m s-1)
Jlim limiting or steady-state permeate flux (m s-1)
Jlim,1 limiting permeate flux when no vortices are present (m s-1)
Jlim,2 limiting permeate flux when vortices are present (m s-1)
lim
J∗ dimensionless limiting or steady-state
permeate flux; Jlim/J0
J0 initial permeate flux (i.e., at tp = 0) (m s-1)
k parameter in critical-flux model [s m-2 (nc = 0), m-1 (nc = 1), s-1 (nc = 2)]
K constant in Eq. (31)
kc defined by Eq. (7) (s m-2)
Kcake cake-filtration constant in the critical-flux model (kg m-3)
kL mass-transfer coefficient (m s-1)
( )
, c a p
m t age-averaged cake mass per unit area of
membrane surface at process time tp (kg m-2)
( )
,
∗ ∗
c a p
m t dimensionless age-averaged cake mass
when the dimensionless process time is
∗
p
t ; defined by Eq. (4)
mc,init mass of cake on the membrane surface as
tp→ 0 (kg m-2)
mc,init,1 mass of cake on the membrane surface as
tp→ 0 when no vortices are present (kg m-2)
mc,init,2 mass of cake on the membrane surface as
tp→ 0 when vortices are present (kg m-2) ,
c lim
m limiting or steady-state cake mass (kg m-2
) , ,1
c lim
m limiting or steady-state cake mass when no vortices are present (kg m-2)
, ,2 c lim
m limiting or steady-state cake mass when vortices are present (kg m-2)
,
∗
c lim
m limiting or steady-state dimensionless cake mass (= mc,limJ0kc/cb)
n compressibility coefficient of the cake
nc index in the critical-flux model; equals 0, 1, 1.5 or 2 depending upon the fouling mechanism
n1 compressibility coefficient of the cake when no vortices are present
n2 compressibility coefficient of the cake when vortices are present
rc centerline radius of the curved channel (mm)
Rm hydraulic resistance of the membrane (m-1)
R1 radius of curvature of the inner wall of the curved channel (mm)
R2 radius of curvature of the outer wall of the curved channel (mm)
S rate of renewal of liquid elements at the membrane surface (s-1)
S1 surface-renewal rate when no vortices are present (s-1)
S2 surface-renewal rate when vortices are present (s-1)
S* dimensionless surface-renewal rate; defined by Eq. (1)
tp process time (s)
∗
p
t dimensionless process time; defined by Eq. (2)
u mean axial liquid or feed velocity (m/s or mm/s)
W width of test cell (mm)
x parameter of Γ(x, y)
y parameter of Γ(x, y)
Greek Symbols
α specific cake resistance (m kg-1)
α1 specific cake resistance when no vortices
are present (m kg-1)
α2 specific cake resistance when vortices are
present (m kg-1)
α0 constant in Eq. (20) (m kg-1)
α01 value of α0 when no vortices are present
(m kg-1)
α02 value of α0 when vortices are present
(m kg-1)
Γ(x, y) extended Euler gamma function; defined by Eq. (5)
arbitrarily small value of the process time (s)
Δp transmembrane pressure drop (Pa or kPa) arbitrarily small value of the process time (s)
variable of integration in Eq. (5) viscosity of the permeate (kg m-1 s-1)
ρp density of particles in the feed suspension
(kg/m3)
kinematic viscosity of the feed suspension (mm2/s)
φ volume fraction of particles in the feed suspension
ω S/α0 (kg m
-1
s-1)
ω1 S1/α01 (kg m-1 s-1)
ω2 S2/α02 (kg m-1 s-1)
REFERENCES
Arnot, T. C., Field, R. W. and Koltuniewicz, A. B., Cross-flow and dead-end microfiltration of oily-water emulsions. Part II: Mechanisms and model-ing of flux decline. J. Membrane Sci., 169, 1-15 (2000).
Bailey, S. M. and Meagher, M. M., The effect of denaturants on the crossflow membrane filtration of Escherichia coli lysates containing inclusion bodies. J. Membrane Sci., 131, 29-38 (1997). Bailey, S. M. and Meagher, M. M., Crossflow
micro-filtration of recombinant Escherichia coli lysates after high pressure homogenization. Biotechnol. Bioeng., 56, 304-310 (1997).
Bailer-Jones, D. M., Scientific Models in Philosophy of Science. University of Pittsburgh Press, Pitts-burgh, Pennsylvania (2009).


![Figure 3: Comparison of the surface-renewal com- com-plete model [Eq. (8)] and experimental (Figure 3 of Mallubhotla and Belfort, 1997) permeate fluxes in the microfiltration of a S/DVB particulate suspension](https://thumb-eu.123doks.com/thumbv2/123dok_br/18896693.426563/9.918.107.443.269.457/comparison-experimental-mallubhotla-belfort-permeate-microfiltration-particulate-suspension.webp)
![Figure 5: Comparison of the surface-renewal ap- ap-proximate model [Eq. (14)] and experimental (Figure 3 of Mallubhotla and Belfort, 1997) permeate fluxes in the microfiltration of a S/DVB particulate suspen-sion](https://thumb-eu.123doks.com/thumbv2/123dok_br/18896693.426563/10.918.107.442.251.482/comparison-proximate-experimental-mallubhotla-belfort-permeate-microfiltration-particulate.webp)