Relation between uric acid and metabolic syndrome
in subjects with cardiometabolic risk
Relação entre ácido úrico e síndrome metabólica em uma população
com risco cardiometabólico
Hellen Abreu da Silva1, Júlia Cristina Cardoso Carraro1, Josefina Bressan1, Helen Hermana Miranda Hermsdorff1
ABSTRACT
Objective: To identify possible relations between serum uric acid
levels and metabolic syndrome and its components in a population with cardiometabolic risk. Methods: This cross-sectional study included 80 subjects (46 women), with mean age of 48±16 years, seen at the Cardiovascular Health Program. Results: The prevalence of hyperuricemia and metabolic syndrome was 6.3% and 47.1%, respectively. Uric acid level was significantly higher in individuals with metabolic syndrome (5.1±1.6mg/dL), as compared to those with no syndrome or with pre-syndrome (3.9±1.2 and 4.1±1.3mg/dL, respectively; p<0.05). The uric acid levels were significantly higher in men presenting abdominal obesity, and among women with abdominal obesity, lower HDL-c levels and higher blood pressure (p<0.05).
Conclusion: Uric acid concentrations were positively related to the
occurrence of metabolic syndrome and its components, and there were differences between genders. Our results indicate serum uric acid as a potential biomarker for patients with cardiometabolic risk.
Keywords: Uric acid; Obesity, abdominal; Metabolic diseases;
Cardiovascular diseases/metabolism; Risk groups
RESUMO
Objetivo: Identificar as possíveis relações da concentração sérica de
ácido úrico com a síndrome metabólica e seus componentes em uma população com risco cardiometabólico. Métodos: Estudo transversal que incluiu 80 indivíduos (46 mulheres), com média de idade de 48±16 anos, atendidos pelo Programa de Atenção à Saúde Cardiovascular.
Resultados: As prevalências de hiperuricemia e de síndrome metabólica
foram 6,3% e 47,1%, respectivamente. A concentração de ácido úrico foi significantemente maior entre os sujeitos com síndrome metabólica (5,1±1,6mg/dL), comparada a daqueles sem a síndrome ou com
pré-síndrome (3,9±1,2 e 4,1±1,3mg/dL, respectivamente; p<0,05). A concentração de ácido úrico foi maior entre homens com obesidade abdominal, e entre mulheres com obesidade abdominal, menores concentrações de HDL-c e maior pressão arterial (p<0,05). Conclusão:
As concentrações de ácido úrico foram positivamente relacionadas com a ocorrência de síndrome metabólica, bem como de seus componentes, para os quais foram observadas diferenças entre os sexos. Nossos resultados indicam a importância do ácido úrico como biomarcador em pacientes com risco cardiometabólico.
Descritores: Ácido úrico; Obesidade abdominal; Doenças metabólicas;
Doenças cardiovasculares/metabolismo; Grupos de risco
INTRODUCTION
Cardiovascular diseases (CVD) are among the main causes of morbidity and mortality in the world.(1) In
Brazil, CVD are one of the most prevalent causes of death, accounting for 29.4% of all recorded deaths in a one-year period. The condition affects mainly men.(2)
Several risk factors are associated with the development of CVD, including obesity, dyslipidemia, hypertension, diabetes mellitus and some lifestyle-related conditions, such as smoking, sedentary lifestyle, and atherogenic eating habits.(3)
The metabolic syndrome (MS) represents a group of predisposing factors: abdominal obesity or central adiposity, dyslipidemia (hypertriglyceridemia and/or reduced high-density lipoprotein cholesterol − HDL-c), hyperglycemia or diabetes, and arterial hypertension
1 Universidade Federal de Viçosa, Viçosa, MG, Brazil.
Corresponding author: Helen Hermana Miranda Hermsdorff – Department of Nutrition and Health – Universidade Federal de Viçosa – Campus Viçosa – Avenida Peter Henry Rolfs s/n – Zip code: 36570-900 – Viçosa, MG, Brazil – Phone: (31) 3899-1269 – E-mail: [email protected]
Received on: June 5, 2014 – Accepted on: Jan 8, 2015 Conflicts of interest: none.
or pre-hypertension. MS correlates directly with the development of CVD and diabetes.(4) A systematic
review based on 10 cross-sectional studies estimated the mean prevalence of MS in Brazil as 29.6%, ranging between 14.9 and 65.3% according to the study population.(5)
In this context, attempts to establish diagnostic criteria for MS are based on the principle that these components may act in a synergistic or additive manner, augmenting the cardiometabolic risk.(6) Krishnan and
Sokolove(7) proposed that uric acid (UA) level could
be used as a marker for cardiovascular risk. However, a rational physiological base is needed to explain the relation between UA and cardiovascular risk and the development of appropriate therapies to treat changes in UA levels, since these potential associations still remain unproven.(8)
Including UA as a variable to stratify cardiovascular risk may be interesting, because it is low-cost, easily-performed test, which is useful in clinical practice, especially for MS patients.(8) However, few studies
have investigated the predictive role of UA levels,(6,8-10)
and studies that investigate the relation between UA and MS criteria in patients previously detected with cardiovascular risk are still scarce.
OBJECTIVE
To identify the potential relationship between serum concentrations of uric acid and metabolic syndrome and its components in a population at cardiometabolic risk.
METHODS
This is an observational, cross-sectional study using data from subjects followed up at the Cardiovascular Health Program from the Universidade Federal de
Viçosa (PROCARDIO-UFV, acronym in Portuguese),
from November 2012 to June 2013. Sample calculations were performed using the OpenEpi software,(11) taking
into account the total number of PROCARDIO users in 2012 (n=91), a confidence interval of 95%, an expected prevalence rate of 29.8% for MS,(12) and
a sampling error of 5%, which resulted in a minimum sample of 72 people. The inclusion criteria were the same as defined by PROCARDIO; subjects should be aged 20 years or more, be members of the staff/their dependents or students at the Universidade Federal de
Viçosa (UFV), and show one or more of the following
criteria: overweight or obesity, hypertriglyceridemia (≥150mg/dL); hypercholesterolemia (≥200mg/dL), low HDL-cholesterol (men <40mg/dL and women
<50mg/dL), high LDL (≥130mg/dL), blood pressure (≥130/85mmHg) or diagnosed hypertension, fasting glucose (≥110mg/dL), diabetes mellitus diagnosed and/ or medical referral related to some of the previously described metabolic changes.
This study was approved by the Human Research Ethics Committee of UFV (Of. Ref. nº 066/2012/CEPH), in June 27, 2012, in agreement with the principles of the Declaration of Helsinki; therefore, subjects who agreed to participate in the study signed the Informed Consent Form.
Anthropometrics and body composition
Body weight was measured on an electronic digital scale (Toledo 2098PP, São Bernardo do Campo, Brazil) with maximum capacity of 200kg and 50g precision. Height was determined using a stadiometer (Stanley,cmS, England), with maximum extension of 2m and precision of 0.5mm. Body mass index (BMI) was calculated and used to classify overweight and obesity, in agreement with the World Health Organization recommendations.(13)
Waist circumference (WC) was measured at the umbilical scar. Abdominal obesity was classified based on WC values >102 and 88cm for men and women, respectively.(14) To determine the percentage of total
body fat, a bioelectric impedance equipment was used (Biodynamics 310 model, Washington, US).
Blood pressure and serum metabolic markers
Systolic and diastolic arterial blood pressure were measured with a mechanical mercury sphygmomanometer (BIC, São Paulo, Brazil), with approximations of 2mmHg, according to the technique described at the Sixth Brazilian Guidelines for Hypertension.(15)
Biochemical analysis of fasting glucose, tryglycerides, total cholesterol and fractions, and UA were performed at the Clinical Analysis Laboratory of the Health Department - UFV, in agreement with their standardized protocols. Hyperuricemia was defined as >6 and 7mg/dL of UA for women and men, respectively.(16)
Definition of metabolic and pre-metabolic syndrome
MS was diagnosed according to the guidelines of the National Cholesterol Education Program Expert Panel on Detection, Evaluation, and Treatment of High Blood Cholesterol in Adults (Adult Treatment Panel III − ATP III),(4) in the presence of three or more offor women), hypertriglyceridemia (≥150mg/dL), low HDL-c (<40mg/dL for men and <50mg/dL for women), pre-hypertension or hypertension (≥130mmHg ou ≥85mmHg) and fasting glucose (≥110mg/dL and/or diagnosed diabetes mellitus). Pre-MS was defined as the presence of two of these criteria.(17)
Other study variables
Sociodemographic variables (sex, age, and relation with UFV) and lifestyle variables (smoking and physical activity) were assessed with a specific questionnaire from PROCARDIO-UFV.
Former smokers were classified in the same group as smokers, separately from those who never smoked. Concerning physical activities, participants were classified as active if they had performed physical activities of moderate intensity for at least three months, and at least three times a week (~150 minutes/week). Others were classified as sedentary.
Statistical analysis
Data were given as mean±standard deviation (SD) or median (interquartile range) according to the normality of variables, which was tested with the Shapiro-Wilk test. The study sample was divided into two groups: low UA and high UA, defined by the median of each sex: 4.8mg/dL for men and 3.4mg/dL for women. Medians have been previously used as cutoff points;(18) this is
based on the validated method of distributing the population into risk groups in epidemiologic studies.(19)
To compare means between two groups, Student’s t
test or Mann-Whitney test were used according to the data distribution, and χ2 test to compare frequencies.
To compare means between three groups, ANOVA variance test was used, followed by Tukey post hoc
test. Variables that did not show normal distribution were previously transformed in log to apply ANOVA. Multivariate linear regression analyses were performed to assess the effect of UA concentrations on the prediction of the number of MS components, adjusting for confounding variables.
Statistical analyses were performed on the Statistical Package for the Social Sciences (SPSS) for Windows, version 17.0. Significance level was 5% for all hypotheses tested.
RESULTS
The study sample was composed by 80 subjects, predominantly female (n=46; 57.5%). Mean age was
48±16 years, and prevalence of hyperuricemia was 6.3% (n=5). Prevalences of 47.1% (n=33) of MS and 32.9% (n=23) of pre-MS were observed in the sample.
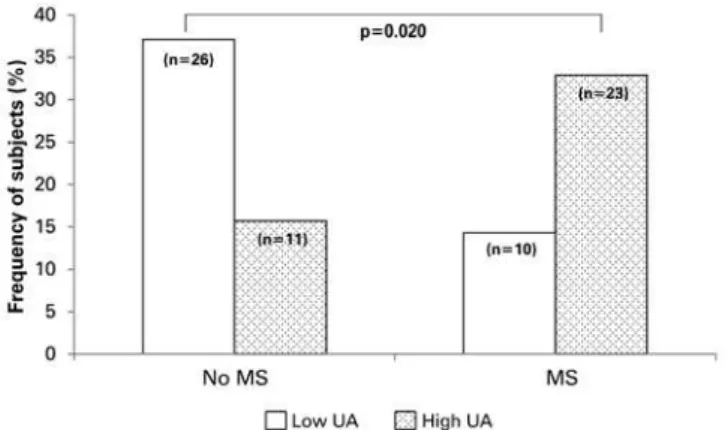
Interestingly, subjects with no MS or with pre-MS showed significantly lower UA levels as compared to those with MS (Figure 1). The frequency of subjects with high UA levels (≥4.8mg/dL for men and ≥3.4mg/ dL for women) was higher for those with MS (Figure 2).
Figure 1. Uric acid (UA) levels according to absence of metabolic syndrome (MS) (n=14) or presence of pre-MS (n=23) and MS (n=33). p values from ANOVA, followed by Tukey HSD post hoc test (p<0.001)
Figure 2. Frequency (%) of subjects with low or high UA, according to absence or presence of MS. p value <0.05 for χ2 test. Low UA <4.8mg/dL for men and
<3.4mg/dL for women. High UA ≥4.8mg/dL for men and ≥3.4mg/dL
for women
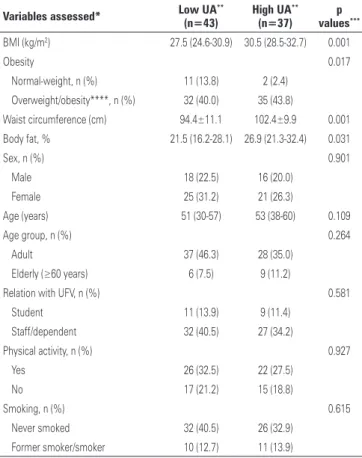
Subjects with high UA also showed higher BMI, WC, and total body fat, with no difference in sex, age, physical activity levels, and smoking status (Table 1).
Approximately 84% of subjects (n=67) were constant users of medication; 20% (n=16) were on glucose-lowering agents (oral or insulin), 46% (n=37) on antihypertensive drugs, and 58% (n=46) on lipid-lowering drugs (to reduce cholesterol and/or tryglycerides). However, there was no difference in UA levels between subjects using medication or not (oral antidiabetic drugs, p=0.594; insulin, p=0.693; antihypertensive drugs, p=0.910; cholesterol-reducing drugs, p=0.303; and fibrates, p=0.08).
Finally, multiple linear regression analysis showed that UA predicted the number of MS components regardless of age, sex, and other confounding variables (Table 3).
Table 2. Uric acid level according to sex and presence of metabolic syndrome components (MS; n=80)
MS components Uric acid (mg/dL)
n Men p value* n Women p value*
Abdominal obesity 0.034 0.032
WC<102/88cm 16 4.6 (3.9-5.5) 12 2.8 (2.6-3.6)
WC≥102/88cm 18 5.8 (4.7-6.4) 34 3.6 (3.2-4.5)
HDL 0.587 0.024
<40/50mg/dL 22 5.0 (4.2-6.2) 24 3.7 (3.2-5.2)
≥40/50mg/dL 12 4.8 (4.2-6.2) 22 3.0 (2.6-4.0)
Tryglycerides 0.055 0.125
<150mg/dL 14 4.6 (3.8-5.6) 30 3.2 (2.8-4.1)
≥150mg/dL 20 5.9 (4.6-6.3) 16 3.7 (3.2-5.4)
Blood pressure 0.555 0.046
<130 or 85mmHg 15 4.6 (4.2-6.2) 21 3.2 (2.8-3.7) ≥130 or 85mmHg
and/or presence of arterial hypertension
19 5.5 (4.4-6.3) 25 3.7 (2.9-5.0)
Fasting glucose level 0.309 0.282
<110mg/dL 25 5.2 (4.4-6.3) 32 3.2 (2.8-4.1)
≥110mg/dL and/ or presence of diabetes
9 4.6 (3.9-5.9) 14 4.6 (3.9-5.9)
Data given as median (interquartile range). *p value according to Mann-Whitney test. WC: waist circumference; HDL: high-density lipoprotein.
Table 3. Multiple linear regression analysis of uric acid level (mg/dL) as a predictor for number of metabolic syndrome components
β CI (95%) R² p value
Simple regression 0.600 (0.254; 0.947) 0.149 0.001
Model 1* 0.592 (0.199; 0.984) 0.239 <0.001
Model 2** 0.591 (0.233; 0.949) 0.116 0.011
*Adjusted for sex and age; ** adjusted for physical activity and use of medication. 95% CI: 95% confidence interval.
Table 1. Characterization of the sample (n=80), according to uric acid (UA) levels
Variables assessed* Low UA** (n=43)
High UA**
(n=37)
p values***
BMI (kg/m2) 27.5 (24.6-30.9) 30.5 (28.5-32.7) 0.001
Obesity 0.017
Normal-weight, n (%) 11 (13.8) 2 (2.4)
Overweight/obesity****, n (%) 32 (40.0) 35 (43.8)
Waist circumference (cm) 94.4±11.1 102.4±9.9 0.001
Body fat, % 21.5 (16.2-28.1) 26.9 (21.3-32.4) 0.031
Sex, n (%) 0.901
Male 18 (22.5) 16 (20.0)
Female 25 (31.2) 21 (26.3)
Age (years) 51 (30-57) 53 (38-60) 0.109
Age group, n (%) 0.264
Adult 37 (46.3) 28 (35.0)
Elderly (≥60 years) 6 (7.5) 9 (11.2)
Relation with UFV, n (%) 0.581
Student 11 (13.9) 9 (11.4)
Staff/dependent 32 (40.5) 27 (34.2)
Physical activity, n (%) 0.927
Yes 26 (32.5) 22 (27.5)
No 17 (21.2) 15 (18.8)
Smoking, n (%) 0.615
Never smoked 32 (40.5) 26 (32.9)
Former smoker/smoker 10 (12.7) 11 (13.9)
*Data of mean ± standard deviation or median (interquartile range) or frequency (%); **classification as low and high uric acid according to the median: 4.8mg/dL for men and 3.4mg/dL for women; *** p values according to Mann-Whitney test, Student’s t-test and χ2 , when appropriate. ****Classification of overweight/obesity according to BMI
(≥25kg/m²). BMI: body mass index; UFV: Universidade Federal de Viçosa. DISCUSSION
This study contributed to a better understanding of UA in relation to the clinical and metabolic variables in a population at cardiometabolic risk.
UA is an organic compound, endogenously produced by the liver in humans as a metabolite of purine. It is formed by adenosine, inosine, hypoxanthine, adenine and guanine, and it is the main hydrophilic antioxidant in the body.(20,21) Therefore, UA inhibits the action of
free radicals on organic molecules, such as those present in cell membranes and genetic material.(22) However,
the acute increase in UA level seems to be a protective factor against oxidative stress, and its chronic increase is associated with the risk of chronic, non-communicable diseases.(6,9)
In this context, the first relevant result of this study was the detection of higher UA levels in subjects showing MS when compared to those who did not. Our results are similar to those observed in previous cross-sectional studies.(9)
The prevalence of MS observed in this study surpassed that described in previous studies.(9,23)
However, studies have shown prevalence rates of MS ranging from 8.0 to 70.7%, depending on the age group.(9)
observed in this study are due to the older age group of subjects, as well as to the fact that it is a population at cardiometabolic risk, directly related to the presence of the syndrome. Previous epidemiologic studies have also shown increased serum UA levels in adults with MS,(6,9,12)
as well as an association between increased UA levels and oxidative stress, endothelial dysfunction, inflammation, atherosclerosis, and increased risk of cardiovascular events.(10,24) According to Rho et al,(25) there is a strong
association between UA and MS, which suggests that the former could be an independent contributor to the development of the condition. Some studies suggest that because UA is an effective antioxidant, the increase in this biomarker among subjects with MS might reflect a compensatory mechanism to the increased oxidative stress associated to MS.(26)
Gagliardi et al.(10) stated that UA levels are higher
according to the number of MS components. This corroborates the results observed in this study, since subjects with pre-MS (two components) showed lower UA levels in relation to those with MS (three or more components). This relation can also be observed by the predicting effect of UA on the number of MS components even after adjustments; therefore, it represents a potential risk factor. Other studies have also shown an association between hyperuricemia and MS components – abdominal obesity, hypertension, dyslipidemia - kidney diseases, and CVD.(10)
The association between UA and cardiometabolic risk factors seems to show differences between sexes, such as observed between other biomarkers and cardiometabolic risk, where women showed more noticeable effects.(24) The results of this study
confirm such hypothesis, since women showed significant differences in UA values when three MS components were observed, while men showed significant differences even in the presence of one single component.
BMI and total body fat, indicators of total adiposity; and WC, indicator of central adiposity, showed an association with UA levels. De Oliveira et al.(24)
observed that subjects with BMI ≥25kg/m² and lower muscle mass levels showed higher UA levels.(24) The
release of the hormone leptin is directly related to the degree of adiposity, and it seems to induce oxidative stress in endothelial cells, thus increasing UA levels.(6)
Besides, leptin and insulin resistance can reduce the renal excretion of UA.(27)
The association between tryglycerides and UA observed in men was reported by other authors.(12) One
potential mechanism involved in this relation is the fact that tryglycerides synthesis requires more NADPH. Moreover, the synthesis of fatty acids in the liver is related to increased synthesis of purines, therefore speeding up the pace of UA production.(28,29)
A significant relation between arterial hypertension and UA concentrations was identified in this study. These results were described in other studies, such as that by Barbosa et al.(8), with a sample of 756 subjects,
in which a direct association between blood pressure and UA was observed. The reduced excretion of UA is reported in patients with MS, and it seems to reflect changes in renal excretion of renal UA, secondary to the increased resorption of sodium by proximal tubules, mediated by hyperinsulinemia.(8) Another
plausible mechanism refers to the action of UA by inhibiting the bioavailability of nitric oxide, a powerful vasodilator.(30)
This study showed an inverse association between HDL-c and UA levels. The same was observed by Barbosa et al.(8) in a not hospitalized population. The
relation between low HDL and high UA seems to be mediated by insulin resistance; that was confirmed by de Oliveira et al., who observed that the correlation between HDL and UA is lost after statistical adjustments by MS components.(24)
This study had some limitations. First of all, this is a cross-sectional study, which only allows the analysis of variable associations, without time inferences. Although the sample calculations were adequate to guarantee power, studies with a population-based sample are still required. Other pieces of information, such as use of medication, habitual diet, drinking habits, and menopausal status could be assessed in future studies.
CONCLUSION
The uric acid levels were related to the presence of metabolic syndrome and its components, for which differences in sex were observed. Our results highlighted the importance of uric acid as a biomarker in patients at cardiometabolic risk as well as the need to reconsider the nutritional therapy of hyperuricemic patients considering of the treatment of metabolic syndrome.
ACKNOWLEDGMENTS
technical assistance, and for the volunteer trainees from PROCARDIO-UFV for their support in data collection. To the Culture and Extension Vice-president Office (PEC/UFV) for the university scholarship, and to the Coordenação de Aperfeiçoamento de Pessoal de
Nível Superior (CAPES) for the doctorate scholarship
granted to HAS and JCCC, respectively. Finally, we thank Fundação Arthur Bernardes (Funarbe) for the grant Quality in Excellence Research for Young Researchers granted to HHMH.
REFERENCES
1. Borges CF, Busnello FM, Pellanda LC. Identificação de fatores de risco cardiovascular em pais/cuidadores de crianças cardiopatas. Arq Bras Cardiol. 2012;99(4):936-43.
2. Bressan J, Hermsdorff HH, Zulet MA, Martínez JA. Impacto hormonal e inflamatório de diferentes composições dietéticas: ênfase em padrões alimentares e fatores dietéticos específicos. Arq Bras Endocrinol Metabol. 2009;53(5):572-81. Review.
3. Sposito AC, Caramelli B, Fonseca FA, Bertolami MC, Afiune Neto A, Souza AD, Lottenberg AM, Chacra AP, Faludi AA, Loures-Vale AA, Carvalho AC, Duncan B, Gelonese B, Polanczyk C, Rodrigues Sobrinho CR, Scherr C, Karla C, Armaganijan D, Moriguchi E, Saraiva F, Pichetti G, Xavier HT, Chaves H, Borges JL, Diament J, Guimarães JI, Nicolau JC, dos Santos JE, de Lima JJ, Vieira JL, Novazzi JP, Faria Neto JR, Torres KP, Pinto Lde A, Bricarello L, Bodanese LC, Introcaso L, Malachias MV, Izar MC, Magalhães ME, Schmidt MI, Scartezini M, Nobre M, Foppa M, Forti NA, Berwanger O, Gebara OC, Coelho OR, Maranhão RC, dos Santos Filho RD, Costa RP, Barreto S, Kaiser S, Ihara S, Carvalho Td, Martinez TL, Relvas WC, Salgado W; Sociedade Brasileira de Cardiologia. [IV Brazilian Guideline for Dyslipidemia and Atherosclerosis prevention: Department of Atherosclerosis of Brazilian Society of Cardiology]. Arq Bras Cardiol. 2007; 88 Suppl 1:2-19
4. National Cholesterol Education Program (NCEP) Expert Panel on Detection, Evoluation, and Treatment of High Blood Cholesterol in Adults (Adult Treatment Panel III). Third Report of the National Cholesterol Education Program (NCEP) Expert Panel on Detection, Evaluation, and Treatment of High Blood Cholesterol in Adults (Adult Treatment Panel III) final report. Circulation. 2002;106(25):3143-421.
5. de Carvalho Vidigal F, Bressan J, Babio N, Salas-Salvadó J. Prevalence of metabolic syndrome in Brazilian adults: a systematic review. BMC Public Health. 2013;13:1198. Review.
6. Tsouli SG, Liberopoulos EN, Mikhailidis DP, Athyros VG, Elisaf MS. Elevated serum uric acid levels in metabolic syndrome: an active component or an innocent bystander? Metabolism. 2006;55(10):1293-301. Review.
7. Krishnan E, Sokolove J. Uric acid in heart disease: a new C-reactive protein? Curr Opin Rheumatol. 2011;23(2):174-7. Review. Erratum in: Curr Opin Rheumatol. 2011;23(4):410
8. Barbosa MC, Brandão AA, Pozzan R, Magalhães ME, Campana EM, Fonseca FL, et al. Associação entre ácido úrico e variáveis de risco cardiovascular em uma população não hospitalar. Arq Bras Cardiol. 2011;96(3):212-8.
9. Serpa Neto A, Rossi FM, Valle LG, Teixeira GK, Rossi M. Relation of uric acid with components of metabolic syndrome before and after roux-en-y gastric bypass in mobidly obese subject. Arq Bras Endocrinol Metabol. 2011; 55(1):38-45.
10. Gagliardi AC, Miname MH, Santos RD. Uric acid: A marker of increased cardiovascular risk. Atherosclerosis. 2009; 202(1):11-7. Review.
11. Dean AG, Sullivan KM, Soe MM. OpenEpi: Open Source Epidemiologic Statistics for Public Health, Versão. www.OpenEpi.com. [atualizado 2014/09/22, cited 2014 Oct 30].
12. Cavagioni LC, Bensenõr IM, Halpern A, Pierin AM. [Metabolic Syndrome in professional truck drivers who work on Highway BR-116 within the area of São Paulo City - Régis Bittencourt]. Arq Bras Endocrinol Metab. 2008;52(6):1015-23. Portuguese.
13. World Health Organization (WHO). BMI Classification, 2013. WHO [cited 2014 June 30]. Available from: apps.who.int/bmi/index.jsp?introPage=intro_3.html
14. Sociedade Brasileira de Hipertensão; Socidade Brasileira de Cardiologia; Sociedade Brasileira de Endocrinologia e Metabologia; Sociedade Brasileira de Diabetes. Sociedade Brasileira de Estudos da Obesidade. I Diretriz Brasileira de Diagnóstico e Tratamento da Síndrome Metabólica. Arq Bras Cardiol. 2005;84 Suppl 1: 3-28.
15. Vasques AC, Rosado LE, Rosado GP, Ribeiro Rde C, Franceschini Sdo C, Geloneze B, et al. [Predictive ability of anthropometric and body composition indicators in the identification of insulin resistance]. Arq Bras Endocrinol Metab. 2009;53(1):72-9. Erratum in: Arq Bras Endocrinol Metabol. 2009;53(3):388. Portuguese.
16. Hochberg MC, Smolen JS, Weinblatt ME. Rheumatology. 3rd ed. New York: Mosby; 2003.
17. Yin Q, Chen X, Li L, Zhou R, Huang J, Yang D. Apolipoprotein B/apolipoprotein A1 ratio is a good predictive marker of metabolic syndrome and pre-metabolic syndrome in Chinese adolescent women with polycystic ovary syndrome. J Obstet Gynaecol Res. 2013;39(1):203-9.
18. Hermsdorff HH, Puchau B, Zulet MA, Martínez JA. Association of body fat distribution with proinflammatory gene expression in peripheral blood mononuclear cells from young adult subjects. OMICS. 2010;14(3):297-307.
19. Willett WC. Nutritional epidemiology. 2nd ed. New York: Oxford University Press; 1998
20. Manfredi JP, Holmes EW. Purine salvage pathways in myocardium. Annu Rev Physiol. 1985;47:691-705. Review.
21. Sautin YY, Johnson RJ. Uric acid: the oxidant-antioxidant paradox. Nucleosides Nucleotides Nucleic Acids. 2008;27(6):608-19.
22. Hooper DC, Spitsin S, Kean RB, Champion JM, Dickson GM, Chaudhry I, et al. Uric acid, a natural scavenger of peroxynitrite, in experimental allergic encephalomyelitis and multiple sclerosis. Proc Natl Acad Sci USA. 1998; 95(2):675-80.
23. Ford ES, Li C, Cook S, Choi HK. Serum concentrations of uric acid and the metabolic syndrome among US children and adolescents. Circulation. 2007; 115(19):2526-32.
24. de Oliveira EP, Moreto F, Silveira LV, Burini RC. Dietary, anthropometric, and biochemical determinants of uric acid in free-living adults. Nutr J. 2013;12:11
25. Rho YH, Woo JH, Choi SJ, Lee YH, Ji JD, Song GG. Association between serum uric acid and the Adult Treatment Panel III-defined metabolic syndrome: results from a single hospital database. Metabolism. 2008;57(1):71-6.
26. Nieto FJ, Iribarren C, Gross MD, Comstocka GW, Cutler RG. Uric acid and serum antioxidant capacity: a reaction to atherosclerosis? Atherosclerosis. 2000;148:131-9.
27. Fruehwald-Schultes B, Peters A, Kern W, Beyer J, Pfützner A. Serum leptin is associated with serum uric acid concentrations in humans. Metabolism. 1999;48(6):677-80.
28. Matsuura F, Yamashita S, Nakamura T, Nishida M, Nozaki S, Funahashi T, et al. Effect of visceral fat accumulation on uric acid metabolism in male obese subjects: visceral fat obesity is linked more closely to overproduction of uric acid than subcutaneous fat obesity. Metabolism. 1998;47(8):929-33.
relationship between fasting serum uric acid and the insulin sensitivity index in a population-based sample of 380 young healthy Caucasians. Eur J Endocrinol. 1998;138(1):63-9.