Instituto Superior de Educação e Ciências
Master Thesis in Human Factors and Technological Transport systems
Driver’s perceptions about the effects of speed regulation systems in the driving task
Autor:
Ana Luísa Barradas Vicente FerreiraJúri:
Professora Doutoura Anabela dos Santos Aleixo Simões
Professor Doutor Carlos Marques
Professor Doutor Pedro Ferreira
ii Aknowledgements
Firstly, I would like to thank my supervisor Anabela Simões, for giving me the opportunity to be part of the research project INTERACTION and for trusting in my research abilities. Secondly, I have to thank Giulio Piccinini, and this one is very special thank you because of the great scientific and personal support that he gave throughout this work. Also for the help in the English department.
I also like to thank Susana Rôla for being such a good colleague and friend. Also the other research colleagues that make the research center a friendly space to work.
I have to thank all the good music artists that made the soundtracks that always accompanied me while I was working, and inspired me when I didn’t feel like working. I have to thank all my friends and specially my best friends, Wasanthi and Eduarda, for all the good times and for always being here for me, even if we are living in different countries.
Abstract
Speed regulation systems like the cruise control (CC) and the speed limiter (SL) are becoming a standard feature in vehicles nowadays. However, these systems add a certain level of automation to the driving task and so they have the potential to change the way people drive. In order to understand the potential that these systems have in terms of road safety, it is crucial to understand how drivers percept the effects of the systems during the driving task. Then, the aim of the present research was to identify driver’s perceptions about the effects of speed regulation systems, more specifically the cruise control and the speed limiter, in the driving task and, to accomplish this goal, a questionnaire was applied. The main findings were that females are more prone to keep speeds equal to the road speed limit, and that when using both, cruise control and speed limiter, drivers are more available to comply with road speed limits. It was also found that the CC has a bigger impact than the SL when it comes to engaging into secondary tasks while driving.
Table of contents
Aknowledgements ... ii
Abstract ... iii
Table of contents ... iv
List of Figures ... vii
Nomenclature... ix
INTRODUCTION ... 1
PART I. THEORETICAL FRAMEWORK ... 4
Chapter 1. Speeding issue ... 4
1.1 Impacts of speed on transport... 4
1.2 Obstacles to speed management in Europe ... 5
1.3 Speed limits in Portugal ... 6
1.4 Factors influencing drivers speed choice ... 6
Chaper 2. Intelligent Transportation Systems ... 9
2.1 IVIS (In-vehicle Information and Communication Systems) ... 10
2.2 ADAS (Advanced Driver Assistance Systems) ... 11
Chapter 3. Driving task and drivers’ activity ... 16
Chapter 4. Drivers’ information processing ... 20
4.1 Attention ... 21
4.2 Situation Awareness ... 25
Chapter 5. Automation and behavioural adaptation ... 27
5.1 Mental Workload... 28
5.2 Distraction ... 29
5.3 Poor SA ... 30
v
Chapter 6. Drivers’ variability ... 33
6.1 Age and driving ... 33
6.2 Gender and driving behaviour ... 36
Chapter 7. Research Questions ... 38
PART II. METHODOLOGY ... 39
PART III. RESULTS ... 42
1.1 Cruise control results ... 42
1.2 Speed limiter results ... 51
1.3 Interview results ... 61
PART IV. DISCUSSION ... 65
FINAL CONSIDERATIONS ... 71
CONCLUSION ... 73
REFERENCES ... 74
APPENDICES ... 79
ANNEXES ... 81
vii List of Figures
Figure 1. Combined overall behavioral model to indicate factors that influence drivers’
speed behaviour (Van der Horst, 1998). ... 6
Figure 2. Overview of cruise control and speed limiter in the ITS frame. ... 12
Figure 3. Mercedez-benz CC/SL systems’ lever ... 13
Figure 4. Peugeot CC/SL systems’ lever……….10
Figure 5. Renault CC/SL systems’ buttons. ... 13
Figure 6. The hierarchical structure of the road user task (Michon, 1985). ... 17
Figure 7. Three levels of task performance (Rasmussen, 1996). ... 19
Figure 8. Model of Human information processing stages (Wickens, 2004). ... 21
Figure 9. Types of attention (Eysenck & Kean, 2005). ... 23
Figure 10. Multiple resource theory three-dimensional diagram structure (Wickens, 2002). ... 24
Figure 11. Model of Situation Awareness in driving (Endsley, 1999). ... 26
Figure 12. Inter-relationships between workload drivers, workload and performance (Parasuraman & Hancock, 2001) (p.307). ... 28
Figure 13. Number of crashes with fatalities or in-patients per billion driven kilometers for age groups (2006-2008) (SWOV, 2010). ... 33
Figure 14. Histogram of the age distribution of CC respondents. ... 42
Figure 15. Pie chart with the distribution of age categories in the CC user group. ... 43
Figure 16. Number of years of possession of CC. ... 43
Figure 17. Opinions about the most important benefits of the CC. ... 44
Figure 18. Bar chart with the perceived usefulness (mean value) of the CC in different driving situations. ... 45
viii
Figure 20. Reported frequency of CC use while driving by gender. ... 47
Figure 21. Reported frequency of CC use while driving by age category. ... 47
Figure 22. Reported average time of use of CC while driving. ... 48
Figure 23. Reported speed selection while using the CC. ... 48
Figure 24. Reported speed selection while using the CC by gender. ... 49
Figure 25. Reported speed selection while using the CC by age category. ... 50
Figure 26. Reported preference in using the mobile phone to make a call while using the CC. ... 51
Figure 27. Histogram of the age distribution of SL users. ... 51
Figure 28. Pie chart with the distribution of age categories in SL user group. ... 52
Figure 29. Number of years that users have the SL. ... 53
Figure 30. Opinions about the most important benefits of the SL. ... 54
Figure 31. Bar chart with the perceived usefulness (mean value) of the SL in different driving situations. ... 55
Figure 32. Reported frequency of SL use while driving. ... 56
Figure 33. Reported frequency of SL use while driving by gender. ... 57
Figure 34. Reported frequency of SL use while driving by age category. ... 57
Figure 35. Reported average time of use of SL while driving. ... 58
Figure 36. Reported speed selection while using the SL. ... 59
Figure 37. Reported speed selection while using the SL by gender. ... 60
Figure 38. Reported speed selection while using the SL by age category. ... 60
Nomenclature
ACC_ Adaptive Cruise Control
ADAS_ Advanced Driver Assistance Systems CC_ Cruise Control
EU_ European Union
ITS_ Intelligent Transport Systems
IVIS_ In-Vehicle Information and Communication Systems KB_ Knowledge-based level
RB_ Rule-based level SA_ Situation Awareness SB_ Skill-based level SL_ Speed Limiter
INTRODUCTION
The present study was developed in the frame of the European Project INTERACTION (FP7). The European Project INTERACTION focused on 4 systems (cruise control, speed limiter, navigation system and mobile phone) and the main aim was to identify the patterns of use of these systems for drivers that use them on daily basis.
The present study was based on material developed in the aim of this project, in particular in the survey that was applied to Portuguese drivers. In the frame of the project, the data was treated in more general way, the intention here was to focus only on speed regulation systems (cruise control and speed limiter) and to give meaning to those results in the Portuguese road context.
In part two of the document the methodology is explained. The methodology applied was split in two different moments: the analysis of the questionnaire data and a second and more complementary part represented by the interviews.
In part three, the results are discussed and related with the theories that were the support on this work to draw recommendations.
Finally, the conclusions are drawn from the results obtained, along with the limitations and proposed improvements for further investigations in the field of this work.
According to European Commission’s white paper (2011), a big concern in the transportation field in the present days and for the future is with no doubt to reduce transport emissions, avoid congestions, turn mobility more sustainable and more energy efficient. New technologies for vehicle and traffic management play an important role in those efforts. Delayed action and timid introduction of new technologies could condemn the European Union (EU) transport industry to irreversible decline. That is why it is more and more important not just to integrate those systems, but to investigate in detail the impact of those systems in the real context.
Nowadays, the research in the field of ITS is mainly focused on systems that are not yet available for consumers or on systems that are only available for a limited range of consumers (e.g. systems that can only be found in high class vehicles), like the case of adaptive cruise control (ACC). It is very important that these systems are investigated before being released in the market, because this will allow knowing more about the implications that these systems have on the driving task and on the driver. However, this didn’t happen for all the ITS that were released for vehicles, as in the case of the speed regulation systems like the cruise control and the speed limiter.
The aim of the present research was to identify driver’s perceptions about the effects of speed regulation systems (cruise control and speed limiter) in the driving task.
PART I. THEORETICAL FRAMEWORK
Chapter 1. Speeding issue
In 2009, about 35,000 people were killed in road accidents in the 27 member states of the EU (European Commission, 2011). Speed is one of the basic risk factors in traffic (Wegman & Aarts, 2006): higher driving speeds lead to higher collision speeds and, therefore, to more severe injury. Higher driving speeds also provide less time to process information and react to a critical situation, and the braking distance is longer.
Over the years, several studies focused on the relation between speed and crash rate using different approaches but it has been very difficult to relate one to another since it is difficult to isolate speed from other factors that contribute for the crash (Aarts & Van Schagen, 2006). This complexity is the reason for the conditions that influence the relation between speed and road safety hasn’t yet been found.
1.1Impacts of speed on transport
Accidents
Generally, the number and severity of accidents decrease with decreasing speed. A reduction of the mean speed by 1 km/h can be expected to bring 2 to 3.5 percent reduction in the number of accidents with injuries, and also to reduce to almost half the number of fatalities and accident costs (Baruya, 1998).
Environmental effects
Vehicle operation and maintenance costs
When drivers adopt higher speeds the fuel consumption can increase significantly and associated costs will be higher. A vehicle that is constantly traveling at higher speeds will have a higher maintenance, due to a greater friction of components (e.g. tyres, breaking discs, etc.). If drivers reduce sudden accelerations, breakings and adopt lower speeds, the energy needs can be significantly decreased.
1.2Obstacles to speed management in Europe
The present values for speed limits are vague, it is not clear if they represent desired levels of speed from the viewpoint of society or from the road transport system. The speed limits should be based on more explicit and systematic criteria (Kallberg, Allsop, Ward, Van der Horst, & Várhelyi, 1998).
Every European country has a specific system for road classification criteria. These classifications are administratively convenient but, most of the times, they do not reflect the statistical features of the road, such as traffic speed, traffic volume, degree of congestion, road environment and so on (Baruya, 1998).
It is common for drivers to underrate accident and environmental costs considering the time they save by adopting higher speeds (Kallberg et al., 1998).
Speed reducing measures are not very popular among drivers (Kallberg et al., 1998).
1.3Speed limits in Portugal
In Portugal, roads have different characteristics but the speed limits are not always coherent with the characteristics of the road. Sometimes, we can observe very low speed limits in roads that have characteristics of main roads. If we have a road that has main road characteristics (90 km/h limit) and the speed limit presented is 50 km/h, drivers might ignore it, especially when this situation is happening repeatedly, this might lead the driver to ignore the speed limit presented, since they are not always consistent. The national project SAFESPEED main aim is to develop a tool to better define the most adequate speed in each road and to find solutions to reduce accidents in Portuguese roads. The researchers of this project believe that there is a real need to define technical criteria to establish roads speed limits in Portugal, since there are some roads where the speed limits are completely misfit (CiênciaHoje, 2012).
1.4Factors influencing drivers speed choice
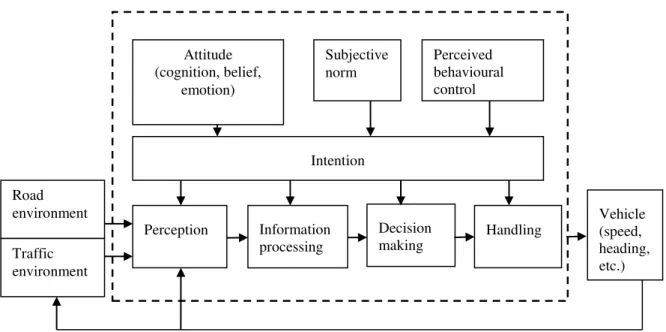
Speed behaviour can be driven by several factors. Each of the factors influencing the speed behaviour is briefly described below (Figure 1).
Figure 1. Combined overall behavioral model to indicate factors that influence drivers’ speed behaviour (Van der Horst, 1998).
Attitude (cognition, belief,
emotion)
Subjective norm
Perceived behavioural control
Intention
Perception Information processing
Decision making
Handling Road
environment
Traffic environment
Speed and motivation
Driving speeds are affected by several factors, among those, the most relevant motivational factors are the driving speeds of other road users and others’ opinions and reactions towards speed.
Drivers’ emotions and moods of the drivers also seem to influence speeds (e.g. fear, anger, boredom, excitement, etc.). In addition, people characteristics also make them experience the surroundings and manage emotions in different ways. For instance, if we think about an aggressive person, the likelihood of transferring the aggressiveness while driving is high (Kallberg et al., 1998).
Acceptability of present speeds
It is very important that the speed limits imposed are accepted by all road users. If drivers do not entirely agree with the speed limits imposed, they might not comply with them.
Policy makers are interested in this topic, considering that the success of the policies also relies in some part by their social acceptance (Kallberg et al., 1998).
Enforcement
Enforcement measures can be effective in keeping driving speeds, but this is more effective if the chance of being caught is perceived by the driver as being high (Kallberg et al., 1998). The impact of enforcement of actual speeds depends on several factors (Kallberg et al., 1998):
- The actual speed level compared to speed limit; - Intensity of enforcement (risk of getting caught); - Penalty system;
- Publicity.
Road design
areas. Measures that physically restrict driving at high speeds seem most effective, especially speed humps and roundabouts.
A good solution would be to design roads that are “self-explaining”. By designing a road that provides a speed image, that corresponds to the actual speed limit, drivers are more likely to choose the appropriate driving speed almost automatically (Van der Horst, 1998).
Behaviour led by differences in vehicles sound-proof construction
Hearing has great importance in speed estimation (Noguchi, 1990), modern vehicles are gradually becoming more and more sound-proof, which can also be one of the explanations for the tendency to increase speeds.
Intelligent Transportation Systems (ITS)
Chaper 2. Intelligent Transportation Systems
According to the Directive 2010/40/EU (Official Journal of the European Union, 2010), Intelligent Transportation Systems (ITS) are defined as telecommunications, electronics and information technologies that are integrated in transport engineering in order to plan, design, operate, maintain and manage transport systems. The application of those information and communication technologies to the road transport sector and its interfaces with other modes of transport will bring significant contributions: improvement of environmental performance, efficiency (including energy efficiency), safety and security of road transport (including the transport of dangerous goods, public security and passenger and freight mobility), whilst at the same time ensuring the functioning of the internal market as well as increased levels of competitiveness and employment (Official Journal of the European Union, 2010).
ITS can be applied to all transport modes and can facilitate their interlinking. ITS can have very different applications, infrastructure of highways, streets, bridges, tunnels, railways, port and airport infrastructure, as well as to a growing number of vehicles, including cars, buses, trucks and trains, as well as aircraft and waterborne vessels. They also can be applied for both for passenger and freight transport (Sitavancova & Hajek, 2009).
ITS are becoming a constant in the transport context nowadays, and the road context is not an exception. The interest in ITS came mainly from the increasing problems caused by traffic congestion and the contemporaneous opportunity to have a possible synergy between new information technology for simulation, real-time control, and communications networks. Traffic congestion has been increasing worldwide as a result of increased motorisation, urbanisation, population and economy growth, and changes in population density. This causes a reduction in the efficiency of transportation infrastructure and an increase travel time, air pollution, and fuel consumption, which also lead to increased costs (Sitavancova & Hajek, 2009).
In road context, which is the target context in this study, ITS can be categorized in infrastructure based, vehicle based and cooperative systems (vehicle to road based and/or vehicle to vehicle based). The common background in all of these technologies is the support to the driver and/or the management of traffic in the transport system. On the vehicle side of ITS, there are two major subdivisions that are usually considered: In-vehicle Information and Communication Systems (IVIS) and Advanced Driver Assistance Systems (ADAS).
IVIS and ADAS can, then, be subdivided into intelligent and not intelligent systems. The term ”intelligent” in ITS is used because the system should adapt to the actual situation, anticipate the needs and take initiative and possibly be explanative. In “not intelligent” systems, external factors do not change the way the system works, indeed unlike “intelligent” systems that are regulated by inputs from “outside”, “not intelligent” systems are regulated from inputs that are coming from inside the vehicle, from the driver himself. For the scope of this dissertation only vehicle-based ITS are going to be investigated.
2.1IVIS (In-vehicle Information and Communication Systems)
In-vehicle Information and Communication Systems make available to drivers several types of information that can be useful to the driving task, like information concerning road conditions, weather broadcast, maps of cities, guidance throughout specific places, vehicle diagnostics and, in some situations, warning systems and emergency help systems. All these equipments, with different functionalities, are used to facilitate and manage the driving task, making it also more efficient and ecological (Adler & Blue, 1998).
IVIS are becoming more and more present in vehicles nowadays. Since people carry around a lot of technological devices with them all the time (laptops, mobile phones, tablets, etc.), it is to be expected that the usage of those objects is also done inside the vehicle, even more considering that, in these days, people can spend a lot of time driving.
became a major priority in congested urban areas. Providing alternatives to the crowded roads or even presenting real-time in-vehicle traffic information to drivers, turned out to be one possibility of achieving this goal (Pereira, 2009; Sitavancova & Hajek, 2009).
2.2ADAS (Advanced Driver Assistance Systems)
According to Linder, Kircher, Vadeby and Nygårdhs (2007), Advanced Driver Assistance Systems are supporting the driver in their primary driving task (safely controlling the vehicle until reaching the destination). They assist the driver and do not take over the driving task completely, thus the responsibility always remains with the driver. They inform and warn the driver, provide feedback on driver actions, increase comfort and reduce the workload by actively stabilizing or manoeuvring the car. With respect to the driving tasks categories (presented further in Chapter 3), ADAS are focusing on the manoeuvring level (PREVENT, 2006).
To summarize, ADAS are characterized by the following properties: • detect and evaluate the vehicle environment;
• use complex signal processing;
• provide active support for lateral and/or longitudinal control with or without warnings; • support the driver in the primary driving task.
Figure 2. Overview of cruise control and speed limiter in the ITS frame.
2.2.1 Conventional Cruise Control
The conventional cruise control is a driving assistance system whose main aim is to keep a speed predefined by the driver, without the need of the driver to keep pressing the gas pedal (Patterson, 1998).
Different brands have different interfaces for the same system, but there are two main types of instrumentation: in the first one (Figure 3 and Figure 4) there is a lever placed behind the steering wheel, more or less at the same distance from the indicator lever whereas, in the second type of interface, the buttons are placed directly on the steering wheel (Figure 5).
The controls presented in the figures below integrate together the CC and the SL. However, there are also vehicles that include the CC and the SL separately and, some others which only have either the CC, or the SL available.
Road context ITS
IVIS
ADAS
Lateral support Longitudinal support
Intelligent
Adaptive Cruise Control
Intelligent Speed Adaptation
...
Not intelligent
Cruise Control
Speed Limiter
Speed Alert
...
Driver Awareness
support ...
Figure 3. Mercedez-benz CC/SL systems’ lever. Figure 4. Peugeot CC/SL systems’ lever.
Figure 5. Renault CC/SL systems’ buttons.
In interfaces that have both systems available, there are 2 distinct steps in the use. The driver, at first, chooses which one of the systems he/she wants to use and, then, he/she can activate/deactivate the system.
increment of speed is done either 1 km/h by 1 km/h or 2 km/h by 2 km/h (also depending on the brand and model of the vehicle).
When a speed is chosen, it stays in the system’s memory, so the driver can recall it, after deactivating the system, by pressing the “Resume” button (it appears on the controls as an “R”). The deactivation of the speed can either be done applying some pressure on the brake pedal or even pressing the “Cancel” button. It must be noted that pressing the accelerator does not alter the set speed. Consequently, when the accelerator pedal is released, the vehicle returns to the previous settings (Rakha, Hankey, Patterson, &Van Aerde, 2001).
Pressing the “Off” button or turning off the ignition turns the CC system off and erases the memory.
Conventional cruise control takes over the accelerator operation only at speeds over 40 km/h, when it is engaged (Rakha et al., 2001).
2.2.2 Speed Limiter
The speed limiter consists of an active gas pedal that provides a counter-force, perceived by the feet of the driver, whenever the driver tries to exceed the pre-set speed limit.
When the driver wants to use the SL, he has to turn the lever or switch (this will depend on the vehicle brand and model) to the SL, and the system is on. In a second moment, the speed can be set: this operation can be done by accelerating the vehicle until it reaches the desired speed and pressing the set button or by pressing the “+” or “-“ button until when the desired speed is reached. The increment of speed is also done like the CC, either 1 km/h by 1 km/h or 2 km/h by 2 km/h (also depending on the make and model of the vehicle).
When the driver doesn’t want to use the system anymore, he/she just needs to switch the lever or switch to the “Off” position.
the vehicle reaches the pre-set speed limit. In order not to cut the acceleration abruptly, and to have a smooth transition to the limited mode, the device allows the speed to exceed the limit initially but then, the accelerator cannot be depressed until the speed of the car decreases below the pre-set speed limit.
Chapter 3. Driving task and drivers’ activity
Driving is frequently thought as a perceptual-motor task, in which all that is required is driver’s manipulation on the car controls at the same time that he/she tracks various changes in the environment. This view might lead to considering that driving is a relatively simple task but, actually, there are a lot of constraints when the task is being performed: driving relies on complex human sub-tasks that must be performed together in order to achieve what it might seem like trivial driving tasks (Groeger, 2000). To deal with the complexity and to better study the driving task, researchers suggested models that decompose it in different levels.
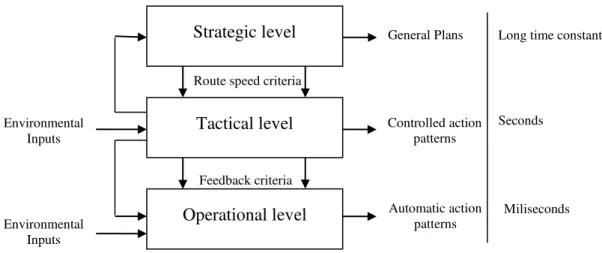
In 1979, Michon (as cited in Bellet, Tattegrain-Veste, Chapon, Bruyas, Pachiaudi, Deleurence, & Guilhon., 2003) proposed a hierarchical model to classify the driving task (Figure 6). In this model, the highest level is the strategic (or planning) level, below there is the tactical (or maneuvering) level, and finally the control (or operational) level. The strategic level is related with the purpose of the trip and the driver’s goals. It consists of all processes concerning trip decisions, such as general trip planning, vehicle selection, route selection (and other navigational considerations), setting trip goals, trip safety considerations etc. The strategic decision making hardly requires any new/environmental information, it is largely memory driven. Time management is also taken into account at this level: the time to start the trip, its duration and the destination that should be reached. In addition, decisions can take several minutes to be taken. The tactical level is associated with the choice of maneuvers and immediate goals that the drivers’ faces when trying to reach the destination. This involves dealing with common driving situations like gap acceptance, speed selection, overtaking decisions, obstacle avoidance, lane choice, etc. At this level, the behavior is influenced by both situational and motivational variables. Tactical level decisions are considered to take place in seconds.
can choose to perform different actions. Compared to the previous ones, at this level, decisions are taken instantly. These three levels are happening simultaneously and interfere with one another. But yet, the level of information needed at each level is not the same (Groeger, 1999).
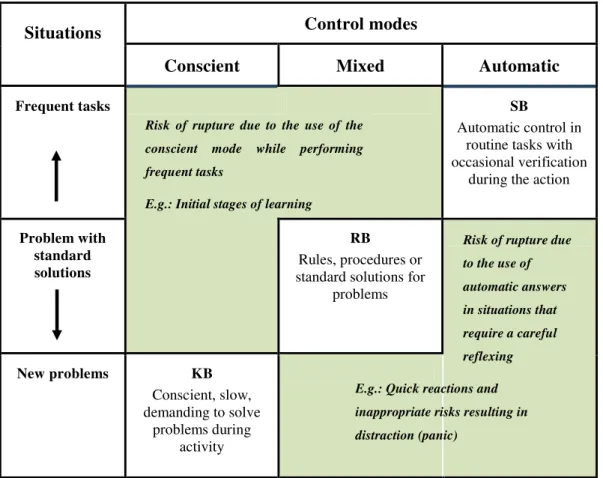
In 1987, Rasmussen (as cited in Groeger, 1999) defined three different levels that explain the human behaviour while perform the driving activity: the skill-based level (SB), the rule-based level (RB) and the knowledge-based level (KB). The skill-based level is where the automatic control of routine tasks takes place. Actions like the control of the speed and the lateral control of the vehicle can be performed in this stage once they are frequently performed automatically, at least for experienced drivers. This is the level where the motor and sensory automatisms are activated and actions are performed without conscious knowledge, except for occasional checks on the progress of the driving activity.
In the rule-based level of performance, activity is based on routines and relies on signs, controlled rules and procedures learned from previous experience. These procedures can also be acquired through transference of experience from others; through formal learning or even elaborated by past problem solving techniques acquired by the individual. For instance, situations like how drivers should react to other vehicles are clearly specified in highway codes and road traffic laws and control driver performance in many ways.
Compared to the previous two levels, knowledge-based behaviours are activated when no obvious familiar solution appears adequate in solving the problem in hand. When an
Figure 6. The hierarchical structure of the road user task (Michon, 1985).
Route speed criteria
Feedback criteria
General Plans
Controlled action patterns
Automatic action patterns Environmental
Inputs
Strategic level
Tactical level
Operational level Environmental
Inputs
Long time constant
Seconds
unusual situation occurs and there is no specific rule to apply, the driver’s knowledge has to be “activated” in order to solve the dilemma. At this level, the subject consciously mobilizes his/her resources to face the problem to accomplish that specific objective.
Situations Control modes
Conscient Mixed Automatic
Frequent tasks SB
Automatic control in routine tasks with occasional verification
during the action
Problem with standard solutions
RB
Rules, procedures or standard solutions for
problems
New problems KB
Conscient, slow, demanding to solve
problems during activity
Figure 7. Three levels of task performance (Rasmussen, 1996).
Risk of rupture due to the use of automatic answers in situations that require a careful reflexing
E.g.: Quick reactions and inappropriate risks resulting in distraction (panic)
Risk of rupture due to the use of the conscient mode while performing frequent tasks
Chapter 4. Drivers’ information processing
The human information processing model in Figure 8, it is a more recent model proposed by Wickens (2004) that provides a systemic view over how the information is processed by humans. The stages in which humans process the information help us to understand how functions are linked to transform or carry out some other operation on the information. This model also helps to have a better and more global idea from where the concepts that are going to be defined ahead fit in the information processing.
Figure 8. Model of Human information processing stages (Wickens, 2004).
4.1Attention
After a brief description about how humans process information, it is important to give an overview about the models used over the years to define attention. The next two models presented in this section are the main ones to explain how attention operates and give different perspectives. The Spotlight model was used over many years of research in visual attention to generate new questions and findings. The idea of a spotlight as a
Perceptual
Encoding
Central
Processing Responding
Perception Response
Selection
Response Execution ATTENTION
RESOURCES
LONG-TERM MEMORY SENSORY
REGISTER Thought
Decision Making WORKING
MEMORY
Feedback
metaphor for visual attention was suggested by Posner, Snyder, & Davidson (1980), although the concept may have originated before. In this model, it is stated that everything within a fairly small region of the visual field can be seen clearly and it’s harder to see anything that is not within the beam of the attentional spotlight (Eysenck & Kean, 2005).
The other model discussed here is the Attentional zoom lens model, proposed by Eriksen and St. James in 1986, compares attention to a searchlight, ranging over a scene and whose diameter of the beam can be varied from narrow to wide:
High power (narrow) setting- the attentional resources are concentrated on a very small part of the visual field to extract very detailed information;
Low power (wide) setting- there is an even distribution of the attentional resources over the effective visual field, but little discrimination of detail.
This model suggests that as the size of the attentional field increases, the density of processing resources within that field decreases (Eriksen & St. James, 1986).
There are two main determinants of where attention is directed to: exogenous and endogenous factors (Egeth & Yantis, 1997). Attention can be captured automatically and involuntarily by environmental stimuli, (normally conspicuous stimuli) called exogenous factors. We call bottom-up control when attention is caught by exogenous cues such as sudden movement or appearance of a new object. For example, if a very colored car appears suddenly, it’s hard not to notice it. On the other hand attention can also be driven by goals, and in this case we are talking about top-down control of attention, meaning that your attention can be directed to something in a voluntary and conscious way (endogenous factors). For example, when a driver is already expecting a particular event and his/her resources are focused on that, he/she might miss or process later other abrupt events. It is now considered that these two attentional systems interact with each other.
4.1.1 Divided attention
We speak about divided attention when a person tries to process more than one input at the same time: this usually happens when someone is performing more than one task (e.g. when a driver engages into phone conversation while driving). If the tasks carried out are too similar, the performance will decrease, like in the case of driving a car and watching the television (both tasks have high visual demands). The ability to perform more than one task at the same time also depends on the difficulty of those tasks: for instance, if the task is automated, it is more likely that the human would be able to perform others tasks at the same time (since less attentional resources are spent on the automated task). For example, for someone that has just got the driver license it’s difficult to perform other tasks while driving; however, if the driving task was automated, it would be easier to engage in other activities at the same time.
In 2002, Wickens proposed the multiple resource model with four dimensions that account for time sharing in performance. This model helps us to understand better some behaviours that drivers might adopt in terms of secondary tasks. The four dimensions, presented in Figure 10, are: processing stages, perceptual modalities, visual channels, and processing codes. Each dimension has two ‘levels’ that are going to be presented below.
Auditory Visual Task
similarity
Task difficulty
Experience (e.g. effects on
automacity)
Attention
Selective Attention (process only one input)
Divided Attention (process all inputs)
In the processing stage of performance, there are 3 levels: perception, cognition or responding. The resources used for perceptual activities and for cognitive activities appear to be the same, and functionally, they are separated from the ones underlying the selection and execution of responses (Wickens, 2002).
The perceptual modalities that are considered are the visual and the auditory: is easier for humans to divide attention between two tasks, one visual and other auditory, than between two visual or two auditory tasks (Wickens, 2002).
Concerning visual processing, there are two aspects the focal and ambient vision that are referred to as the visual channels. These two visual channels appear to define separate resources. Focal vision is required for fine detail and pattern recognition (e.g. recognizing a hazardous object in the middle of the road). Ambient vision involves mostly peripheral vision and it is used for sensing orientation and motion, the direction and speed with which one moves through the environment (e.g. driving the car inside the road marks) (Wickens, 2002).
Processing codes is the dimension that distinguishes spatial from verbal processes. The separation of spatial and verbal resources seemingly accounts for the relatively high degree of efficiency with which manual and vocal responses can be time-shared, assuming that manual responses are usually spatial in nature (tracking, steering) and vocal ones are usually verbal (speaking).
4.1.2 Selective attention
One important function of attention is to enable us to select certain information for processing. Selective attention involves filtering stimulus information and it can be defined as the ability to ignore irrelevant stimuli while focusing attention on relevant ones (Parasuraman as cited in Eby, Trombley, Molnar, & Shope, 1998). Attention switching happens when people quickly shift their attention among important stimuli. In order to drive effectively, subjects have to be able to ignore irrelevant inputs and focus attention on vehicle control and movements of nearby vehicles. Visual selective attention can be either space-based or object based: in space-based selective attention, objects that fall within the focus of attention are more effectively processed than objects that fall outside of the attentional window, in the margin (like the spotlight and the zoom lens metaphors presented before, implying that visual attention corresponds to a focus or a margin). Theories that have used these three conceptualizations of attention are referred to as space-based theories and they posit that attention is directed to a spatially defined region of an image. On the other hand, more recent research emphasizes that attention can be used to select objects and perceptual groups and therefore, that visual attention is object-based. According to object-based theories of selective attention, attention selects preattentively (unconscious process that is, basically, the accumulation of available information) defined perceptual objects based on the Gestalt principles such as proximity, similarity and common motion. Kahneman, Treisman, & Gibbs (1992) proposed that the visual field is preattentively segregated into perceptual objects and, then, focused attention selects specific objects for more detailed analysis.
4.1Situation Awareness
Human’s information processing is a very dynamic process and Situation Awareness (SA) is a very important state that represents how drivers interact with the information that is available on the environment that surrounds them.
The three level model suggested by Endsley describes SA as a state of knowledge or product that is separated from the process used to achieve it: in other words, SA is separated from decision making and performance, but there is a link between SA and working memory, attention, workload and stress.
Figure 11. Model of Situation Awareness in driving (Endsley, 1999).
Attention plays an important role in the first level of SA, the perception of the elements of the situation. The following conditions related to the three levels of situation awareness and can explain some inappropriate drivers’ behaviour (Endsley, 1999): 1. Misperception: Lack of or hidden information in the environment, lack of attention, visual difficulties (Visual acuity – static and dynamic – or reduced useful field of view), and confusion in a complex road environment (too much information resulting in difficulties in selecting the relevant information);
2. Incorrect interpretation of the situation (inexperience, confusion resulting from too much information to be processed in useful time or insufficient knowledge);
3. Inappropriate decision resulting directly from an incorrect projection of the situation due to one or both previous phases (perception or interpretation of the situation).
(Look)
Perception of elements in the current situation
(Think)
Comprehension of the current situation
(Anticipate)
Projection of the evolution of the
situation SITUATION AWARENESS
System/Task related factors
Decision
Actions performance State of the
environment
Individual factors
Chapter 5. Automation and behavioural adaptation
Automation happens when a machine assumes a task that was, previously, performed by a human operator (Wickens, 2004). Automation has the potential to bring many benefits to the human activity being, one of those benefits the improvement in efficiency. Modern technological systems are shifting the operator’s task from the physical level to cognitive level. When a task is automated, the operator’s role is qualitatively changed, and this introduces new concerns and issues (Stanton & Marsden, 1996). Among the possible concerns, negative behavioural adaptations might occur when humans deal with automated systems. OECD (1990) defined behavioural adaptation as “those behaviors which may occur following the introduction of changes to the road–vehicle– user system and which were not intended by the initiators of the change”. The CC and the SL are systems that automate some parts of the driving task as it was already explained above; their introduction is, therefore, a potential cause for drivers’ behavioural adaptations.
Another problem associated with automation is mental workload. One of the purposes of automation is to reduce mental workload, and, consequently, improving performance, considering that if decreasing human activity an operator is overloaded, his performance is likely to become worse. However, automated systems have the potential for imposing mental underload which can be as detrimental to performance as overload (Desmond & Hoyes, 1996). When underloaded, a driver might feel compelled to compensate the reduction of workload by engaging into others tasks such as secondary distracting activities. In this case, distraction can be seen as another behavioural adaptation to automation (see Hockey, 1997).
Drivers’ limited attention combined with an highly passive monitory task and consequently decreasing vigilance levels can results in a poor SA, and this can represent safety concerns for the driver.
The topics presented below represent the main issues related to automation which is relevant to evaluate when studying speed regulating systems use (CC and SL in particular). The other concerns (e.g. overtrust) will not be treated for the aim of this particular study.
5.1Mental Workload
The concept of human mental workload can be traced back several decades ago in the frame of human-machine systems in the transportation field. There are some approaches (e.g. Hart & Wickens, 1990) defining the concept of mental workload based on the relation between the environmental demands imposed on the human operator and the capabilities of the operator to meet those demands. However, these approaches can be quite static and they don’t take into account other important human characteristics. With a different approach, Parasuraman and Hancock (2001) believe that workload can also be mediated by the human response to load, to personal skill levels, task management strategies, and other personal characteristics.
Figure 12. Inter-relationships between workload drivers, workload and performance
(Parasuraman & Hancock, 2001)(p.307).
“Drivers” (concept presented on the figure above) are factors that guide workload, being these factors can be external (coming from the environment) or internal (skill or motivation). To deal with the “drivers” and workload while performing an action, the operator starts developing strategies: the more experienced is the operator, the more strategies he can adapt. Finally the human performance is the result of the interaction between the “drivers” on workload and the strategies that are used to cope with
Workload Drivers
Strategies
System Performance
Performance
workload. The human performance will be the input for the system performance and the system performance will influence the drivers. It is very hard to determine how workload increases and decreases because humans are very effective when it they need to develop strategies to cope with the demand: for this reason, it is not always observable the association between task load and mental workload (Parasuraman & Hancock, 2001).
Another approach is defined by Hockey (1997), who developed the compensatory control model, which explains how human operators regulate their performance level at any driving task. The model distinguishes 2 types of levels of control, the first associated with routine regulation and the second with effort-based regulation. The first loop is dealing with keeping the performance level according to the defined goals whereas the second loop monitors the workload involved in achieving the level performance. According to this theory, when the workload achieves a high level (that differs from person to person), the goals can be adapted and a lower level of performance can be accepted by the operator to cope with the given constraints. The opposite is also true: when the workload achieves a low level, the goals can be adapted to increase the workload to an optimum level. Since ADAS reduce drivers workload by automating some of the drivers previous tasks we can think that a driver could accept engaging into secondary tasks as a way to increase his workload to that optimum level.
5.2Distraction
Distraction has been the target of many definitions along time, as a consequence of the impact that this concept has been winning over the years, due to the evolution of the driving context (e.g. more complex driving contexts and more information available on the roads) and the evolution of the vehicles that are equipped with more technological systems (e.g. Intelligent Transportation Systems). Some of the definitions of distraction are reported below.
Beirness, Simpson and Desmond (2002) emphasize the need to distinguish inattention from distraction, considering distracted driving as a part of the broader category of driver inattention: the presence of a triggering event or activity distinguishes driver distraction as a subcategory of driver inattention.
environment. She claims that the major reason causing distraction is the fact that humans are “serial, limited capacity processors of information”, who at times do not prioritize well. This is a broader definition of distraction, that includes the concept of being “lost in thought”, and, as well, self-initiated secondary tasks. She also considers driving tasks, like looking in the mirror, that are executed in an inappropriate moment. Hedlund, Simpson, & Mayhew (2006) published this definition of distraction that has been agreed during the First International Conference on Distracted Driving in 2005: Distraction involves a diversion of attention from driving, because the driver is
temporarily focusing on an object, person, task, or event not related to driving, which reduces the driver’s awareness, decision-making, and/or performance, leading to an increased risk of corrective actions, near-crashes, or crashes.
In the context of this thesis, the concept of distraction is relevant because if the driver is underloaded while using speed regulating systems, it is possible that he/she will try to engage in other activities (physical or cognitive), which might distract him.
5.3Poor SA
To maintain an appropriate level of SA while driving is already a challenge for the driver so that the introduction of automation might further worsen the human’s ability to build a SA adequate to the task. Automation, in general, can have a detrimental impact in SA, and those impacts can be the following (Endsley, Bolté and Jones, 2003): (1) out-of-the–loop syndrome - when automation reduces drivers’ ability to detect systems’ failures or problems and to understand the state of the system sufficiently to allow them to take over operations manually; (2) automation understanding problem - when the operators frequently misunderstand what the system is doing and why is doing it which is necessary to comprehend and build a projection of the situation (Levels 2 and 3 from SA); (3) decision support dilemma- caused by tendency of decision-aiding automation to interact with attention and information evaluation processes in such a way as to diminish their intended effectiveness. The out-of-the-loop syndrome is the most relevant issue to focus on because, when automation fails or an unexpected situation happens, the operator (in this case the driver) has to be able to detect the problem and take over the task manually.
The loss of SA occurs through three primary mechanisms (Endsley & Kiris, 1995): 1. Changes in vigilance and complacency associated with monitoring;
2. Assumption of a passive role instead of an active role in processing information for controlling the system;
3. Changes in the quality or form of feedback provided to the human operator. As an example of loss of SA during the driving assisted with cruise control, it is possible to think to the following situation: a person has been driving in the highway with the cruise control activated for the last hour. Suddenly the car traveling on the left lane, moves to the right lane, in front of the vehicle equipped with cruise control. In this context, if the driver is not vigilant enough, an accident might occur due to the high amount of time taken by the driver to react to the new situation. In this case, the absence of relevant events during the driving with the cruise control activated, might deteriorate the SA of the driver and, this conflict situation might end up in an accident, due to the excessive time spent by the driver to take again the control of the vehicle. This loss of SA is also related with mental workload model, above presented (and, notably, this is an example of driver’s underload).
5.4Fatigue
Fatigue is one of the critical concerns to be considered during the performance of a task; in transportation, fatigue is particularly important, since, sometimes, it is the cause of accidents.
The concept of fatigue has been hard to define through the years because it is a multidimensional state that can only be perceived by the individual that is experiencing it (Desmond & Hancock, 2001). Fatigue is the consequence of several factors, and, among them, information rate (the temporal frequency of information assimilation) and information structure (the spatial variation of information presentation) are considered the main ones. These factors are related to characteristics of the environmental stimulation but also are inextricably linked to the endogenous characteristics of the performer (Desmond & Hancock, 2001).
Chapter 6. Drivers’ variability
6.1Age and driving
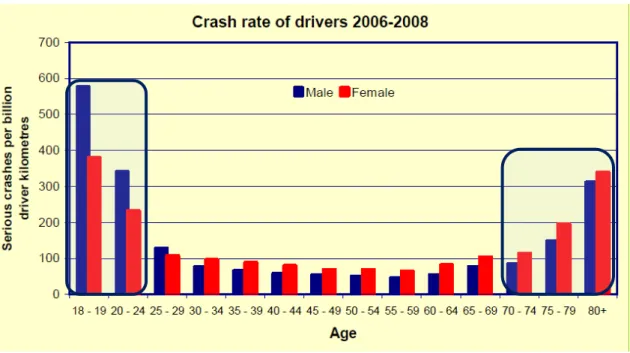
With respect to age, young and older drivers are the two age groups which deserve more attention for what concerns road safety. Even though these two groups have different characteristics (e.g., lifestyle, habits, etc.), they share one negative feature related to the driving task, that is the high rates of fatalities (Figure 13).
Figure 13. Number of crashes with fatalities or in-patients per billion driven kilometers for age
groups (2006-2008) (SWOV, 2010).
The characteristics of both groups (young and older drivers) will be further presented in the next sections.
6.1.1 Young Drivers
Young drivers (18-24 years old) have a high risk of being involved in a serious road crash (with at least one fatality or in-patient): their risk is more than four times higher compared to the drivers in the age range 30-59 years old (OECD, 2006).
driving licensing age increases, indicating that the age factor plays a central role in causing crashes: physical and emotional immaturity, as well as the lifestyles associated with youth can increase crash risk and severity. For example, young people’s life is often intensely social, usually driving at night and on weekends, in groups, and sometimes, after consuming alcohol and/or drugs (OCDE, 2006). The experience is crucial to acquire competence in driving: with experience, actions like changing gears, looking in the rear-view mirror, steering, correctly assessing situations and reacting appropriately to critical situations become automated. Being the novice driver new to the driving task, these actions require consideration, increasing overall mental workload and possibly distracting attention from the road. Thus, novice drivers’ attention is easily overloaded, and their ability to combine simultaneous actions is relatively poor. At the same time, since serious crashes are relatively rare events, new drivers are not provided with the sort of negative feedback that might induce them to drive more carefully. In addition, they might keep a unsafe behaviour being motivated to arrive at a destination as quickly as possible, or by other factors, such as peer pressure or a desire to “show off” (OCDE, 2006).
Regarding gender, young men drive more than young women, and have more fatal crashes per kilometer driven. This negative performance might be caused by the fact that young males are more prone to risk-taking, sensation-seeking, speeding, rule-breaking behaviour and more likely to over-estimate their driving abilities (OCDE, 2006) compared to their female counterparts.
6.1.2 Elderly Drivers
by age. The ageing process and the natural functional declines change drivers’ ability and it is possible to observe impairments at sensory-motor or cognitive levels (Eby et al., 1998). The most common natural functional declines that accompany the ageing process and that might affect the driving performance are:
a decline in various visual capabilities such as acuity of vision, peripheral vision, perception of depth and motion, and contrast sensitivity;
a decline in the capacity to distinguish relevant from irrelevant information (selective attention);
a decline in the capacity to divide attention between several tasks (divided attention);
a slower perception-reaction time;
reduced flexibility of neck and torso;
a decrease in muscle strength;
slowing of the movements;
a decrease of fine motor coordination;
reduced capability to adapt to sudden changes of bodily position (SWOV, 2008). Notably, some complex driving situations that demand a rapid series of decisions can be particularly problematic for some elderly once it was already reported that cognitive deficits can be linked to safety (McKnight & McKnight, 1999). Findings suggest that elderly drivers may not be able to distribute their attention to different stimuli at once as well as younger drivers can, at least not when some of those stimuli are at the center of their visual field and others are in the periphery (Ball, Roenker,& Bruni, 1990). Ball et al. (1990) established the contribution of three attention factors as bases for age-related reduction in the UFOV: reduced speed of visual processing, reduced ability to divide attention and reduced salience of the target against its background.
demands. In addition, cognitive slowing can be compensated at tactical level by driving slower and defensively (Hole, 2007).
Evans (1988) reported that elderly drivers have fewer accidents and commit fewer traffic offences than younger drivers. Apparently, older drivers are safer drivers when compared with younger drivers but we have to take into consideration that most of the studies carried out, don’t take into consideration these group risk exposure, since younger drivers usually drive more than older drivers and do it more during the night period. This could mean that older drivers’ accident risk might be underestimated. It seems that on the contrary of common saying, there are few evidences relating the increase of age with poor driving. Also, few relationships have been found between declines in single functions, poor driving performance and crash risk (ERSO, 2006).
6.2Gender and driving behaviour
Usually, in studies that concern ADAS, gender is not considered as independent variable because differences between males and females are not significant enough. However, in terms of driving behaviour, the differences are very clear: for this reason, it might be interesting to investigate how those differences affect the way is which drivers interact with the systems. Among the various reasons that explain the gender differences in risk taking behaviour while driving, the following ones will be taken into account: aggressive driving, speeding and violation of traffic laws and sensation seeking and risk-taking (Social Issues Research Center, 2004).
6.2.1 Aggressive driving
In 2012, the National Highway Traffic Safety Administration (NHTSA) defined aggressive driving as "when individuals commit a combination of moving traffic offenses so as to endanger other persons or property." Some other working groups define aggressive driving as "the operation of a motor vehicle involving three or more moving violations as part of a single continuous sequence of driving acts, which is likely to endanger any person or property."
probabilities of crashing (SIRC, 2004). Women reported fewer behaviors of this aggressive driving when compared to men (Lajunen & Parker, 2001).
6.2.2 Speeding and violations of traffic laws
Norris, Mathews, & Riad (2000) reported that females were significantly less involved than males in accidents caused by speeding and by veering off road lanes. They also noted that a proportion of the higher accident rates for male drivers could be explained by their greater tendency to disregard speed limits and other traffic rules. Likely, Yagil (1998) conducted a study among university students whose results indicate that females had a stronger sense of obligation to respect traffic laws. Females were also more likely to evaluate traffic laws positively. The observed gender differences were particularly pronounced among young drivers, being young males particularly more likely to evaluate traffic laws negatively and to underestimate the risks associated with traffic violations.
6.2.3 Sensation-seeking and risk-taking
Chapter 7. Research Questions
ADAS are developed with the aim of reducing the mental workload of the driver, this means that these systems should make the driving task easier physically or mentally, using the warnings or the automatic control of some sub-task in terms of driving. Being that the CC and the SL belong to this category of systems, it is expected that they will change the driving task.
The aim of the present research was to identify driver’s perceptions about the effects of the cruise control and the speed limiter in the driving task. Thus, in order to reach this aim, the specific research questions that must be answered are:
1. While using the cruise control and speed limiter, do drivers comply more with the speed limits?
2. Do females adopt slower speeds when using speed regulating systems than males?
3. When using the cruise control and speed limiter, are drivers more prone to engage into secondary tasks?
PART II. METHODOLOGY
The method adopted to gather information about the users and their experiences in the use of in-vehicle technologies was the questionnaire (the online survey was chosen as a method since the information gathered through Internet has revealed to be an advantage to get a bit number of people to answer it and because it is cheaper compared to the application of the questionnaire by hand). The questionnaire was developed in the frame of the INTERACTION project, that belongs to the 7th Framework Programme and it was built based on the results obtained by the Focus Groups sessions carried out in the first work package of the project. The questionnaire was translated in Portuguese and applied by an on-line survey company in Portugal, as well as in other countries where the project took place.
This method also offers a very flexible way of quickly collecting large amounts of specific data from a large population sample (Stanton, Salmon, Walker, Baber, & Jenkin, 2005).
Below, it is reported a list of advantages in applying the questionnaire as a methodological approach (Stanton et al., 2005):
- Questionnaires offer a very flexible way of collecting large volumes of data from large participant samples.
- When properly designed, questionnaires help in the data analysis phase turning it quick and straightforward.
- Few resources (human and monetary) are required once the questionnaire has been designed.
- It is easy to administer to large number of participants.
On the other hand, some disadvantages are also commonly recognized (Stanton et al., 2005):
- Reliability and validity of the questionnaires is questionable. - The answers provided can be rushed and non-committal. - Questionnaires can offer a limited output.
The questionnaire was divided in 7 sections, each one including questions about a certain topic: cruise control, speed limiter, speed alert, navigation system, mobile phone, technologies in general and road safety. The questions concerning the mobile phone, technologies and road safety were applied to everyone, whereas the others were only answered if the respondent was a user, of the system under evaluation (e.g. cruise control or speed limiter).
The same questionnaire was applied in 9 countries, but only the results obtained for the Portuguese drivers will be analyzed in this study. The data was treated using the software SPSS v.20 (Statistical Package for Social Sciences), based on a descriptive statistics analysis. The percentages presented were all pondered to allow eliminating the differences in the sample (e.g. differences in the number of respondents for each section of questions) and comparing the data.
The Pearson Chi-square test was also run to understand if the variables were related. To make it easier to analyze and present the data, 3 age categories were created young drivers (18-24 years), middle-aged drivers (25-54 years) and older drivers (55-74 years). The questionnaire consisted mainly in closed questions (multiple choice, rating scales and ranking) with few open ended questions. The level of measurement of the variables was mainly continuous and categorical.
To complement the results obtained with the questionnaire, more specifically about the perceptions of the effect of speed regulating systems on secondary tasks (like mobile phone use), interviews were carried out with frequent users of speed regulating systems. The choice of interviews to complement the questionnaire was mainly motivated by the fact that this method allows the interviewer to better orient the questions and to make sure that the subjects understand what is asked to him/her.
The interviews that were applied were structured interviews. Structured interviews use a pre-defined questions design to elicit specific information regarding the subject under analysis. The content of the interview (questions and their order) is pre-determined and no scope for further discussion is permitted (Stanton et al., 2005). This type of interviews are more rigidly defined but they were more suitable for the present study, since the information required is very specific.
these three participants was based on the fact that they were using very often speed regulating systems, particularly the CC. The same interview was applied face-to-face to all three participants and in one case the interview was preceded by a self-confrontation moment with the driver. The reason motivating this procedure was that, during the naturalistic driving study this driver interacted some times with the mobile phone and one time with the navigation system while driving with the CC active. The driver was confronted with the videos of those interactions and, after, asked about those particular situations.
PART III. RESULTS
1.1Cruise control results
In the total sample of 1036 respondents, 416 were users of cruise control, of which 125 (30%) were females, 289 (69.5%) were males and 2 didn’t answer the question about the gender (0.5%). In the total sample that answered the questionnaire, like among CC users, the male gender was also overrepresented.
The ages of the CC users ranged from 18 to 73 years old. The mean age was 33.6 years old and the SD was 10.1 years.
Figure 14. Histogram of the age distribution of CC respondents.
Concerning the age groups, the highest percentage of respondents belonged to the middle aged drivers (77%), 17% of the respondents were young drivers and only 6% belonged to the older drivers category (Figure 15).
0 1 2 3 4 5 6 7
18 20 22 24 26 28 30 32 34 36 38 40 42 44 46 48 50 52 54 56 58 60 63 65 69
Per
ce
n
tage
o
f r
e
sp
o
n
ses
Figure 15. Pie chart with the distribution of age categories in the CC user group.
Figure 16 presents the percentage of answers from the sample concerning the years of possession of CC. With replies ranging from 1 to 13 years. The majority of respondents (68.7%) owns the system for less than 5 years.
Figure 16. Number of years of possession of CC.
The participants were asked to give their opinions about the main benefits of the CC: they were asked to order the 3 most important benefits according to their opinion (Figure 17). As it can be seen, as most important benefit of CC drivers mostly mentioned the fact that it improves the comfort of driving (38.5% of the answers).
6%
77% 17%
Age categories fo CC users
Older Middle aged Young 14.4 17.8 13.5
11.5 11.5
5
3.8 3.6
1.2 1.9 0.5 0.7 0.2
14.2 0 2 4 6 8 10 12 14 16 18 20
1 2 3 4 5 6 7 8 9 10 11 12 13 N/A
Per ce n tage o f r e sp o n ses