Objective: To systematically review the literature to verify the validity of ield‑tests to evaluate cardiorespiratory itness (CRF) in children and adolescents.
Data sources: The electronic search was conducted in the databases: Medline (PubMed), SPORTDiscus, Scopus, Web of Science, in addition to the Latin American databases LILACS and SciELO. The search comprised the period from the inception of each database until February 2015, in English and Portuguese. All stages of the process were performed in accordance with the PRISMA low diagram.
Data synthesis: After conirming the inclusion criteria, eligibility, and quality of the studies, 43 studies were analyzed in full; 38 obtained through the searches in the electronic databases, and 5 through private libraries, and references from other articles. Of the total studies, only 13 were considered high quality according to the adopted criteria. The most commonly investigated test in the literature was the 20‑meter shuttle run (SR‑20 m), accounting for 23 studies, followed by tests of distances between 550 meters and 1 mile, in 9 studies, timed tests of 6, 9, and 12 minutes, also 9 studies, and inally bench protocols and new test proposals represented in 7 studies.
Conclusions: The SR‑20‑m test seems to be the most appropriate to evaluate the CRF of young people with the equation of Barnett, recommended to estimate VO2 peak. As an alternative for evaluating CRF, the 1‑mile test is indicated with the equation proposed by Cureton for estimating VO2 peak.
Keywords: reliability; physical itness; youth; systematic review.
Objetivo: Revisar sistematicamente a literatura para veriicar a validade dos testes de campo para avaliação da aptidão cardiorrespiratória (ACR) em crianças e adolescentes.
Fontes de dados: Foram utilizadas as bases de dados: Medline (PUBMED), SPORTDiscus, Scopus, Web of Science, além das bases latino‑americanas LILACS e SciELO. A busca compreendeu todo o período de existência das bases até fevereiro de 2015, em idioma inglês e português. Todas as etapas do processo foram previstas de acordo com o PRISMA.
Síntese dos dados: Após veriicação dos critérios de inclusão, elegibilidade e qualidade dos estudos, 43 trabalhos foram analisados na íntegra, sendo obtidos 38 por meio da busca nas bases de dados eletrônicas e cinco por meio de biblioteca particular e referências de outros artigos. Do total dos artigos, apenas 13 foram considerados de alta qualidade segundo os critérios adotados. O teste mais investigado na literatura foi o
shuttle run de 20 metros (SR‑20 m), contabilizando 23 trabalhos, seguido pelos testes de distâncias entre 550 metros e 1 milha com 9 estudos, os testes com tempos de 6, 9 e 12 minutos também com 9 estudos e, por im, os protocolos de banco e novas propostas de teste representados por 7 trabalhos.
Conclusões: O teste SR‑20 m parece ser o mais apropriado para avaliação da ACR de jovens, com a equação de Barnett, recomendada para estimativa do VO2pico. Como segunda alternativa para avaliação da ACR, indica‑se o teste de 1 milha e, a equação proposta por Cureton, para estimativa do VO2pico.
Palavras‑chave: coniabilidade; aptidão física; jovens; revisão sistemática.
ABSTRACT
RESUMO
*Corresponding author. E‑mail: [email protected] (M. B. Batista).
aStudy and Research Group in Physical Activity and Exercise, Universidade Estadual de Londrina (UEL), Londrina, PR, Brazil. bDepartment of Physical Education, School of Education, University of Cádiz, Puerto Real, Spain.
cDepartment of Physical Education. Study and Research Group in Physical Activity and Exercise, UEL, Londrina, PR, Brazil.
Validity of field tests to estimate
cardiorespiratory fitness in children
and adolescents: a systematic reView
Validade de testes de campo para estimativa da aptidão
cardiorrespiratória em crianças e adolescentes: uma revisão sistemática
Mariana Biagi Batista
a, Catiana Leila Possamai Romanzini
a,*,
INTRODUCTION
Physical itness, in general, refers to a series of physical char-acteristics that are directly related to the ability of an individ-ual to perform physical activity and/or exercise.1 In this sense,
among its components, great emphasis has been given to car-diorespiratory itness (CRF), also known as aerobic itness or maximal aerobic power.2
CRF is currently considered an important marker of health in both adults3,4 and young people.1,5 Children and
adoles-cents who present high values of cardiopulmonary indica-tors tend to present decreased risk facindica-tors for cardiovascular diseases such as obesity, high blood pressure, dyslipidemia, and insulin resistance, among others.6 In addition,
prospec-tive studies have indicated that high CRF during childhood and adolescence is associated with a healthy cardiovascular proile in adulthood.7
With regard to the assessment of CRF indicators, peak oxygen consumption (VO2 peak) is widely recognized as one of the best indices to measure aerobic power in young people.2 VO
2 peak can be measured objectively and
reli-ably in the laboratory, through direct analysis of the gases involved in pulmonary ventilation, while performing pro-gressive and maximal tests on various ergometers. However, due to the high cost, use of sophisticated equipment, need for trained evaluators to administer the tests, and high time demand for each evaluation, its use becomes limited in environments such as schools, sports clubs, and popu-lation-based studies.8
hus, application-based ield tests, which provide the prediction of VO2 peak using mathematical models, are becoming an interesting alternative for the evaluation of CRF, since they demonstrate important advantages, such as low operating costs, ease of application and access to test locations, and the opportunity to evaluate a large number of subjects simultaneously.9 On the other hand, ield tests
for evaluating CRF use indirect methods to estimate VO2 peak and thus can present considerable measurement errors. herefore, for a ield test to be considered appropriate it should have good “validity”, i.e., produce good measures of the variable that it purports to measure. hus, when choos-ing a ield protocol from those proposed in the literature to evaluate CRF, it is important to check whether it is valid for the desired population.
Two decades after the irst initiative which summarized the criteria related to the validity of the various ield tests for the evaluation of physical itness in young people, Castro-Piñero et al.8 proposed a more detailed and systematic way, taking into
consideration the diferent levels of evidence for the validity of the various ield tests, according to the established quality
criteria for the studies analyzed. hus, given the great speed in the production of current scientiic literature showing new validity evidence, especially in childhood and adolescence, as this is an important phase for the detection of health hazards and the promotion of interventions for health issues, this type of study becomes necessary.
Given the above, the objective of this study was to system-atically review the literature to verify the validity of ield tests and to evaluate CRF in children and adolescents.
METHOD
We systematically reviewed the literature using Medline (PUBMED), SPORTDiscus, Scopus, Web of Science, in addi-tion to the Latin American databases, LILACS, and SciELO. he search comprised the period from the inception of each database until February 2015, in English and Portuguese. We opted to use only these two languages because the main studies were available in English, and we included Portuguese for our interest to provide this information.
he search strategy included the following keywords: validation studies, oxygen consumption, child, and ado-lescents. In the speciic case of the Latin American data-bases, LILACS, and SciELO, similar key words were used because these databases have a limit for the search, and/or no records were found when we used many descriptors with Boolean operators.
he eligibility criteria of the articles were the main objective of the investigation being to test the validity of one or more ield tests to estimate CRF and the investigated population being children and/or adolescents considered healthy, i.e., without any diagnosed condition or any problems that prevented the realization of motor tests and non-athletes.
All stages of the process were performed in accordance with the PRISMA lowdiagram10 (Figure 1) and the selection and
analysis of the studies were conducted independently by two researchers (MBB and CLPR) and, in case of disagreement, a third researcher (ERVR) was invited to determine the inclu-sion or excluinclu-sion of studies.
he abstracts were then read for more speciic analysis of the criteria, for inclusion and exclusion of studies that had raised doubts during title analysis. 105 studies were excluded, as they did not meet the eligibility criteria, leaving 69 papers for the next stage. So, 25 other articles were excluded due to other reasons, leaving on the whole 44 papers.
he quality analysis was adapted from Castro-Piñero et al.8, and took into account three items in the studies: the
number of subjects, the description of the sample, and the statistical analysis. In each of these items, the paper could
receive a score between0 and 2 points, and at the end of the analysis, it was awarded a classiication according to the sum of the points of each item. An adaptation of the score for the quality classiication was made and categorized as: low (0-2 points), moderate (3-4 points) or high quality (5-6 points). After this evaluation, six articles were excluded due to low methodological quality.
It is worth mentioning that through analysis of the quality of the studies included in this systematic review, it was possible to establish levels of evidence as to the validity
Figure 1 Flow Diagram of the article selection process.
Identiication
Records identiied by searching in the databases (n=3197)
PubMed (n=968); Web of Science (n=349); Scopus (n=1,314); SportDiscus (n=321);
SciELO (n=53); Lilacs (n=192)
Records excluded by the title (n=2287)
Full texts evaluated for eligibility (n=69)
Texts included in the qualitative synthesis (n=43)
Additional records identiied from other sources
(n=05)
Records excluded by the summary (n=105)
Articles outside the inclusion criteria
Full texts excluded for various reasons (n=31)
Articles in another language; not with young people, review articles;
individuals were athletes; not ield testing and low quality articles Records removed
after verifying duplication (n=736)
Clean up of search
Eligibility
of the study protocols. As a standard strong evidence was attributed to testing protocols considered valid by 3 or more high-quality studies; moderate evidence was assigned to tests validated by 2 high-quality or 3 or more moderate quality studies, and limited evidence was attributed to tests vali-dated by multiple low quality studies, inconsistent results of several studies independent of the quality, or the results of a single study.
RESULTS
he study selection process is exposed in Figure 1. he prelimi-nary search yielded 3,197 articles, 968 in the Medline database (PUBMED), 349 in Web of Science, 1,314 in Scopus, 321 in Sport Discus, 53 in SciELO and 192 in Lilacs.
After analyzing the inclusion criteria and eligibility, a total of 3,153 studies were excluded up to this stage of the process. Further, the studies were classified according to the quality criteria. his procedure was adopted to ensure that only papers which had, at least a moderate methodolog-ical quality, were included, and therefore allowed at the end of the systematic review process levels of evidence, to validate the identiication of the analyzed ield tests.8 Furthermore, as
Latin America databases were included in the search, we use the moderate evidence since some tests that are widely used in Brazil, for example 9 minute run/walk test, did not have any evidence validation.
Finally, 43 original articles were analyzed in full. Of the studies included in the review, 13 were considered high quality11-23 (Tables 1 and 2), and 30 as moderate quality
(Tables 3 and 4).24-53
20 m shuttle run test (sr‑20 m)
Of a total of 23 studies that investigated the validity of the SR-20 m test, some sought to develop equations to estimate
VO2peak12,14,19,25,31,34,38,43,47,53 including their regression
mod-els variables such as gender, age, speed obtained in the inal stage of the test, number of turns, body weight, height, skin-fold thickness, and body mass index (BMI), among others. he studies used linear mathematical and quadratic mod-els and those based on artiicial neural networks (ANN). heir results demonstrated correlation coeicient values between the VO2peak values from the new equation and those produced by the standard method ranging from r=0.65 to r=0.86, coeicients of determination between R2=0.68 and
R2=0.85 and, standard error of estimates (SEE) from 2.4 to
7.0 mL/kg/min.
In addition, several studies carried out cross-validation of equations available in the literature, among which the most
investigated was originally proposed by Léger et al.25 , and
ana-lyzed in all the papers with this objective.13,17-20,23,28,29,35,40,47,53
Other equations were also studied for validity, such as those created by Barnett et al.,31,17-20,23,47, Fernhall et al.,54,18,40,
Ruiz et al.,14,17,19, Matsuzaka et al.,12,17,18,20,47 , Mahar et al.,43,20,47
, and Kuipers et al.55,23
However, in addition to determining the VO2 peak from the SR-20-m test, a simpler alternative and one widely used by professionals is the veriication only of the parameters achieved in the test, such as the number of turns (back-and-forth) and the speed reached in the inal stage of the test. In this sense, few studies had the objective of performing only the ratio of the VO2 peak evaluated in a direct manner in the laboratory, and the results in the SR-20-m test.24,26,28-30,35
he results demonstrated correlation coeicient values rang-ing from r=0.51 to 0.93.
run and/or walk test
over distances of 550 meters to 1 mile
As a result of the systematic literature review, nine studies were found that investigated the validity of ield tests to esti-mate CRF, with distances ranging from 550 meters running,52
0.5-mile run/walk,15 1-mile run/walk,16,27,28,33,37 1 mile walk,36
and 1-mile submaximal test.11 he results of these studies
pre-sented correlation coeicients ranging from r=0.59 to -0.83; coeicients of determination of R2=0.42 to 0.84, and
stan-dard error of estimates between SEE=3.26 mL/kg/min and 4.99 mL/kg/min.
In the case of the 1-mile run/walk test, some authors suggested equations for determining the VO2 max, such as, Buono et al.,27 , who obtained a coeicient of determination
of R2=0.84 and standard error of estimate of 4.3 mL/kg/min
or 9% for the proposed equation. Subsequently, Cureton et al.33 , proposed a generalized equation for individuals
from 8 to 25 years of age, which considers information on total test time, age, sex, and BMI, and presented good validation values (r=0.72 and standard error of estimate of 4.8 mL/kg/min).
run/walk tests of 6, 9, and 12 minutes
Nine of the studies analyzed investigated field protocols for evaluation of CRF with predetermined times, using a 6-walk,42,45,51 6-minute run,24 9-minute run/walk22,32,39,49 and
12-minute run/walk.39,53
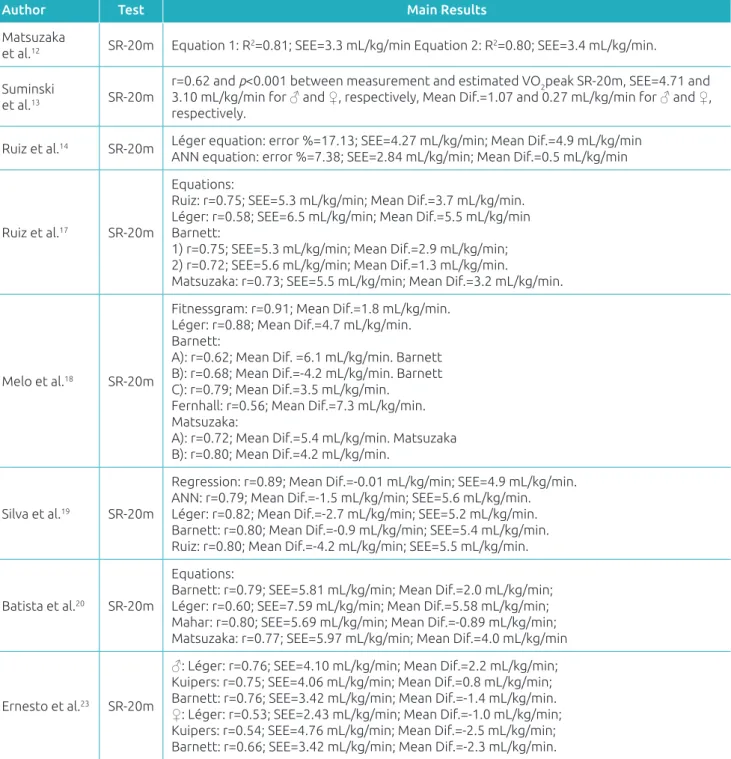
Table 1 Summary of studies classiied as high quality, aimed at validating SR‑20m test for estimating cardiorespiratory itness in children and adolescents.
Author Test Main Results
Matsuzaka
et al.12 SR‑20m Equation 1: R2=0.81; SEE=3.3 mL/kg/min Equation 2: R2=0.80; SEE=3.4 mL/kg/min.
Suminski
et al.13 SR‑20m
r=0.62 and p<0.001 between measurement and estimated VO2peak SR‑20m, SEE=4.71 and 3.10 mL/kg/min for ♂ and ♀, respectively, Mean Dif.=1.07 and 0.27 mL/kg/min for ♂ and ♀, respectively.
Ruiz et al.14 SR‑20m Léger equation: error %=17.13; SEE=4.27 mL/kg/min; Mean Dif.=4.9 mL/kg/min
ANN equation: error %=7.38; SEE=2.84 mL/kg/min; Mean Dif.=0.5 mL/kg/min
Ruiz et al.17 SR‑20m
Equations:
Ruiz: r=0.75; SEE=5.3 mL/kg/min; Mean Dif.=3.7 mL/kg/min. Léger: r=0.58; SEE=6.5 mL/kg/min; Mean Dif.=5.5 mL/kg/min Barnett:
1) r=0.75; SEE=5.3 mL/kg/min; Mean Dif.=2.9 mL/kg/min; 2) r=0.72; SEE=5.6 mL/kg/min; Mean Dif.=1.3 mL/kg/min.
Matsuzaka: r=0.73; SEE=5.5 mL/kg/min; Mean Dif.=3.2 mL/kg/min.
Melo et al.18 SR‑20m
Fitnessgram: r=0.91; Mean Dif.=1.8 mL/kg/min. Léger: r=0.88; Mean Dif.=4.7 mL/kg/min. Barnett:
A): r=0.62; Mean Dif. =6.1 mL/kg/min. Barnett B): r=0.68; Mean Dif.=‑4.2 mL/kg/min. Barnett C): r=0.79; Mean Dif.=3.5 mL/kg/min.
Fernhall: r=0.56; Mean Dif.=7.3 mL/kg/min. Matsuzaka:
A): r=0.72; Mean Dif.=5.4 mL/kg/min. Matsuzaka B): r=0.80; Mean Dif.=4.2 mL/kg/min.
Silva et al.19 SR‑20m
Regression: r=0.89; Mean Dif.=‑0.01 mL/kg/min; SEE=4.9 mL/kg/min. ANN: r=0.79; Mean Dif.=‑1.5 mL/kg/min; SEE=5.6 mL/kg/min. Léger: r=0.82; Mean Dif.=‑2.7 mL/kg/min; SEE=5.2 mL/kg/min. Barnett: r=0.80; Mean Dif.=‑0.9 mL/kg/min; SEE=5.4 mL/kg/min. Ruiz: r=0.80; Mean Dif.=‑4.2 mL/kg/min; SEE=5.5 mL/kg/min.
Batista et al.20 SR‑20m
Equations:
Barnett: r=0.79; SEE=5.81 mL/kg/min; Mean Dif.=2.0 mL/kg/min; Léger: r=0.60; SEE=7.59 mL/kg/min; Mean Dif.=5.58 mL/kg/min; Mahar: r=0.80; SEE=5.69 mL/kg/min; Mean Dif.=‑0.89 mL/kg/min; Matsuzaka: r=0.77; SEE=5.97 mL/kg/min; Mean Dif.=4.0 mL/kg/min
Ernesto et al.23 SR‑20m
♂: Léger: r=0.76; SEE=4.10 mL/kg/min; Mean Dif.=2.2 mL/kg/min; Kuipers: r=0.75; SEE=4.06 mL/kg/min; Mean Dif.=0.8 mL/kg/min; Barnett: r=0.76; SEE=3.42 mL/kg/min; Mean Dif.=‑1.4 mL/kg/min. ♀: Léger: r=0.53; SEE=2.43 mL/kg/min; Mean Dif.=‑1.0 mL/kg/min; Kuipers: r=0.54; SEE=4.76 mL/kg/min; Mean Dif.=‑2.5 mL/kg/min; Barnett: r=0.66; SEE=3.42 mL/kg/min; Mean Dif.=‑2.3 mL/kg/min.
♂ = boys; ♀ = girls; CRF: cardiorespiratory itness; Mean Dif.: mean diferences; VO2max or VO2peak: maximum oxygen consumption determined by the gold standard measure; r: correlation coeicient; R2: coeicient of explanation; SEE: standard error of estimate; mL/kg/min: relative values of oxygen consumption in milliliters per kilogram of body weight per minute; SR‑20m: shuttle run test of 20 meters; ANN: mathematical model based on artiicial neural network.
VO2 peak.24,42,45,51 In the case of the test with a time of
9 min-utes, the relationship between distance covered in the test and VO2peak was between r=0.43 and 0.71,32,39,49 , with a
pro-posed initiative for a prediction equation for VO2 peak using information on the distance covered in the test, biological
maturation, sum of skinfolds, and sex, present in validation results of r=0.57, a mean diference of -1.4 mL/kg/min and SE=8.39 mL/kg/min.22
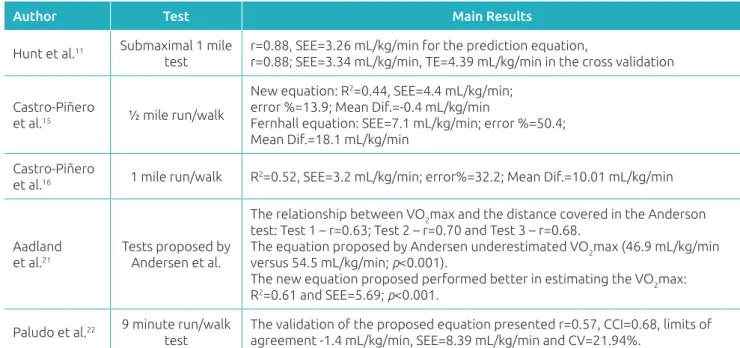
Table 2 Summary of studies classiied as high quality, aimed at validating other tests for estimating cardiorespiratory itness in children and adolescents.
Author Test Main Results
Hunt et al.11 Submaximal 1 mile
test
r=0.88, SEE=3.26 mL/kg/min for the prediction equation,
r=0.88; SEE=3.34 mL/kg/min, TE=4.39 mL/kg/min in the cross validation
Castro‑Piñero
et al.15 ½ mile run/walk
New equation: R2=0.44, SEE=4.4 mL/kg/min;
error %=13.9; Mean Dif.=‑0.4 mL/kg/min
Fernhall equation: SEE=7.1 mL/kg/min; error %=50.4; Mean Dif.=18.1 mL/kg/min
Castro‑Piñero
et al.16 1 mile run/walk R2=0.52, SEE=3.2 mL/kg/min; error%=32.2; Mean Dif.=10.01 mL/kg/min
Aadland et al.21
Tests proposed by Andersen et al.
The relationship between VO2max and the distance covered in the Anderson test: Test 1 – r=0.63; Test 2 – r=0.70 and Test 3 – r=0.68.
The equation proposed by Andersen underestimated VO2max (46.9 mL/kg/min versus 54.5 mL/kg/min; p<0.001).
The new equation proposed performed better in estimating the VO2max: R2=0.61 and SEE=5.69; p<0.001.
Paludo et al.22 9 minute run/walk
test
The validation of the proposed equation presented r=0.57, CCI=0.68, limits of agreement ‑1.4 mL/kg/min, SEE=8.39 mL/kg/min and CV=21.94%.
♂ = boys; ♀ = girls; CRF: cardiorespiratory itness; Mean Dif.: mean diferences; VO2 max or VO2 peak: maximum oxygen consumption determined by the gold standard measure; r: correlation coeicient; R2: coeicient of explanation; SEE: standard error of estimate; TE: total error; mL/ kg/min: relative values of oxygen consumption in milliliters per kilogram of body weight per minute; CCI: conidence interval; CV: coeicient of variation.
1968, presented correlation coeicients between the distance covered in the test, and VO2 peak evaluated in a laboratory of between r=0.70 and r=0.82,39,53 with a proposed equation to
estimate VO2peak, but only in obese adolescents.53
maximal and submaximal
bench tests or other protocols
Four studies were identiied which sought to validate bench protocols, so as to estimate CRF.27,38,41,46 In these studies, the
tests had a duration of three minutes at diferent rhythms and paces. he relationship between the test results and the esti-mated VO2 peak measured directly, ranged from r=0.48 to 0.78.27,41 Two studies proposed equations to estimate VO
2 peak
using the bench test, with results of r=0.77 to 0.84 and SEE between 6.0 and 7.0 mL/kg/min.38,46
In addition, three papers were found dealing with a ield test protocol to evaluate the CRF proposed by Andersen et al.44
his test was initially proposed for young people aged 9 to 11 years, adolescent athletes between 14 and 15 years, and uni-versity students aged between 20 and 27 years. It has a duration of 10 minutes and is performed in a space delimited by two par-allel lines, 20 meters from one another. he subject is required to run from one line to the other at intervals of 15 seconds running and 15 seconds resting, to complete the longest pos-sible distance by the end of 10 minutes. he authors validated
the test (r=0.68), and also proposed a prediction equation for VO2 peak which considered the maximum distance achieved in the test in meters, and sex (r=0.84).44
Subsequently, two studies have attempted to validate the test of Andersen et al.,44 , as well as proposing a new
predic-tion equapredic-tion for VO2 peak, in other samples with ages rang-ing from 6 to 10 years.21,48 . he validity results were
consid-ered satisfactory (r=0.63 to 0.73) and the proposed equation performed better than the original (R2=0.61 a R2=0.85;
SEE=5.59 mL/kg/min).21
DISCUSSION
After verifying the inclusion criteria, eligibility, and quality, 43 studies were analyzed in full. Of the total papers analyzed, 13 were considered of high quality and 30 were considered with moderate quality (Tables 1 to 4), according to the adopted cri-teria.8 he most commonly investigated test in the literature was
the SR-20 m, accounting for 23 papers (Table 1 and 3),12-14,17-20,
23-26,28-31,34,35,40,43,47,50,52,53 which veriied their validity and were
included in the review, followed by tests of distances between 550 meters and 1 mile with 9 studies,11,15,16,27,28,33,36,37,52 timed
tests of 6, 9 and 12 minutes also with 9 studies22,24,32,39,42,45,49,51,53
Table 3 Summary of studies classified as moderate quality, aimed at validating SR‑20m test for estimating cardiorespiratory itness in children and adolescents.
Author Test Main Results
Van Mechelen
et al.24 SR‑20m The relationship between SR‑20m and VO2 peak was r=0,68 for ♂, r=0,69 for ♀
Léger et al.25 SR‑20m r=0.71.
Boreham
et al.26 SR‑20m r=0.87 between SR‑20m and VO2máx.
Anderson28 SR‑20m r=0.72 between SR‑20m and VO2máx; diference between predicted VO2máx SR‑20m
and VO2máx, EM 1.3 mL/kg/min.
Liu et al.29 SR‑20m
r=0.65 between VO2peak and number of turns in ♂; r=0.51 between VO2peak and number of turns in ♀; r=0.72 between VO2peak and predicted VO2peak SR‑20m, no signiicant diference, SEE=5.27 mL/kg/min.
Mahoney30 SR‑20m r=0.83 between VO2peak and numbers of turns in ♂; r=0.76 between VO2peak and
numbers of turns in ♀.
Barnett et al.31 SR‑20m
r=0.72 between VO2peak and Léger equation; r=0.74; SEE=4.6 mL/kg/min between VO2peak and max velocity in SR‑20m.
Equation 1: r=0.85, SEE=3.7 mL/kg/min. Equation 2: r=0.84, SEE=3.7 mL/kg/min. Equation 3: r=0.82; SEE=4.0 mL/kg/min.
McVeigh
et al.34 SR‑20m
r=0.78 between VO2peak and max velocity in SR‑20m ♂; r=0.79 between VO2peak and
max velocity in SR‑20m; R2=0.68; SEE=3.23 mL/kg/min in ♂; R2=0.85; SEE=2.4 mL/kg/min
in ♀.
Mc Naughton et al.35
SR‑20m European;
SR‑20m Canadian
r=0.93 between VO2máx and VE; r=0.87 between VO2máx and VC; VE and VC were diferent of VO2máx, underestimating in VE=7.7% and overestimating in VC=11.4%.
Pitetti et al.40 SR‑20m r=0.78 between Fernhall and Léger equations. r=0.67; SEE=5.8 mL/kg/min (Fernhall);
r=0.61; SEE=6.1 mL/kg/min (Léger)
Mahar et al.43 SR‑20m/
PACER
r=0.65, SEE=6.38 mL/kg/min equation model; r=0.54, SEE=6.67 mL/kg/min between MS and PR VO2 peak with Léger.
Mahar et al.47 SR‑20m
Quadratic model: r=0.73; SEE=6.39 mL/kg/min; Linear model 2: r=0.71; SEE=6.61 mL/ kg/min; Léger: r=0.58; SEE=7.63 mL/kg/min; Mean Dif.=5.58 mL/kg/min; Mahar: r=0.69; SEE=6.81 mL/kg/min; Barnett A): r=0.66; SEE=7.06 mL/kg/min; Barnett B): r=0.64; SEE=7.20 mL/kg/min; Matsuzaka A): r=0.66; SEE=7.02 mL/kg/min; Matsuzaka B): r=0.65; SEE=7.14 mL/kg/min.
Scott et al.50 SR‑20m/
PACER Comparing the measured and estimated values: r=0.87; Mean Dif.: ‑0.9and SEE= 1.4 mL/kg/min. ±5.1 mL/kg/min
Hamlin et al.52 SR‑20m Correlation for total sample: SR‑20m: r=0.70; Adjusted (body mass; maturation): SR‑20m:
r=0.73; R2=0.535 and SEE=0,47%
Quinart et al.53 SR‑20m
(AD)
SR‑20m (AD) (Léger): Mean Dif.: ‑3.30 mL/kg/min. Newly equations: SR‑20m (AD): R2=0.77; Mean Dif.: 0.01 mL/kg/min.
Table 4 Summary of studies classified as moderate quality, aimed at validating other tests for estimating cardiorespiratory itness in children and adolescents.
Author Test Main Results
Van Mechelen
et al.24 6 minute walk test
The relationship is 0.76 for the total sample.6 min run test and VO2 peak was r=0.51 for ♂, r=0.45 for ♀ and 0.63.
Buono et al.27 1 mile run/walk;
Bench test r=‑0.73 between 1 mile and VO2 máx; r=0.48 between bench and VO2máx.
Anderson 28 1600 min. run test r=‑0.83 between time of run 1,600 m and VO 2 máx
Turley et al. 32 9 min. run/walk test The relationship for tests and VO2 peak (by cycle ergometer), respectively: ♂
r=0.65 and r=0.71; ♀ r=0.56 and r=0.48.
Cureton
et al.33 1 mile run/walk
r=0.71; SEE=4.8 mL/kg/min for prediction equation; r=0.72; SEE=4.8 mL/kg/ min in cross validation.
McSwegin
et al.36 1 mile run/walk
r=0.84; SEE=4.50 mL/kg/min; EM=7.16 mL/kg/min; %E=38.6 for Dolgener equation;
r=0.80; SEE=4.99 mL/kg/min; EM=5.17 mL/kg/min; %E=65.9 for Kline equation.
Rowland
et al.37 1 mile run/walk r=0.77 between VO2máx and run velocity.
Garcia et al. 38 CAFT; Bench test Model equation (4 skinfold) was more accurate. ♂: r=0.83, SEE=6.0 mL/kg/
min; ♀: r=0.77, SEE=7.0 mL/kg/min.
Drinkard
et al.39 9/12‑min. run/walk
r=0.63 between VO2máx and distance covered in 9 min; r=0.72 between VO2máx and distance covered in 12 min.
Hui; Cheung41 3‑min. step test 3
cadences r=0.76; r=0.78 and r=0.72 between the MS and PR VOin cadences 22, 26 e 30 steps per min. 2peak with bench tests
Li et al.42 6‑min. walk test r=0.44 between VO
2máx and distance covered in 6‑min test.
Andersen
et al.44 Tests by Andersen
The distance by test and the VO2máx: r=0.68; After regression equation, VO2máx was r=0.84 for the whole group.
Morinder
et al.45 6 min. walk test
Correlation between distance covered in 6 min. test and measure VO2maxwas r=0.34.
Jacks et al.46 YMCA test 71% variability of measured VO2peak directly. The correlation with MS and PR
VO2 peak with YMCA test was r=0.84.
Ahler et al.48 Tests by Andersen The relationship is VO2máx: r=0.73 (p<0.001); R2=0.53 (p<0.002); Adjusting
(sex; body mass): R2=0.85 (p<0.0002).
Paludo et al.49 9 min. run/walk test Correlation between distance covered in test and measured VO2peak was
r=0.59 for ♂ and r=0.43 for ♀.
Vanhelst
et al.51 6 min. walk test
The relationship between distance covered in 6‑min test and VO2máx was r=0.22 (p=0,026).
Hamlin et al.52 550 meters run For total sample: r=0.59; Adjusted (body mass; maturation): r=0.65, R2=0.418
and SEE=0.55%.
Quinart et al.53 9‑min. run/walk test (Cooper): Mean Dif.: 6.71 mL/kg/min. Newly equations: Walk/run test 12 min.:
R2=0.75; Mean Dif.: ‑0.10 mL/kg/min.
20 m shuttle run test (sr‑20 m)
Our results corroborate those of Castro-Piñero et al.8 who found
strong evidence that the SR-20 m is a valid test to estimate CRF in young people. However, with regard to the development of equations to estimate VO2 peak, some recently published papers complement these results regarding the cross validity of the equations available in the literature.18-20,23,47 In the great
majority of studies, the original equation proposed by Léger et al.25 presented results of lower validity, with a tendency to
underestimate VO2 peak, compared to the models proposed later. However, when the analysis was stratiied according to sex, the equation of Léger et al.25 produced better estimates of
VO2peak for girls.18,20,23
Prominent among the proposed equations were Barnett et al.31, with strong evidence of validity; Matsuzaka et al.12
with moderate evidence of validity; Ruiz et al.14 with
mod-erate evidence of validity and Mahar et al.43,47 also with
mod-erate evidence of validity, despite being recently indicated by the FITNESSGRAM battery to estimate VO2 peak from the SR-20 m test. However, caution is necessary when inter-preting the results of cross-validation of the aforementioned equations, since in most cases, the results were satisfactory in group analyzes when veriied by ANOVA, linear correlation coeicient, and simple linear regression but not at the indi-vidual level through the agreement provided by the analysis of Bland and Altman in 1986, and veriication of measure-ment bias and trend. hus, the researcher should choose the most appropriate equation according to their goal; group or individual analysis.
run/walk test over
distances of 550 meters to 1 mile
Among the protocols that consider pre-established ixed dis-tances, the run/walk test of 1 mile is the most widespread and investigated in the literature, being used in a total of 5 papers that met the inclusion criteria and eligibility of this system-atic review.16,27,28,33,37
Validation research initiatives have used the equation of Cureton et al.33 to estimate VO
2 peak in the 1-mile test and
this fact can be justiied by certain factors, such as it uses vari-ables that are easy to access, and presents less intra and inter appraiser errors in the regression model (total time in the test, gender, age, and BMI), compared with the equation of Buono et al.27, who use the measurement of skinfold thickness in their
model, and is recommended by the FITNESSGRAM battery of tests, to calculate VO2peak when performing the 1-mile test to verify the CRF in young people.
In relation to tests with pre-established distances, there was moderate evidence for the 1-mile run/walk test, and limited
evidence for the 550 meters running, 1 mile walking, 1 mile submaximal, and 0.5 mile run/walk protocols, due to the lack of studies that aimed to validate these tests in young people. he equation proposed by Cureton et al.33 seems to be the
best equation for estimating VO2peak for the 1 mile run/walk test, considering that the level of physical itness of the indi-viduals may inluence the test results. hus, our results are in agreement with those of Castro-Piñero et al.8 , since new
ini-tiatives for validating these test protocols were not identiied in the literature.
run/walk tests for
times of 6, 9, and 12 minutes
In the 6-minute walk test, there was limited evidence of valid-ity with inconsistent results in the studies, which was also demonstrated by the 6-minute running test, with only one study that tested its validity.24. his fact can be explained in
part by the characteristics of the test, such as the duration and type of efort. On the other hand, the 9-minute test presented evidence of validity considered moderate. Four studies investi-gated the validity, and favorable results were obtained (r=0.43 to 0.71).22,32,39,49. Only one initiative to propose and validate
an equation to estimate VO2peak in the 9-minute test was found, but despite the high quality of the paper, classiication of the evidence was not possible due to its representation in only one paper.22
As well as the running and walking 6-minute tests, the 12-minute run/walk test also demonstrated limited evidence of validity in young people, represented by only two moder-ate quality papers that veriied the validity,39,53 with only one
equation proposed to estimate VO2 peak from the 12-minute test.53 herefore, we suggest future initiatives to verify the
valid-ity of the ield protocols of running and/or walking for 6 and 12 minutes, in order to provide more consistent results in the population of children and adolescents.
maximal and submaximal
bench tests and other protocols
Four studies were found which assessed the validity of the bench test; 3 being maximal27,38,41 and one submaximal,46 with similar
and favorable results (r=0.48 to r=0.84). Two proposed equations to estimate VO2 peak from the bench tests were presented,38,46
with results considered valid for estimation of CRF, however, more cross-validation initiatives are still needed for evidence of its use in diferent populations. hus, there is moderate evi-dence of validity for the bench test, but it is noteworthy that the tests featured diferences, according to the protocol used.
he test protocol proposed by Andersen et al.44 was
high quality.21 hus, it was rated moderate evidence of
valid-ity, with no indication for the equation to estimate VO2 peak through the test, due to the limited number of papers that veriied the validity of the original equation and the new pro-posal.21,44 Furthermore, caution should be exercised when using
the test of Andersen et al.,44 since it was designed for a young
sample between 9 and 11 years old, and therefore, even with moderate evidence of validity, needs to be tested on samples of other ages before use.
CONCLUSIONS
Given the results found in this systematic review, we conclude that the SR-20-m test seems to be the most appropriate to eval-uate the CRF of young people, presenting strong evidence of validity. he equation recommended for estimation of VO2 peak from the SR-20-m test is that proposal by Barnett et al.31 with
strong evidence and validity and, as an alternative, the proposals by Mahar et al.43 and Mahar et al.47 due to moderate evidence
of validity, and being recommended by the FITNESSGRAM battery to estimate VO2 peak.
As a possible alternative for the evaluation of CRF, when using the SR-20-m test is impossible, the 1-mile test is indi-cated, which demonstrated moderate evidence of validity, as well as the equation proposed by Cureton et al.33 to
esti-mate VO2peak from the 1-mile test. In addition, the 9-min-ute, bench and Andersen et al.44 tests can be used, which
presented moderate evidence of validity; however, to date, there are no indication of equations to estimate VO2 peak through these tests.
funding
Coordination for the Improvement of Higher Education Personnel (CAPES), Brazil and the National Council for Scientiic and Technological Development (CNPq), Brazil.
conflict of interests
he authors declare no conlict of interests.
REFERENCES
1 Ortega F, Ruiz J, Castillo M, Sjöström M. Physical itness in childhood and adolescence: a powerful marker of health. Int J Obes (Lond). 2008;32:1‑11.
2. Armstrong N. Aerobic itness of children and adolescents. J Pediatr. 2006;82:406‑8.
3. Blair SN, Wei M, Lee CD. Cardiorespiratory itness determined by exercise heart rate as a predictor of mortality in the Aerobics Center Longitudinal Study. J Sports Sci. 1998;16 Suppl:S47‑55.
4. Katzmarzyk PT, Church TS, Blair SN. Cardiorespiratory itness attenuates the efects of the metabolic syndrome on all‑cause and cardiovascular disease mortality in men. Arch Intern Med. 2004;164:1092‑7.
5. Ruiz JR, Huybrechts I, Cuenca‑García M, Artero EG, Labayen I, Meirhaeghe A, et al. Cardiorespiratory itness an ideal carviovascular health in European adolescents. Heart. 2015;101:766‑73.
6. Anderssen SA, Cooper AR, Riddoch C, Sardinha LB, Harro M, Brage S, et al. Low cardiorespiratory itness is a strong predictor for clustering of cardiovascular disease risk factors in children independent of country, age and sex. Eur J Cardiovasc Prev Rehabil. 2007;14:526‑31.
7. Anderson L, Hasselstrøm H, Grønfelt V, Hansen S, Karsten F. The relationship between physical itness and clustered risk from adolescence to young adulthood: eight years follow‑up in the Danish youth and Sport Study. Int J Behav Nutr Phys Act. 2004;1:6.
8. Castro‑Piñero J, Artero EG, España‑Romero V, Ortega FB, Sjöström M, Suni J, et al. Criterion‑related validity of ield‑based itness tests in youth: a systematic review. Br J Sports Med. 2010;44:934‑43.
9. Grant JA, Joseph AN, Campagna PD. The prediction of VO2max: acomparison of 7 indirect tests of aerobic power. J Strength Cond Res. 1999;13:346‑52.
10. Liberati A, Altman DG, Tetzlaf J, Mulrow C, Gøtzsche PC, Ioannidis JP, et al. The PRISMA statement for reporting systematic reviews and meta‑analyses of studies that evaluate healthcare interventions: explanation and elaboration. Ann Intern Med. 2009;151:W65‑94.
11. Hunt BR, George JD, Vehrs PR, Fisher AG, Fellingham GW. Validity of a submaximal 1‑mile track jog test in predicting VO2max in it teenagers. Pediatr Exerc Sci. 2000;12:80‑90. 12. Matsuzaka A, Takahashi Y, Yamazoe M, Kumakura N, Ikeda
A, Wilk B, et al. Validity of the multistage 20‑m shuttle‑run test for Japanese children, adolescents, and adults. Pediatr Exerc Sci. 2004;16:113‑25.
13. Suminski RR, Ryan ND, Poston CS, Jackson AS. Measuring aerobic itness of Hispanic youth 10 to 12 years of age. Int J Sports Med. 2004;25:61‑7.
14. Ruiz JR, Ramirez‑Lechuga J, Ortega FB, Castro‑Piñero J, Benitez JM, Arauzo‑Azofra A, et al. Artificial neural network‑based equation for estimating VO2max from the 20 m shuttle run test in adolescents. Artif Intell Med. 2008;44:233‑45.
15. Castro‑Piñero J, Ortega FB, Mora J, Sjöström M, Ruiz JR. Criterion related validity of 1/2 Mile run‑walk test for estimating VO2peak in children aged 6‑17 years. Int J Sports Med. 2009;30:366‑71.
17. Ruiz JR, Silva G, Oliveira N, Ribeiro JC, Oliveira JF, Mota J. Criterion‑related validity of the 20‑m shuttle run test in youths aged 13‑19 years. J Sports Sci. 2009;27:899‑906. 18. Melo X, Santa‑Clara H, Almeida J, Carnero EA, Sardinha LB,
Bruno PM, et al. Comparing several equations that predict peak VO2 using the 20‑m multistage‑shuttle run‑test in 8‑10‑year‑old children. Eur J Appl Physiol. 2011;111:839‑49. 19. Silva G, Oliveira NL, Aires L, Mota J, Oliveira J, Ribeiro JC.
Calculation and validation of models for estimating VO2max from the 20‑m shuttle run test in children and adolescents. Arch Exerc Health Dis. 2012;3:145‑52.
20. Batista MB, Cyrino ES, Arruda M, Dourado AC, Coelho‑E‑Silva MJ, Ohara D, et al. Validity of equations for estimating VO2peak from the 20‑m shuttle run test in adolescents aged 11‑13 years. J Strength Cond Res. 2013;27:2774‑81. 21. Aadland E, Terum T, Mamen A, Andersen LB, Resaland GK.
The Andersen aerobic itness test: reliability and validity in 10‑year‑old children. PLoS One. 2014;9:e110492.
22. Paludo AC, Batista MB, Gobbo LA, Ronque ER, Petroski EL, Serassuelo Junior H. Development of equations to estimate the VO2peak by the 9‑minute test. Rev Bras Med Esporte. 2014;20:176‑80.
23. Ernesto C, Silva FM, Pereira LA, de Melo GF. Cross validation of diferent equations to predict aerobic itness by the shuttle run 20 meters test in Brazilian students. J Exerc Physiol. 2015;18:46‑55.
24. Van Mechelen W, Hlobil H, Kemper HC. Validation of two running tests as estimates of maximal aerobic power in children. Eur J Appl Physiol Occup Physiol. 1986;55:503‑6. 25. Léger LA, Mercier D, Gadoury C, Lambert J. The multistage
20 metre shuttle run test for aerobic itness. J Sports Sci. 1988;6:93‑101.
26. Boreham CA, Paliczka VJ, Nichols AK. A comparison of the PWC170 and 20‑MST tests of aerobic itness in adolescent schoolchildren. J Sports Med Phys Fitness. 1990;30:19‑23. 27. Buono MJ, Roby JJ, Micale FG, Sallis JF, Shepard WE. Validity
and reliability of predicting maximum oxygen uptake via ield tests in children and adolescents. Pediatr Exerc Sci. 1991;3:250‑5.
28. Anderson GS. The 1600‑m Run and Multistage 20‑m Shuttle Run as Predictive Tests of Aerobic Capacity in Children. Pediatr Exerc Sci. 1992;4:312‑8.
29. Liu NY, Plowman SA, Looney MA. The reliability and validity of the 20‑meter shuttle test in American students 12 to 15 years old. Res Q Exerc Sport. 1992;63:360‑5.
30. Mahoney C. 20‑MST and PWC170 validity in non‑Caucasian children in the UK. Br J Sports Med. 1992;26:45‑7. 31. Barnett A, Chan LY, Bruce IC. A preliminary study of the 20‑m
multistage shuttle run as a predictor of peak VO2 in Hong Kong Chinese students. Pediatr Exerc Sci. 1993;5:42‑50. 32. Turley KR, Wilmore JH, Simons‑Morton B, Williston JM,
Epping JR, Dahlstrom G. The reliability and validity of the 9‑minute run in third‑grade children. Pediatr Exerc Sci. 1994;6:178‑87.
33. Cureton KJ, Sloniger MA, O’Bannon JP, Black DM, McCormack WP. A generalized equation for prediction of VO2peak from 1‑mile run/walk performance. Med Sci Sports Exerc. 1995;27:445‑51.
34. McVeigh SK, Payne AC, Scott S. The reliability and validity of the 20‑meter shuttle test as a predictor of peak oxygen uptake in Edinburgh school children, age 13 to 14 years. PES. 1995;7:69‑79.
35. Naughton LM, Cooley D, Kearney V, Smith S. A comparison of two diferent shuttle run tests for the estimation of VO2max. J Sports Med Phys Fitness. 1996;36:85‑9. 36. McSwegin PJ, Plowman SA, Wolf GM, Guttenberg GL. The
validity of a one‑mile walk test for high school age individuals. Meas Phys Educ Exerc Sci. 1998;2:47.
37. Rowland T, Kline G, Gof D, Martel L, Ferrone L. One‑mile run performance and cardiovascular itness in children. Arch Pediatr Adolesc Med. 1999;153:845‑9.
38. Garcia AW, Zakrajsek JS. Evaluation of the Canadian aerobic itness test with 10‑ to 15‑year‑old children. Pediatr Exerc Sci. 2000;12:300‑11.
39. Drinkard B, McDuie J, McCann S, Uwaifo GI, Nicholson J, Yanovski JA. Relationships between walk/run performance and cardiorespiratory fitness in adolescents who are overweight. Phys Ther. 2001;81:1889‑96.
40. Pitetti KH, Fernhall B, Figoni S. Comparing two regression formulas that predict VO2peak using the 20‑M shuttle run for children and adolescents. Pediatr Exerc Sci. 2002;14:125‑34.
41. Hui SS, Cheung PP. Comparison of the effects of three stepping cadences on the criterion‑related validity of a step test in Chinese children. Meas Phys Educ Exerc Sci. 2004;8:167‑79.
42. Li AM, Yin J, Yu CC, Tsang T, So HK, Wong E, et al. The six‑minute walk test in healthy children: reliability and validity. Eur Respir J. 2005;25:1057‑60.
43. Mahar MT, Welk GJ, Rowe DA, Crotts DJ, McIver KL. Development and validation of a regression model to estimate VO2peak from PACER 20‑m shuttle run performance. J Phys Act Health. 2006;3 Suppl 2:S34‑46.
44. Andersen LB, Andersen TE, Andersen E, Anderssen SA. An intermittent running test to estimate maximal oxygen uptake: the Andersen test. J Sports Med Phys Fitness. 2008;48:434.
45. Morinder G, Mattsson EV, Sollander C, Marcus C, Larsson UE. Six‑minute walk test in obese children and adolescents: reproducibility and validity. Physiother Res Int. 2009;14:91‑104.
46. Jacks DE, Topp R, Moore JB. Prediction of VO2peak using a sub‑maximal bench step test in children. Clinical Kinesiology. 2011;65:68‑75.
47. Mahar MT, Guerieri AM, Hanna MS, Kemble CD. Estimation of aerobic fitness from 20‑m multistage shuttle run test performance. Am J Prev Med. 2011;41 Suppl 2:S117‑23.
48. Ahler T, Bendiksen M, Krustrup P, Wedderkopp N. Aerobic itness testing in 6‑ to 9‑year‑old children: reliability and validity of a modiied Yo‑Yo IR1 test and the Andersen test. Eur J Appl Physiol. 2012;112:871‑6.
50. Scott SN, Thompson DL, Coe DP. The ability of the PACER to elicit peak exercise response in the youth. Med Sci Sports Exerc. 2013;45:1139‑43.
51. Vanhelst J, Fardy PS, Salleron J, Béghin L. The six‑minute walk test in obese youth: reproducibility, validity, and prediction equation to assess aerobic power. Disabil Rehabil. 2013;35:479‑82.
52. Hamlin MJ, Fraser M, Lizamore CA, Draper N, Shearman JP, Kimber NE. Measurement of cardiorespiratory itness in children from two commonly used field tests after accounting for body fatness and maturity. J Hum Kinet. 2014;40:83‑92.
53. Quinart S, Mougin F, Simon‑Rigaud ML, Nicolet‑Guénat M, Nègre V, Regnard J. Evaluation of cardiorespiratory itness using three ield tests in obese adolescents: validity, sensitivity and prediction of peak VO2. J Sci Med Sport. 2014;17:521‑5.
54. Fernhall B, Pitetti KH, Vukovich MD, Stubbs N, Hensen T, Winnick JP, et al. Validation of cardiovascular itness ield tests in children with mental retardation. Am J Ment Retard. 1997;102:602‑12.
55. Kuipers H, Verstappen F, Keizer H, Geurten P, van Kranenburg G. Variability of aerobic performance in the laboratory and its physiologic correlates. Int J Sports Med. 1985;6:197‑201.