* Universidade do Estado de Santa Catarina – Florianópolis, Santa Catari-na, Brasil, Laboratório de Pesquisa Morfofuncional – LAPEM, Grupo de Pesquisa em Fisiologia e Bioquímica do Exercício.
Received in 1/7/05. Final version received in 12/9/05. Approved in 6/12/05.
Correspondence to: Deivis Elton Schlickmann Frainer, Rua Campolino Alves, 1.199, apto. 406, bloco A, Abraão – 88085-110 – Florianópolis, SC, Brazil. E-mail: [email protected]
Influence of sexual maturation, chronological age
and growth indices in lactate threshold and
performance in the 20 minutes running
*
Deivis Elton Schlickmann Frainer, Fernando Roberto de Oliveira and Joris Pazin
O
RIGINALA
RTICLEKeywords: Sexual maturation. Lactate threshold. Running. Adolescents. ENGLISH VERSION
ABSTRACT
Children and adolescents present less blood lactate concentra-tions ([la]) than adults under certain loads. It is suggested that these differences are related to maturational aspects. The aim of this study was to verify the influence of sexual maturation, chronolog-ical age and growth indices (body weight, height and sum of two skinfolds – subscapular and triceps) over the lactate threshold ve-locity, in the fixed lactate concentration of 2.5 mmol.l-1 (V
2,5) and in the 20 minutes running (V20). Thirty-three boys, aged 13-15 years, who practice different sports were submitted to: 1) anthropomet-rical and sexual maturation evaluations through the Tanner index (sexual maturation of genitals and pubic hair); 2) progressive dis-continuous test (3 x 800 m in running track) to determine V2,5; and 3) 20 minutes running test to determine the V20 and final blood [la]. There were no associations between V2,5 and sexual maturation, neither chronological age nor growth index. As the only associa-tion verified was between V20 and height (r = 0,41; p < 0,05), the authors conclude that during adolescence other performance, phys-iological and/or biomechanical variables may play a greater role in lactate threshold and in the 20 minutes running than the growth variables.
INTRODUCTION
Historically, the oxygen maximum consumption (VO2 max) is used as a performance determining factor in the medium and long dura-tion competidura-tions of children and adolescents. However, some stud-ies have shown that the VO2 max is not a good discriminator of the aerobic response in homogeneous groups of youngsters(1). Improve-ments in the running performance without correspondent chang-es in the VO2 max relative to the body weight with runners be-tween10-18 years of age, longitudinally followed, may occur(2). Moreover, in children and adolescents, it is not always possible to determine the VO2 max through the traditional VO2 plateau, espe-cially due to maturational aspects and difficulties in obtaining a maximum effort(3). Hence, the use of the evaluation and prescrip-tion of activities using sub maximum models to decrease such difficulties is recommended(4).
The measurement of the blood lactate concentration ([1a]) is part of the routine of many exercise physiology laboratories and functional evaluation as standard approach of sub maximum vari-ables. The so-called transition thresholds basically reflect points where abrupt increases in the curve [la]-intensity, began to be used
as reference to aerobic capacity(5). Actually, the thresholds are ap-proximations of the intensity zone in the exercise where a balance between the production and the removal of lactate in the blood would occur, corresponding to the intensity of maximum lactate stable state (MLSS). The determination of thresholds, mainly the lactate threshold (LT), in some works called anaerobic threshold (AnT), is used as reference of intensity for the prescription of aer-obic capacity loads(6).
Despite the interest and technological evolution of the measure of [la], this is a costly methodology and demands skilled profes-sionals. Moreover, the blood collection is an invasive and uncom-fortable approach, especially with youngsters. Many authors have proposed alternatives to predict the variables related to the MLLS and the AnT, with limited approaches – basically to adults(7-8) –, with a smaller number of studies with children and adolescents to attenuate these methodological problems(9). A deficiency of meth-ods of AnT estimate is found with the youngsters.
A [la] of 4.0 mmol.l-1 is frequently used as indicator of the AnT and the MLSS in adults. However, many children can take loads close to exhaustion without exceeding this value of [1a](10), making its utilization discussible as criterion to evaluate the youngsters. Thus, the use of criteria with lower values as 2.5 mmol.l-1 were suggested(10-13).
Cavinato et al.(14), evaluating young soccer players of national status found [la] of 2,52 ± 0,90 mmol.l-1, one minute after a maxi-mum effort run of 20 m, being this value similar to the one sug-gested as fixed reference of [la] in the AnT (2,5 mmol.l-1) for chil-dren and adolescents, demonstrating that the medium velocity in this effort may be an alternative to the AnT approximation in these individuals.
Pazin et al.(15) evaluated 56 young participants of sports schools through the 20 minutes running track test with the purpose to ver-ify the possibility to determine the reference of MLSS velocities (using as criterion 2,5 mmol-1). His results showed that the velocity in the 20 minutes running is not statistically different from the 2,5 mmol.l-1 velocity, reaching the conclusion that the 20 minutes run-ning is a good discriminator of the aerobic aptitude in young ath-letes.
Since the studies by Ericksson et al.(16-18) it has been speculated that the smaller [la] in youngsters would be linked to their lower glycolytic capacity, and such fact would be related to the matura-tional process. However, such evidence has been questioned by other studies and should be more investigated(19). The chronologi-cal age and the growth indicators such as body weight and height, have been mentioned in the literature as possible factor of aerobic performance in youngsters(1).
Rev Bras Med Esporte _ Vol. 12, Nº 3 – Mai/Jun, 2006
127e
METHOD
Sample
The sample consisted of 33 boys, between 13 and 15 years of age who go to sports schools (basketball, volleyball and athletics), in clubs or sports institutions of the region of Florianópolis, SC. The data collection was conducted after the parents’ signing of the agreement term, according to the Ethics and Research Com-mittee of the State of Santa Catarina Univeristy.
Anthropometrical measures, corrected chronological age and sexual maturation evaluation
Initially, the body weight, height and triceps and subscapular skinfolds for posterior sum were obtained (ΣDC). The measure-ments were conducted according to Lohman‘s standardization (1991) mentioned by Tritschler(20).
The chronological age was corrected (ICC) by each individual´s birthdate in relation to the date of their anthropometrical data col-lection Such adjustment was calculated in decimal order.
The sexual maturation was determined through the indices stan-dardized by Tanner(21), observing the development of secondary sexual characteristics of pubic hair (SMPH) and development of genitals in boys (SMG). The boys were instructed about the evalu-ation meaning, and later on they received a form with standardized pictures and a side space where they would answer about the maturational stage that was close to theirs, observing the pictures. The form filling was individualized and the adolescent was in a closed room. Access to the form data was only given to the re-searchers after its completion.
The youngsters were grouped as pubescent when they were in stages 2 and 3, concerning pubic hair and also genitals; and as post-pubescent when they were in stages 4 and 5.
20 minutes running test
The test was conducted in a 200 meters synthetic track, where the subjects did a 10 minutes warm-up with low intensity continu-ous run and 10 minutes of stretching exercises. The participants were told to keep constant velocity during the running, with the purpose to do the longest distance as possible in 20 minutes. The cardiac frequency (CF) was monitored during the entire test (CF registration every 5 seconds through the POLAR S610itm frequen-cy meter) to analyze the intensity of the effort. There was a blood sample collection to measure the blood lactate concentrations [la], one minute after the test. The obtained variables in that test were the average velocity in the 20 minutes running (V20), cardiac fre-quency at the end of the test (FCfinal) and percentage of the esti-mate maximum CF %FCmax). The test was conducted in groups of maximum of 5 individuals.
Progressive test
The individuals did (in a 200 m athletics tracking field) three 800 meters runs (with one minute of interval), with the intensity of the effort being controlled by pre-established cardiac frequency zones for each running Such progressive test methodology was modi-fied from Geysemeyer and Rieckert(22). After a 10 minutes warm-up period with low intensity continuous running and 10 minutes of stretching exercises, the first 800 m run was conducted, where the individual was told to keep the CF between 140-150 bpm. The other runs were conducted in CF values between 160-170 bpm and 180-190 bpm controlled by the CF monitor. The interval be-tween each 800 m running was of one minute. Immediately after each 800 m running, there was blood collection to measure of the [la]. The measures of the [la] in the blood were analyzed by electri-cenzymatic method in a YSI 1500 (Yellow Springs Instruments®),
device with blood samples of 25 capillary blood microliters taken from the earlobe Polar S610 (Polar Electro®) monitors were used
for the CF measurement.
The obtained variable in this test was the average velocity in the [la] of 2,5 mmol.l-1 (V
2,5). The linear interpolation and extrapolation method from the plotting of the [1a] in their respective average velocities obtained from the progressive test was used to identify V2,5. The used extrapolation limit was lower or equal to 0,5 mmol.l -1.
The tests were conducted in a balanced way to decrease the interference of the test effect in the results.
Statistical analysis
The subjects were divided in groups by chronological age and by maturational index. The Pearson simple correlation was applied to verify association between two variables. The Spearman-Rank correlation was used to verify the association between the sexual maturation and the other variables in the study. The comparison between the growth indices (weight, height and skinfold sum), V2,5 and V20 in the chronological ages occurred through the ANOVA test, using Post-Hoc by Scheffé. The comparison in the maturational stages occurred through the t test for independent samples. A regression model for the estimate of V20 and V2,5, was established from the analyses, using the following predictor variables: matura-tional stage, age, gender, weight, height and fat %. ANOVA Two-way was used to compare V20 and V2,5 between the different chro-nological ages and maturational stage. The significance level for p < 0,05 was used for all the analyses.
RESULTS
The body weight, height and sum of the skinfolds (ΣDC) values for the 13, 14 and 15 years of age boys sample is found in table 1. Only the height was different comparing the 13 and 15 ages.
TABLE 1
Anthropometrical variables values (average ± standard deviation) according to the age groups
Variables 13 years 14 years 15 years
N 13 11 9
Weight (kg) 058,66 ± 14,36* 062,89 ± 17,08 072,46 ± 15,30 Height (cm) 166,33 ± 10,75* 171,29 ± 09,81 179,63 ± 05,05
ΣDC (mm) 023,19 ± 10,35* 023,57 ± 09,36 020,53 ± 11,23
N = number of subjects; ΣDC = sum of skinfolds. *
**
** = significant difference of 15 years (p < 0,05).
Comparing corrected chronological age, body weight, height and
ΣDC between the pubescent and post-pubescent youngsters, us-ing the self-evaluation of genitals as sexual maturation criterion (SMG), no significant differences were found in any variable ana-lyzed (table 2). On the other hand, comparing the pubescent and post-pubescent groups using the self-evaluation of pubic hair as sexual maturation criterion (SMPH), significant differences between weight and height were found (table 2).
TABLE 2
Physical characteristics of pubescents and post-pubescents through the self-evaluation of sexual maturation methods
Variables Genitals Pubic hair
Pubescents Post-pubescents Pubescents Post-pubescents
N 17 16 10 23
Age (years) 014,25 ± 00,77 014,35 ± 00,91 013,92 ± 00,74* 014,47 ± 00,82 Weight (kg) 060,68 ± 17,97 067,18 ± 13,60 048,89 ± 08,17* 070,33 ± 14,28 Height (cm) 169,78 ± 12,61 173,56 ± 07,46 161,96 ± 10,38* 175,81 ± 07,36
ΣDC (mm) 023,72 ± 10,56 021,39 ± 09,65 021,96 ± 07,27* 022,87 ± 11,16
Comparing the V2,5 (2,81 ± 0,34; 2,63 ± 0,36; 2,86 ± 0,45 m.s-1) and V20 (2,79 ± 0,45; 2,80 ± 0,31; 2,97 ± 0,25 m.s-1) performance variables in the 13, 14 and 15 ages, respectively, there was no significant difference among the ages either.
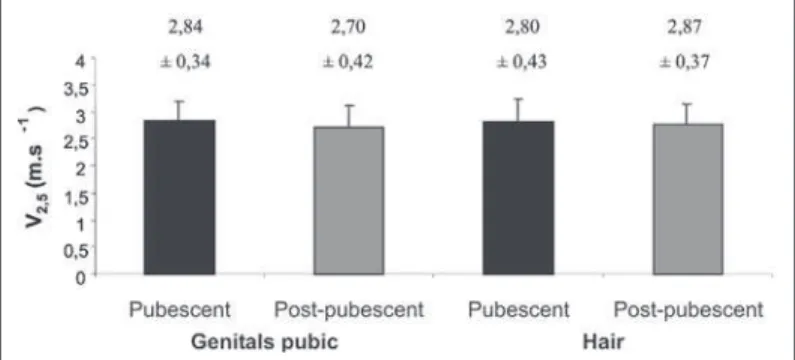
The values of V2,5 and V20 between the pubescent and post-pu-bescent groups (SMG and SMPH) are represented in figures 1 and 2. No significant differences were found between pubescents and post-pubescents for the performance variables (V2,5 e V20) using SMG as criterion. However, using SMPH, significant difference was found in the V20 (p < 0,05).
When the sexual maturation and growth indices were placed, none of them satisfactory explained V2,5.
Inserting the sexual maturation indices and the growth indices to predict V20, the only variable that fit the prediction model was the height. The generated equation was:
V20 (m.s-1) = 0,402 + 0,01422 x (height)
(r = 0,41; r2 = 0,17; EPE = 0,33 m.s-1)
The final CF results in the T20 were of 185 ± 15; 188 ± 11; 188 ± 8 bpm in the 13, 14 and 15 ages, respectively. The percentage in relation to the maximum estimate CF (220-age) of the individuals was 89 ± 7%; 91 ± 5% e 92 ± 4%.
DISCUSSION
The growth indices, body weight and height results evaluated in the young participants in this study were considerably higher than the results obtained by the studies with students from Santa Cata-rina State and Florianópolis city(23-24).
No significant difference was found in the body weight and ΣDC among the ages either. Only in the height among the 13 and 15 years of age youngsters significant difference was found None-theless, a great variability in the growth indices results in these ages may be observed. Such great variability may be caused partly according to Fagundes and Krebs(24), to the association that exists between these variables and the growth spur period. Pires and Lopes(23) explain that the growth spur is later and longer in the young male population, around 14 years of age, causing the boys to be taller and heavier than girls, who present an earlier and short-er spur, when they are around 12 years of age(25-26). Such evidence reflect on the positive correlations observed in the actual study, between: age and height (r = 0,44), weight and height (r = 0,75), weight and sexual maturation (r = 0,70), height and sexual matura-tion (r = 0,56) and sexual maturamatura-tion and chronological age (r = 0,35) (p < 0,05).
It seems that the hormonal system action, which plays a role in the sexual and growth hormones liberation, may influence in the variability of the growth indices in the different ages as well(24).
These higher growth indices observed in the subjects in this study may be explained by the fact that all of them were part of sports schools from the Florianópolis area in volleyball, basketball and athletics. All these youngsters are in a sports initiation pro-cess, and many of them were considered “talented”. In these col-lective sports the sum of the characteristics is extremely empha-sized and relevant at this first selective moment, which causes the sample of this study to be much above the average of the young-sters in the studies mentioned above. Another possibility is the fact that the regular training may influence in the physical growth and maturation, however, other factors may be more relevant to the change of this biological process. According to Malina(25) there are interactions between genetics and environment in the growth and development process. Whenever the environmental conditions are optimum, the genotype is the first regulator of the growth and maturation. However, the social environment may direct or indi-rectly influence through factors such as nutrition, the family rela-tionships, family size, physical activity habits, family, school and community sports habits. Malina also states that physical activity alone does not determine growth and maturation. It is believed that such fact has little influence in the findings of the actual study. The performance variables V2,5 andV20 were not statistically differ-ent in the 13, 14 and 15 years of age either, which denotes a ho-mogeneous characteristic in the aerobic capacity of the subjects. No association between these performance and chronological age were observed.
It is not possible to make comparisons between the results of this study and other studies that had similar objectives. This is mainly caused by methodological and conceptual differences
ap-Figure 1 – Comparison between pubescents and post-pubescents in the velocity of the lactate threshold through the sexual maturation self-evalua-tion
Figure 2 – Comparison between Pubescents and Post-Pubescents in the V20 through the sexual maturation self-evaluation
* Significantly different from post-pubescent (p < 0,05).
The correlations between sexual maturation (SMG and SMPH), CCA, growth indices, V2,5 and V20 are present in table 3.
TABLE 3
Correlations between sexual maturation (SMG and SMPH), corrected chronological age (CCA), growth indices, V2,5 and V20
SMG*** SMPH*** CCA Weight Height ΣΣΣΣΣDC V2,5
MSPP *,48*
ICC ,03 *,35* Weight ,30 *,70* ,27
Height ,07 *,56* *,44* **,75**
ΣDC –,11– ,02 –,07– **,49** ,13 V2,5 ,16 ,03 ,05 ,14 ,09 ,30
V20 –,09– ,31 ,18 ,21 *,37* –,07– ,39* * p < 0,05; ** p < 0,001, *** Sperman-Rank Correlation.
V2,5, and VT20 were not different in relation to different matura-tional stages(factor 1) and chronological age (factor 2), using ANO-VA two-way.
Rev Bras Med Esporte _ Vol. 12, Nº 3 – Mai/Jun, 2006
129e
plied to specially characterize the aerobic capacity of the subjects, namely: the study by Palgi et al.(27) used the ventilatory threshold and the absolute VO2 max as indicator of aerobic capacity; Tanaka and Shindo(28) used the velocity in the lactate threshold below the [la] of 2 mmol.l-1; Williams et al. used the %VO
2 peak in the OBLA (4 mmol.l-1)(11-12) and in the [la] of 2,5 mmol.l-1 (12) as Welsman et al.(29); Armstrong et al.(30) used the VO
2 peak as cardiorespiratory con-ditioning index.
The Tanner(21) indices were used through the self-evaluation of the development of the genitals and pubic hair development with the objective to verify the association between sexual maturation and the performance in some variables. The application of these indices has been recommended, especially to transversal studies(30) and a good association with other indicators of biological matura-tion has been verified(25). Nonetheless, one must be careful with the analyses conducted through these indices, and the possibility that they can be describing growth and development accurately.
In this study results, considering the group homogeneity and the fact that between 13 and 15 years of age is when many mod-ifications in the growth indices occur, which will influence in other performance components, and also considering that there is a great chronological age variation to the same biological age(31), one may observe that the SMG did not influence, in any of the studies vari-ables, the growth and maturational development of the individuals evaluated (vide Results – tables 2 and 3, and figures 1 and 2), even though they have not demonstrated significant difference of MSPP, and the two indices being significantly correlated (rs = 0,48, p < 0,05). Such results corroborate with the ones found by Borges et al.(32).
The SMPH showed difference between the pubescent and post-pubescent youngsters and significant association with body weight (r = 0,70) and height (r = 0,56) (p < 0,05). Armstrong and Wels-man(19) emphasize that the testosterone levels in boys are highly correlated to the growth indices (weight and height) during adoles-cence. Borges et al.(32) recommend that whenever the self-evalua-tion of the sexual maturaself-evalua-tion for the determinaself-evalua-tion of possible dif-ferences in the physical aptitude and in the anthropometrical components is applied, the indices of pubic hair development should be used as a more efficient criterion, which agree with the results of this study. In the regression analysis, the growth indices and the sexual maturation did not explain the performance in V2,5. It seems that in younger individuals the growth variables and the sexual maturation have low association with the lactate threshold. On the other hand, the endurance performance variables demon-strated a higher prediction power and association of the lactate threshold, as has been seen in other studies(1,33). Hence, it is im-portant to reflect on the influence of the sexual maturation in the lactate threshold.
Many researchers have been investigating the reasons why younger individuals present lower blood concentrations of lactate, based on studies by Ericksson et al.(16-18), One of the reasons for this limitation would be related to a lower glycolytic capacity, which consequently would be connected to the sexual maturation An-other study, frequently mentioned by the literature, demonstrated that it is necessary an adequate proportion of testosterone for the development of glycolysis in rats(34). Falgairette et al.(35) presented significant associations between the blood lactate responses in the exercise and levels of testosterone (r = 0,40, p < 0,001) in 144 boys between 6 and 15 years of age. Another classical study that supports the androgenic influence in the glycolysis was conducted by Tanaka and Shindo(28), which demonstrated a significant associ-ation between bone age and the velocity in the lactate threshold in boys between 6 and 15 years of age (r = –0,32), reaching the con-clusion that: “pre-pubescent and pubescent boys have greater velocities in the lactate threshold than adolescents (post-pubes-cent) and this can partly, be due to the lower testosterone action over the skeletic muscle”.
In the actual study, no significant association between any of the maturation indices used (SMG and SMPH) with V2,5 and with V20. was found. These results are similar to other authors who used the Tanner indices as maturation marker(11-12) concerning the blood concentrations of testosterone(29).
Many studies have been criticized for not demonstrating an ad-equate control, mixing the influences and the interrelations among testosterone, other growth indices and the development variable under consideration. An evaluation of the independent effects of testosterone in response to the blood lactate should use statistical techniques that allow that these confusing relations are con-trolled(19).
Accordingly, it seems risky facing the knowledge, to suppose the relation with the maturation indices and submaximum/maxi-mum [la](29) and glycolytic enzymatic activity(36-38). The applied meth-odologies and the verified magnitude in the associations do not sufficiently support the idea of dependence commonly released between maturation and the transition thresholds. In the initial stud-ies by Ericksson et al., themselves, that suggest a lower ability in young individuals to generate energy through glycolysis, the au-thor recommends caution in its results interpretation since “gen-eral conclusions cannot be reached”(17,p.18).
Differently from the inconsistency of the evidence of a lower glycolytic potential in younger individuals, the studies have consis-tently observed higher levels of oxidative enzymes, such as desidro-genase succinate (DHS) and desidrodesidro-genase isocitrate (DHIC)(37). Differences in the ratio between PFK to DHIC in children (0.884) compared with adults (1.633) reflect a better ability to oxidize the piruvate and provide evidence that children are preferably skilled to produce aerobic energy(38). However, these considerations do not have comparative effect with the actual study, since these vari-ables have not been measured and serve as reflexion over the subject. Concerning the performance in the 20 minutes running test of youngsters, there was an association only between V20 and height (r = 0,37, p < 0,05), being height the only variable with pre-diction power in V20. Such fact may be due to aspects of running economy that occur during adolescence, through the modifications in the patterns of frequency and size of step in the running caused by changes in the size of the body segments. Further analysis on other variables that may have more association with the endur-ance in young populations, such as running maximum velocity, run-ning economy, fraction of used VO2max (percentual), among others, is necessary(39).
In the current study the individuals were asked to run the 20 minutes as stable as possible, with no great variations in the rhythm during the distance. This procedure was recommended by Frainer et al.(40) in a study with young soccer players, where the authors suggest caution when applying the 20 minutes test and making conclusions about the results. The result of the percentage of the maximum cardiac frequency (%FCmax) found in the T20 shows that some adolescents came close to 100% of the CFmax estimated in the end of the test, showing high concentrations of lactate. Such fact is probably due to changes in the running rhythm during the 20 minutes, causing an imbalance between the production and removal of blood lactate, which may hamper the running perfor-mance(41).
Therefore, it is difficult to reach conclusions about the results in the 20 minutes running, due to the different running strategies adopted by the adolescents in this study.
CONCLUSION
ACKNOWLEDGMENTS
We thank all the LAPEM participants who collaborate in this study data collection. We especially thank professors Lorival José Carminatti, Adriano Eduardo Lima-Silva and Ruy Jornada Krebs for the fruitful collaboration and discussions.
All the authors declared there is not any potential conflict of inter-ests regarding this article.
REFERENCES
1. Krahenbuhl GS, Skinner JS, Kohrt WM. Developmental aspects of aerobic pow-er in children. Expow-erc Sport Sci Rev 1985;13:503-38.
2. Daniels J, Oldridge N, Nagle F, White B. Differences and changes in VO2max among runners 10 to 18 years of age. Med Sci Sports Exerc 1978;10:200-3. 3. Armstrong N, Welsman J, Winsley R. Is peak VO2 a maximal index of children’s
aerobic fitness? Int Sports Med 1996;17:356-9.
4. Kiss MAPDM. Potência e capacidade aeróbias: importância relativa em esporte, saúde e qualidade de vida. In: Amadio CA, Barbanti VJ, organizadores. A biodi-nâmica do movimento humano e suas relações interdisciplinares. São Paulo: Estação da Liberdade, 2000;163-74.
5. Heck H, Hess G, Mader A. Comparative study of different lactate threshold con-cepts. Dsc Z Sportmed 1985;36:19-25.
6. Oliveira FR, Gagliardi JFL, Kiss MAPDM. Proposta de referências para a prescri-ção de treinamento aeróbio e anaeróbio para corredores de média e longa dura-ção. Rev Paul Educ Fís 1994;8:68-72.
7. Olbrecht J, Madsen O, Mader A, Liesen H, Hollmann W. Relationship between swimming velocity and lactic concentration during continuous and intermittent training exercises. Int J Sports Med 1985;6:74-7.
8. Weltman J, Seip R, Levine S, Snead D, Rogol A, Weltman A. Prediction of lac-tate threshold and fixed blood laclac-tate concentrations from 3200m time trial run-ning performance in untrained females. Int J Sports Med 1989;10:207-11. 9. Colantonio E. Análise das velocidades: referencial de 4mM, de equilíbrio de 30
min. E velocidade crítica em nadadores adolescentes. São Paulo, 1999. Disser-tação (mestrado) – Escola de Educação Física e Esporte da Universidade de São Paulo.
10. Williams JR, Armstrong N, Kirby BJ. The 4 mmol blood lactate level as an index of exercise performance in 11-13 year old children. J Sports Sci 1990;8:139-47. 11. Williams JR, Armstrong N, Kirby BJ. The influence of age and maturation on the
2.5 and 4.0 mmol levels of blood lactate in girls. J Sports Sci 1990;8:80. 12. Williams JR, Armstrong N, Kirby BJ. The relationship between children’s blood
lactate responses to incremental and constant speed treadmill exercise. J Sports Sci 1990;8:298-9.
13. Williams JR, Armstrong N, Kirby BJ. The blood lactate response to exercise in 11 to 16-year-old children with reference to cardiorespiratory variables, chrono-logical age, sex and maturity. J Sports Sci 1990;8:297-8.
14. Cavinato CC, Lima JRP, De Oliveira FR. Teste de 20min e “limiar anaeróbio” em jovens jogadores de futebol. In: IV Congresso Paulista de Educação Física. Anais, Jundiaí, 2000.
15. Pazin J, Carminatti L, De-Oliveira FR, Frainer DES, Breda A. Velocidade no teste de corrida de 20 minutos e velocidades de referência de máximo steady-state de lactato. Rev Bras de Ciência e Movimento 2004;1:61.
16. Ericksson BO, Karlsson J, Saltin B. Muscle metabolites during exercise in puber-tal boys. Acta Physiol Scand 1971;87:27-39.
17. Ericksson BO. Physical training, oxygen supply and muscle metabolism in 11-13 years old boys. Acta Physiol Scand 1972;38:1-48.
18. Ericksson BO, Saltin B. Muscle metabolites during exercise in boys aged 11-16 years compared to adults. Acta Physiol Scand 1974;28:257-65.
19. Armstrong N, Wellsman J. Aerobic exercise: growth and maturation. In: Young people & physical activity. New York: Oxford Univ. Press, 1997.
20. Tritschler K. Medida e avaliação em educação física e esportes de Barrow e McGee. Barueri, SP: Manole, 2003;236-57.
21. Tanner J M. Growth at adolescence. Oxford: Blackwell Scientific, 1962. 22. Geysemeyer U, Rieckert H. Field-step tests for sports discipline-related
diagno-sis of endurance power. Int J Sports Med 1987;8:132.
23. Pires MC, Lopes AS. Crescimento físico e características sociodemográficas em escolares no município de Florianópolis-SC, Brasil. Rev Bras Cine Des Hum 2004; 6:17-26.
24. Fagundes T, Krebs RJ. Perfil do crescimento somático de escolares de Santa Catarina. Revista Digital: Lecturas en Educación Física, Buenos Aires 2005;10 (83).
25. Malina R. Growth and maturation: normal variation and effect of training. In: Gisolfi CU, Lamb DR, editors. Youth, exercise and sport 1989;223-71. 26. Naughton G, Farpour-Lambert NJ, Carlson J, Bradney M, Van Praag E.
Physiolo-gical issues surrounding the performance of adolescent athletes. Sports Med 2000;30:309-25.
27. Palgi Y, Gutin B, Young J, Alejandro D. Physiological and anthropometric factors underlying endurance performance in children. Int J Sports Med 1984;5:67-73. 28. Tanaka H, Shindo M. Running velocity at blood lactate threshold of boys ages 6-15 years compared with untrained and trained young males. Int J Sports Med 1985;6:90-4.
29. Welsman JR, Armstrong N, Kirby BJ. Serum testosterone is not related to peak VO2 and submaximal blood lactate responses in 12- to 16 –year-old males. Ped
Exerc Sci 1994;6:120-7.
30. Armstrong N, Williams J, Balding J, Gentle P, Kirby B. The peak oxygen uptake of British children with reference to age, sex and sexual maturity. Eur J Appl Physiol 1991;6:369-75.
31. Bohme MTS. Resistência aeróbia de jovens atletas mulheres com relação à ma-turação sexual, idade e crescimento. Rev Bras Cine Des Hum 2004;6:27-35. 32. Borges FS, Matsudo SMM, Matsudo VKR. Perfil antropométrico e metabólico
de rapazes pubertários da mesma idade cronológica em diferentes níveis de maturação sexual. Rev Bras de Ciência e Movimento 2004;12:7-12.
33. Mahon AD, Del Corral P, Howe CA, Duncan GE, Ray M. Physiological correlates of 3-kilometer running performance in male children. Int J Sports Med 1996;17: 580-4.
34. Dux L, Dux E, Guba F. Further data on the androgenic dependency of the skele-tal musculature. The effect of the prepuberskele-tal castration of the structural devel-opment of the skeletal muscles. Horm Metab Res 1982;14:191-4.
35. Falgairette G, Bedu M, Fellmann N, Van-Praag E, Coudert J. Bio-energetic pro-file in 144 boys aged from 6 to 15 years with special reference to sexual matu-ration. Eur J Appl Physiol 1991;62:151-6.
36. Berg A, Kim SS, Keul J. Skeletal muscle enzyme activities in healthy young sub-jects. Int J Sports Med 1986;7:236-9.
37. Fournier M, Ricci J, Taylor AW, Ferguson RJ, Montpetit RR, Chaitman BR. Skel-etal muscle adaptation in adolescent boys: sprint and endurance training and detraining. Med Sci Sports Exerc 1982;14:453-6.
38. Haralambie G. Enzime activities in skeletal muscle of 13-15 years old adoles-cents. Bull Eur Physiopath Resp 1982;18:65-74.
39. Krahenbuhl GS, Pangrazi RP. Characteristics associated with running performance in young boys. Med Sci Sports Exerc 1983;15:486-90.
40. Frainer DES, De-Oliveira FR, Cal Abad CC, Kiss MAPDM. Evidências de validade do T20 como aproximação do limiar anaeróbio em jovens jogadores de futebol. R. da Educação Física/UEM 2004;15:33-7.