2011 Jan-Feb;19(1):50-7
www.eerp.usp.br/rlae
Corresponding Author: Letícia Faria Serpa
Hospital Alemão Oswaldo Cruz. Instituto de Educação e Ciências. Rua João Julião, 331 - Bloco A - 3º andar
Bairro Paraíso
CEP: 01323-903 São Paulo, SP, Brasil E-mail: [email protected]
Predictive Validity of the Braden Scale for Pressure Ulcer Risk in
Critical Care Patients
Letícia Faria Serpa
1Vera Lúcia Conceição de Gouveia Santos
2Ticiane Carolina Gonçalves Faustino Campanili
3Moelisa Queiroz
4This methodological study aimed to evaluate the predictive validity of the Braden scale in
critical care patients. The study was conducted in four intensive care units of a general
private hospital. After approval of the project by the Hospital Ethics Committee, during six
months, adult patients admitted to ICUs with a Braden score ≤18 and without PU were assessed upon admission and at 48-hours intervals as long as the patient remained at risk
or until the development of PU, patients’ discharge, death or transfer from the ICU. The
cut-off scores of the Braden scale in the first, second and third assessments were 12, 13
and 13, respectively. Sensitivity was 85.7%, 71.4% and 71.4% and specificity was 64.6%, 81.5% and 83.1%, respectively. Areas under the ROC curves revealed very good accuracy
for the cut-off scores. The Braden cut-off score 13 in the third assessment showed the best
predictive performance in critical care patients.
Descriptors: Pressure Ulcer; Intensive Care; Predictive Value of Tests; Sensitivity and
Specificity.
1 RN, Ph.D. in Nursing, Instituto de Ciências, Hospital Alemão Oswaldo Cruz, São Paulo, SP, Brazil. E-mail: [email protected].
2 RN, Ph.D. in Nursing, Associate Professor, Escola de Enfermagem, Universidade de São Paulo, SP, Brazil. E-mail: [email protected].
3 RN, Instituto do Coração, Faculdade de Medicina, Universidade de São Paulo, SP, Brazil. E-mail: [email protected].
Validade preditiva da escala de Braden para o risco de desenvolvimento de úlcera por pressão, em pacientes críticos
Este estudo metodológico foi desenvolvido em quatro unidades de terapia intensiva de
um hospital geral, com o objetivo de avaliar a validade preditiva da escala de Braden
em pacientes críticos. Após aprovação do projeto pelo Comitê de Ética em Pesquisa, da instituição, durante seis meses, pacientes adultos com escore total de Braden ≤18 e sem úlceras por pressão (UP) foram avaliados na admissão e a cada 48 horas, enquanto permaneceram em risco ou até o desenvolvimento de UP, alta, morte ou transferência da
UTI. Os escores de Braden 12, 13 e 13, respectivamente na primeira, segunda e terceira avaliação apresentaram sensibilidade de 85,7, 71,4 e 71,4% e especiidade de 64,6, 81,5 e 83,1%. As áreas sob a curva ROC (Receiver Operating Characteristics) revelaram acurácia muito boa para os escores de corte obtidos. O escore de corte da escala de Braden igual a 13, na terceira avaliação, apresentou a melhor performance preditiva em
pacientes críticos.
Descritores: Úlcera por pressão; Cuidados intensivos; Valor Preditivo dos Testes; Sensibilidade e Especiicidade.
Validez predictiva de la Escala de Braden para el riesgo de úlceras por presión en pacientes críticos
Se tuvo por objetivo evaluar la validez predictiva de la Escala de Braden en los pacientes
críticos. Se trata de un estudio metodológico, en cuatro unidades de cuidados intensivos
de un hospital general. Después de la aprobación del proyecto por el Comité de Ética
de la Institución, durante seis meses, los pacientes adultos con puntuación total de Braden ≤18 y sin úlceras por presión (UP) fueron evaluados en la admisión y a cada 48 horas, mientras permanecieron en riesgo o hasta: el desarrollo de UP, el alta, la muerte
o removidos de la UCI. Las puntuaciones de Braden 12, 13 y 13, respectivamente en la primera, segunda y tercera evaluaciones presentaron sensibilidad de 85,7%, 71,4% y 71,4% y especiicidad de 64,6%, 81,5% y 83,1% respectivamente. Las área bajo las curvas ROC muestrearon muy buena precisión de las puntuaciones obtenidas. Se
concluye que la puntuación de Braden 13, en la tercera evaluación, presentó el mejor
desempeño predictivo en los pacientes críticos.
Descriptores: Úlcera por Presión; Cuidados Intensivos; Valor Predictivo de las Pruebas; Sensibilidad y Especiicidad.
Introduction
Intensive care units (ICUs) receive patients with
single or multiple organ failure, who often require life support measures like mechanical ventilation, continuous sedation and vasoactive drugs, in addition
to multiple types of devices, such as catheters, drains, probes and immobilizers. These measures signiicantly impair one of the most important mechanisms for the
maintenance of skin integrity, i.e. bed mobility, making patients highly vulnerable to the development of
pressure ulcers (PU)(1-2).
The National Pressure Ulcer Advisory Panel(3) deines
a PU as an area of localized damage to the skin and/ or underlying tissue, generally located above a bone
in combination with shear and friction. Various factors
have been associated with the development of PU(3).
Speciically in the case of ICU patients, these factors include nutritional deicits, moisture, artiicial ventilation, circulatory disturbances, altered tissue perfusion and,
mainly, increased exposure to pressure, age, sepsis,
prolonged hospitalization, some chronic diseases or conditions like diabetes, nephropathies and spinal cord injury and emergency admission(1-2,4).
In the international scenario, the implementation
of guidelines for PU prevention has brought down their incidence in critical care patients from 43% to a current incidence of 28%(2). In a recent literature review,
however, the authors found higher incidence rates, from 38% to 124%, in the studies examined(5). In Brazil,
concern regarding the incidence of PU in ICU patients
has also been increasing, with studies conducted in Rio
de Janeiro and São Paulo, reporting incidences from 26.83% to 62.5%(6-8).
Risk assessment scales for PU development have been studied and implemented in vulnerable groups or groups more exposed to skin integrity alterations. A study(9) reported the existence of more than 40 scales,
but only six have been tested for predictive validity.
Norton, Gosnell, Waterlow, Braden and Bergstrom signiicantly contributed to these studies(10-11).
The Braden scale was published in 1987, and has mainly been used in the United States(11). This
instrument was adapted and validated for the Brazilian
culture in 1999(12) and has been applied since then by
some institutions in Brazil. The Braden scale consists of
six subscales: sensory perception, moisture, activity, mobility, nutrition and friction/shear. The total score can range from 6 to 23 and patients are classiied as follows: very high risk (score ≤ 9), high risk (score ranging from 10 to 12), moderate risk (score ranging from 13 to 14), low risk (score ranging from 15 to 18), and no risk (score ranging from 19 to 23)(13).
In their initial study(11), the authors found a
sensitivity and speciicity of 83% and 64%, respectively, for cut-off score 16. More recently, the same authors recommended score 18 as more appropriate, so that elderly patients as well as physiologically unstable white and black patients could be included(14). Since then,
many research groups worldwide have tried to establish the best cut-off score of the Braden scale, i.e. to deine a score that best indicates risk for the development of PU. In 2003, it was concluded that the cut-off scores authors
presented could not be precisely reproduced in all units,
a fact that supported the need for further studies,
evaluating the sensitivity and speciicity of the scale in
different areas, based on the distinct characteristics of
the patients in each specialty(15).
Since ICU patients have peculiar characteristics and
in view of the scarcity of Brazilian studies evaluating the
performance of the Braden scale in general, the aim of
the present study was to analyze the predictive validity
of the Braden scale in critical care patients.
Methods
A methodological study was conducted, using the
database from the study by Serpa and Santos(16). In the
original study, the data were collected at four ICUs (two
neurology ICUs, one cardiology ICU and one general ICU, comprising a total of 80 beds) of a large, nonproit charitable general hospital. Data were collected between January and July 2006. Although the nursing staff of the hospital uses the nursing care process, there are no
institutional protocols for the prevention and treatment of PU and risk assessment scales are not used routinely.
Data were collected after approval of the research
project was obtained from the Institutional Ethics
Committee. After being invited to participate in the
study, the patients or their legal representative received
detailed information about the study objective and,
after agreeing to participate, signed two copies of the
informed consent form, with one copy remaining with
the patient and the other with the researchers.
All patients hospitalized at the selected ICUs during
the period of data collection were evaluated and those
complying with the following criteria were included in the sample: age ≥ 18 years, absence of PU in the irst assessment, hospitalization for a minimum period of 24h and a maximum period of 48h, a total Braden score ≤ 18, and consent to participate in the study. According to the criteria of the original study, patients with chronic
renal failure, patients under dialysis for more than one month and patients with liver insuficiency accompanied by ascites were excluded. From a total of 82 patients admitted to ICUs consecutively during six months, 72 composed the inal sample according to the inclusion and exclusion criteria. Seven patients were discharged, two
refused to participate and one died before completing
data collection.
Two instruments were used for data collection: the irst consisted of socio-demographic and clinical data and was applied in the irst assessment; and the second contained the validated Braden scale(12) and was applied
Serpa LF, Santos VLCG, Campanili TCGF, Queiroz M.
as the patient remained at risk or until the following outcomes: development of PU, discharge, death or
transfer from the ICU. Only data from patients with at
least three consecutive assessments were used for the
analyses.
Since the beginning of the study, all healthcare
team members were informed about patients who were at risk of developing PU and preventive measures were the responsibility of the institution. Once a PU was
detected, the same procedure was adopted and the
nursing staff was responsible for the adoption of the
necessary therapeutic measures, without interference
from the researchers.
To analyze the predictive validity of the Braden scale, sensitivity and speciicity of the cut-off scores were calculated using receiver operating characteristic (ROC) curves, in addition to their likelihood ratios.
When interpreting the results of a diagnostic test as the probability of occurrence of a disease/phenomenon, the positive predictive value of the Braden scale indicates the probability of a patient to develop PU when classiied as being at risk by the scale, whereas its negative predictive value refers to the probability of a patient not to develop PU when classiied as not being at risk by the scale.
Authors(17) deined sensitivity as the proportion of
individuals with a positive test who develop a disease, and speciicity as the proportion of individuals with a negative test who do not develop a disease.
The ROC curve is a graphic plot of true positive
values (sensitivity) on the ordinate and false positive values (1 – speciicity) on the abscissa as a function of each cut-off point. Tests with a good discriminatory
power are concentrated in the upper left corner of the
ROC curve. There is an approximately linear
quantitative-qualitative relationship between the area under the curve (AUC) and accuracy, which can be classiied as follows: excellent (0.80-0.90), very good (0.70-0.79), good (0.60-0.69), and poor (0.50-0.59)(17-18).
The likelihood ratio is another method used to correlate speciicity and sensitivity. In the present study, the likelihood ratio was used to express the higher (or
lower) chance of inding a PU in patients at risk when compared to those classiied as not being at risk. A positive likelihood ratio (LR+) of the Braden scale refers to the ratio between the proportion of patients who develop PU and who are classiied as being at risk and the proportion of patients who do not develop PU and who are classiied as being at risk. A negative likelihood ratio (LR-) of the Braden scale is obtained when the result
of the test is negative, i.e. the proportion of patients who develop PU and who are not classiied as being at risk divided by the proportion of patients without PU and who are not classiied as being at risk(18). These results
are represented by Fagan Nomograms.
MS Excel software, version 2000, was used to
construct the database, SPSS for Windows, version
13.0, for statistical analyses and elaboration of the
graphs, and MS Word, version 2003, to construct the tables. P-values below 5% were considered signiicant. The patients’ socio-demographic and clinical data (age,
days of hospitalization, Braden score) were submitted to descriptive statistics.
Results
Out of 72 patients, 48 (66.7%) were men and the average age was 60.9 ± 16.5 years; 72.2% of the patients were classiied as surgical. The minimum length of stay was 6 days and 20.8% of the patients were hospitalized for more than 31 days, mean 17.1 ± 9.0 days. The most frequent diseases were related to the cardiovascular system (83.3%).
Initial evaluation classiied the patients of the sample as low risk (30.5%), moderate risk (40.3%) and high risk (29.2%). Eight patients developed PU, with an incidence of 11.1%. PU were diagnosed since day 2 of hospitalization and were classiied as stage I (42.9%) and stage II (57.1%).
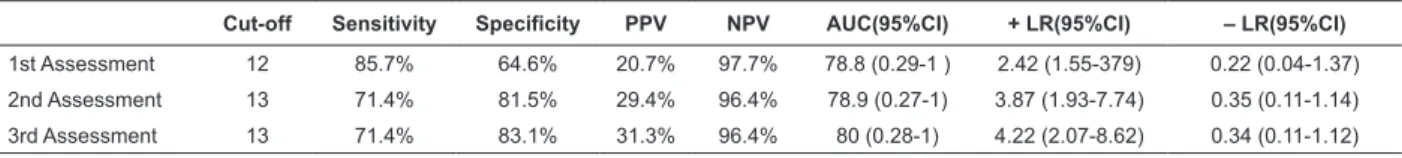
A cut-off score 12 was identiied in the irst assessment, which showed 85.7% sensitivity and 64.6% speciicity. In the subsequent two assessments, cut-off score 13 was obtained, with a sensitivity of 71.4% in the two assessments and speciicity of 81.5% and 83.1% in the second and third assessment, respectively (Table 1).
Table 1 - Predictive values of the Braden scale cut-off scores in critical care patients, according to the assessment
Cut-off Sensitivity Specificity PPV NPV AUC(95%CI) + LR(95%CI) – LR(95%CI)
1st Assessment 12 85.7% 64.6% 20.7% 97.7% 78.8 (0.29-1 ) 2.42 (1.55-379) 0.22 (0.04-1.37)
2nd Assessment 13 71.4% 81.5% 29.4% 96.4% 78.9 (0.27-1) 3.87 (1.93-7.74) 0.35 (0.11-1.14)
3rd Assessment 13 71.4% 83.1% 31.3% 96.4% 80 (0.28-1) 4.22 (2.07-8.62) 0.34 (0.11-1.12)
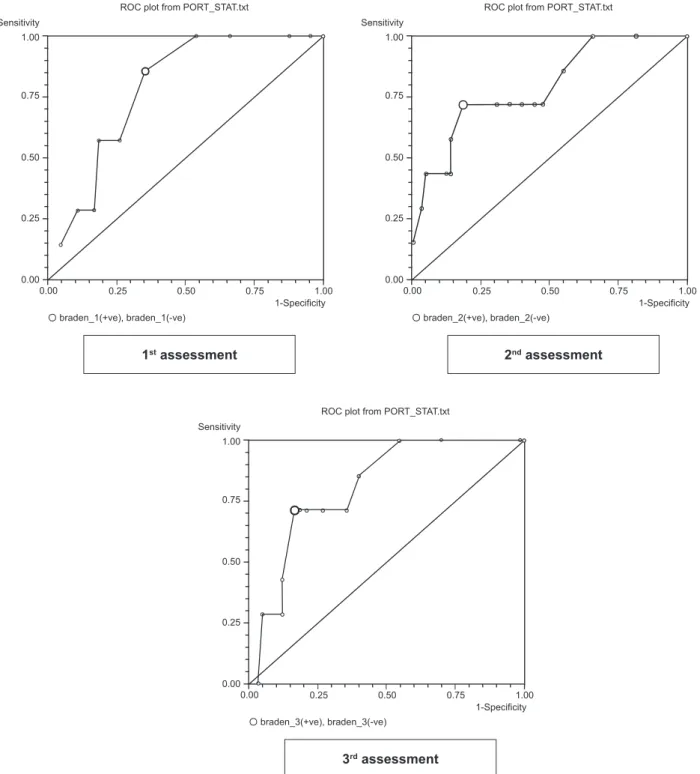
Analysis of the AUC showed excellent accuracy (0.8) in the third assessment and very good accuracy in
the irst and second assessment (0.78). All of the three curves showed a good discriminatory power (Figure 1).
Sensitivity 1.00
0.75
0.50
0.25
0.00
0.00 0.25 0.50 0.75 1.00
1-Specificity braden_1(+ve), braden_1(-ve)
ROC plot from PORT_STAT.txt
1st assessment
Sensitivity 1.00
0.75
0.50
0.25
0.00
0.00 0.25 0.50 0.75 1.00
1-Specificity braden_2(+ve), braden_2(-ve)
ROC plot from PORT_STAT.txt
2nd assessment
Sensitivity 1.00
0.75
0.50
0.25
0.00
0.00 0.25 0.50 0.75 1.00
1-Specificity braden_3(+ve), braden_3(-ve)
ROC plot from PORT_STAT.txt
3rd assessment
Figure 1 - ROC curves of the Braden scale cut-off scores in critical care patients, according to the assessment
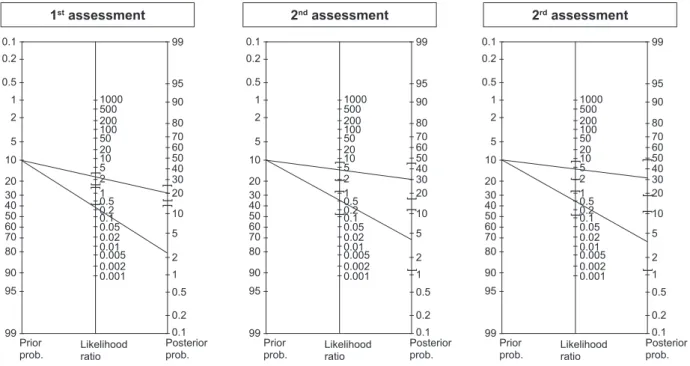
LR+ was higher in the third assessment, with patients with score 13 presenting a 4.22 times higher chance of developing PU, compared to a 3.87 and 2.42 times higher chance in the second and irst assessment, respectively. The lowest LR- was observed in the irst
assessment (0.22) and the highest in the second assessment (0.35). Thus, in the third assessment, using
Serpa LF, Santos VLCG, Campanili TCGF, Queiroz M. 0.1 0.2 0.5 1 2 5 60 50 20 10 40 30 70 80 90 95 99 1000 500 100 50 20 10 5 200 ] 2 ] ] 1 0.5 0.2 0.1 0.05 0.02 0.01 0.005 0.002 0.001 ] 99 95 90 80 70 60 50 40 30 20 10 5 2 1 0.5 0.2 0.1 ] ] ] Prior
prob. Likelihoodratio
Posterior prob. 0.1 0.2 0.5 1 2 5 60 50 20 10 40 30 70 80 90 95 99 1000 500 100 50 20 10 5 200 ] 2 ] ] 1 0.5 0.2 0.1 0.05 0.02 0.01 0.005 0.002 0.001 ] 99 95 90 80 70 60 50 40 30 20 10 5 2 1 0.5 0.2 0.1 ] ] ] Prior
prob. Likelihoodratio
Posterior prob. ] 0.1 0.2 0.5 1 2 5 60 50 20 10 40 30 70 80 90 95 99 1000 500 100 50 20 10 5 200 ] 2 ] ] 1 0.5 0.2 0.1 0.05 0.02 0.01 0.005 0.002 0.001 ] 99 95 90 80 70 60 50 40 30 20 10 5 2 1 0.5 0.2 0.1 ] ] ] Prior
prob. Likelihoodratio
Posterior prob.
]
1st assessment 2nd assessment 2rd assessment
Figure 2 - Fagan nomograms of the Braden scale cut-off scores in critical care patients, according to the
assessment
Discussion
PU are a socioeconomic and educational problem that has an important inancial impact, with their prevention being less costly than their treatment. PU treatment ranks third among the most expensive health treatments, less expensive only than cancer treatment
and heart surgery(19). In addition, when the patient
develops a PU, the nursing team becomes intensive, showing an increase by about 50%. Thus, the prevention of PU is of primary relevance for patient care, with consequent beneits for the health system(12,20-21).
In order to prevent the development of PU and optimize resources and measures, risk assessment scales have been studied in detail worldwide(22-23),
and also more timidly in Brazil(12). In these studies,
sensitivity and speciicity vary, resulting in different cut-off scores, mainly, as expected, when considering
different specialties. These differences between cut-off
scores are due to extrinsic and intrinsic characteristics of the speciic patient groups, a fact that motivated the present investigation regarding the predictive validity
of the Braden scale applied to critical care patients in
Brazil.
Similar to our indings, other Brazilian authors(12)
found a higher balance between sensitivity (52%) and speciicity (80%) for critical care patients when score 13
was used in the third assessment. The same score was obtained, investigating 186 patients from a neurology ICU, which classiied 41.4% of the patients as being at risk in the irst assessment, with a sensitivity of 91.4%, a positive predictive value of 27.3% and 1.8% of false-negative results(24).
In another study(25), score 14 was also identiied in
337 patients submitted to heart surgery from the irst till the third postoperative day during ICU hospitalization.
This score showed the best performance on the third day, with 57.1% sensitivity and 92% speciicity.
The frequency of application of the Braden scale
continues to be a controversial issue. Although Waters(15)
recommended its application upon admission and 48 hours later, no consensus is available for intensive
care patients. In its most recent revision about PU
Prevention, the National Pressure Ulcer Advisory Panel
(NPUAP)(26) recommended that institutional protocols of
risk assessment and re-assessment should be developed according to the characteristics of the clinical areas
where the patient is attended.
Restrictions of mobility, the presence of incontinence and nutritional status are rarely identiied upon admission to the ICU. Thus, the cut-off score can be established in subsequent assessments, like in the present study and in another research(25). Applying the Braden scale at
care patients’ frequent instability and the identiication of a subsequent assessment as one of the best PU risk predictors in ICUs. In a recent literature review, the
author stated that the ideal time for this evaluation
varies according to the characteristics of the patients. In general, the irst assessment should be performed 72 h after admission, when the risk for the development of PU is elevated(27).
In the present study, considering all three consecutive
assessments, score 13 in the third assessment obtained
the most adequate predictive values, showing the best balance between sensitivity and speciicity, and excellent accuracy and best LR, in agreement with other studies’ indings(12,24-25). These results conirm score 13 as the
best to identify the risk for the development of PU in critical care patients.
Limitations and recommendations
Despite the prospective character of the present
study, including rigorous and controlled data collection,
limitations were related mainly to the number of ICU
involved and the fact that they belonged to a single
hospital.
In spite of its limitations, the study contributes
with important data to the national and international literature by conirming or contrasting obtained results, using the same tool. On the other hand, it adds a new
statistical strategy to analyze the predictive validity of risk assessment scales, which was the LR.
Further studies are necessary to analyze the
Braden scale’s performance in a bigger sample, in
different ICUs and according to specialty, such as bed
immobility, a characteristic of neurology and trauma units, nutritional deicits in surgery and digestive tract units, and circulatory involvement in cardiology units,
among others.
Conclusion
In the present study, the Braden cut-off score 13
in the third assessment showed the best predictive
performance in critical care patients.
References
1. Pender LR, Frazier SK. The relationship between
dermal pressure ulcers, oxygenation and perfusion in
mechanically ventilated patients. Intensive Crit Care Nurs. 2005;21:29-38.
2. Laat EH, Pickkers P, Schoonhoven L, Verbeek AL, Feuth
T, Van Achterberg T. Guideline implementation results
in a decrease of pressure ulcer incidence in critically ill patients. Crit Care Med. 2007;35:815-20.
3. Black J, Baharestani M, Cuddigan J et al. National Pressure Ulcer Advisory Panel´s updated pressure ulcer staging system. Dermatol Nurs. 2007;19:343-9. 4. Frankel H, Sperry J, Kaplan RJ. Risk factors for pressure ulcer development in a best practice surgical intensive care unit. Am Surg. 2007;73:1215-7.
5. Shahin ES, Dassen T, Halfens RJ. Pressure ulcer prevalence and incidence in intensive care patients: a literature review. Nurs Crit Care. 2008;13:71-9.
6. Sousa CA, Santos I, Silva LD. Aplicando recomendações da Escala de Braden e prevenindo úlceras por pressão –
evidências do cuidar em enfermagem. Rev Bras Enferm. 2006;59:279-84.
7. Rogenski NMB, Santos VLCG. Estudo sobre a incidência de úlcera por pressão em um hospital universitário. Rev. Latino-A.m. Enfermagem. 2005;13:474-80.
8. Fernandes LM, Caliri MHL. Using the Braden and Glasgow scales to predict pressure ulcer risk in patients hospitalized at intensive care units. Rev. Latino-Am. Enfermagem. 2008;16(6):973-8.
9. Schoonhoven L, Grobbee DE, Bousema MT, Buskens E. Predicting pressure ulcers: cases missed using a new clinical prediction rule. J Adv Nurs. 2005;49:16-22. 10. Norton D. Calculating the risk: reflections on the Norton scale. Adv Wound Care. 1996;9:38-43.
11. Bergstrom N, Braden B, Laguzza A. The Braden scale for predicting pressure sore risk. Nurs Res. 1987;36:205-210.
12. Paranhos WY, Santos VLCG. Avaliação de risco
para úlceras de pressão por meio da Escala de
Braden, na língua portuguesa. Rev Esc Enferm USP. 1999;33:191-206.
13. Ayello EA, Braden B. How and why to do pressure ulcer risk assessment. Adv Skin & Wound Care. 2002;15(3):125-33.
14. Bergstrom N, Braden BJ. Predictive validity of the scale among black and white subjects. Nurs Res. 2002;51:398-403.
15. Waters N. Predicting pressure ulcer risk. Nurs Times. 2003;99-S:63-5.
16. Serpa LF, Santos VLCG. Assessment of the nutritional risk for pressure ulcer development through Braden Scale. Wound Ostomy and Continence Nurs J. 2007;34(3S):S4-S5.
Serpa LF, Santos VLCG, Campanili TCGF, Queiroz M.
18. Halkin A, Reichman M, Schwarber M, Paltiel O, Brezis M. Likelihood ratios: getting diagnostics testing into perspective. QJM. 1998;91:247-58.
19. Schoonhoven L, Haalboom JRE, Bousema MT, Algra A, Grobbee DE, Grypdonck MH. Prospective cohort study of routine use of risk assessment scales for prediction of pressure ulcers. BMJ. 2002;325:797-9.
20. Fernandez LM, Caliri MHL. Úlcera de pressão em
pacientes críticos hospitalizados - uma revisão integrativa da literatura. Rev Paul Enferm. 2000;19:25-31.
21. Costa IG, Caliri MHL. Incidência de úlcera de
pressão em centro de terapia intensiva de um hospital universitário e fatores de risco relacionados. Rev Paul Enferm. 2004;23:202-7.
22. Kwong E, Pang S, Wong T, Ho J, Shao-ling X, Li-Jun T. Predicting pressure ulcer risk with the modified Braden, Braden, and Norton scales in acute care hospitals in Mainland China. Appl Nurs Res. 2005;18:122-8.
23. Jalali R, Rezaie M. Predicting pressure ulcer risk: comparing the predictive validity of 4 scales. Adv Skin Wound Care. 2005;18:92-7.
24. Fife C, Otto G, Capsuto EG, Brandt K, Lyssy K, Murphy
K, Short C. Incidence of pressure ulcers in neurologic intensive care unit. Crit Care Med. 2001;29:283-90. 25. Lewicki JL, Mion LC, Secic M. Sensitivity and specificity of the Braden scale in the cardiac surgical population. J Wound Ostomy Continence Nurs. 2000;27:36-45. 26. National Pressure Ulcer Advisory Panel (NPUAP). NPUAP Announces the Release of the NPUAP-EPUAP
Guidelines for Pressure Ulcer Prevention and Treatment. [acesso 19 abr 2010]. Disponível em: http://www. npuap.org/Guidelines%20Flyer.pdf. Available on april 19th 2010.
27. Bolton L. Which pressure ulcer risk assessment scales are valid for use in the clinical setting. J Wound Ostomy Continence Nurs. 2007;34(4)368-81.
Received: Ago. 4th 2009