www.elsevier.com/locate/ssscie
Optical and electrical properties of barium titanate-hydroxyapatite
composite screen-printed thick films
A.F.L. Almeida
a,b, P.B.A. Fechine
a,b, J.M. Sasaki
d, A.P. Ayala
d, J.C. Góes
b,
D.L. Pontes
a, W. Margulis
c, A.S.B. Sombra
b,∗aDepartamento de Quimica Orgânica e Inorgânica-UFC, Caixa Postal 6030, CEP 60455-760, Fortaleza, Ceará, Brazil
bLaboratório de Telecomunicações e Ciência e Engenharia dos Materiais (LOCEM), Departamento de Física, Universidade Federal do Ceará,
Caixa Postal 6030, CEP 60455-760, Fortaleza, Ceará, Brazil1
cAcreo, Electrum 236, 16440 Kista, Sweden
dDepartamento de Física, Universidade Federal do Ceará, Caixa Postal 6030, CEP 60455-760, Fortaleza, Ceará, Brazil
Received 1 July 2003; received in revised form 19 November 2003; accepted 10 December 2003
Abstract
In this paper we will study the effect of the presence of hydroxyapatite (HA—Ca10(PO4)6(OH)2) on the dielectric permittivity and losses of the barium titanate (BTO—BaTiO3) thick films. These films were prepared in two layers geometry using the screen printing technique on Al2O3substrates. Mechanical alloying has been used successfully to produce nanocrystalline powders of hydroxyapatite (HA) used in the films. We also look for the effect of the grain size of the BTO and HA on the final properties of the film. The samples were studied using X-ray diffraction, scanning electron microscopy (SEM), Raman and infrared spectroscopies, dielectric permittivity and losses measurements. The study of the dielectric permittivity and losses was done in the radio-frequency range (100 Hz–10 MHz). The role played by the firing process in the film preparation and the crystallite size of HA and BTO on the dielectric constant and structural properties of the films are discussed.
2004 Elsevier SAS. All rights reserved.
1. Introduction
Ferroelectric thin films of thickness below 1 µm have been extensively investigated due to their potential appli-cations in microelectronics and micromechanics. However, less attention has been directed to processing of thicker films. A reasonable number of applications require films of several microns to several tens of microns. Whereas ferro-electric thin films methods have their specific features, fer-roelectric thick films processing is closer to that of the bulk ceramics, including powder synthesis, powder processing, coating and sintering. Coating is obtained by screen printing, a well developed processing step in thick film technology.
Applications of ferroelectric thick films include pyro-electric sensors [1,2], gravimetric sensors [3], micropumps [4], pressure sensors [5] and surface acoustic wave sensors (SAW) [6] devices. Properties obtained are poorer compared
*Corresponding author.
E-mail address:[email protected] (A.S.B. Sombra).
1http://www.locem.ufc.br.
to the bulk ceramics due to the addition of low temperature sintering aids and/or high porosity.
Most multichip modules (MCM’s) fabricated today re-quire decoupling capacitors to suppress the power distribu-tion noise [7,8]. These surface mount capacitors are large in size, occupy space and have large parasitic capacitance. Ma-terials with relative dielectric constant in the range of 25–170 are required for advanced decoupling capacitors. Compos-ite materials consisting of ferroelectric ceramics and poly-mers have aroused much attention for advanced capacitors because their properties can be adjusted by changing the fractions of the constituents. Epoxy is a suitable polymer for its compatibility with PWB’s (Printed Wiring Board). Epoxy materials are not attacked by the electroless plating solution of the capacitor electrodes.
Barium titanate (BaTiO3—BTO), a well-known ferro-electric material, has a high diferro-electric (DC) constant (K) around 6000 at a fine grain size of∼1 µm, and of 1500–2000 at a coarse grain size [9,10]. The DC of BTO at the Curie temperature of 120◦C can reach a peak value as high as 10.000, but decreases as the temperature decreases.
crease of the DC is possibly caused by a summation of the domain size and the stress effect [13]. It is also mentioned that the width of ferroelectric 90◦domains decrease
propor-tional to the square root of the grain diameter for grains with size <10 µm [13]. The removal of grain boundaries, i.e.,
elimination of constrained forces from neighboring grains and a drop in domain density as the particle size decreases, may reduce the DC of the BTO powders. With increas-ing particle size, unsintered powder eventually becomes a ceramic-like body and possesses similar properties as the ce-ramics [14]. Therefore, cece-ramics and powders of BTO can show a different dielectric behavior, depending on the parti-cle size.
In this study, we will use two different ceramics in the preparation of thick films. The first ceramic will be BTO, which was already presented. The second crystalline phase will be in the form of calcium phosphate based bioceramics, mainly in the form of hydroxyapatite (HA) (Ca10(PO4)6(OH)2). The space group of HA (which is a non-ferroelectric material) has been determined by X-ray diffraction methods to beP63/m, the same as fluoroapatite,
but theoretical considerations suggests the space group of HA to beP63[15].
Several processes [16,17] are used to produce HA of wide application as a temporary substitute for the human bone [17–21]. The hydrothermal method has been widely used [9] for the preparation of materials for prosthetic pur-poses. These materials are attractive for various applications including coatings of orthopedic and dental implants, alve-olar ridge augmentation, maxillofacial surgery, otalve-olaryngol- otolaryngol-ogy and scaffolds for bone growth and as powders in total hip and knee surgery.
In this paper we will study the effect of the presence of HA on the dielectric and optical properties of the BTO thick film. We also look for the effect of the grain size of the BTO and HA in the final properties of the thick film. Our study is trying to understand the dielectric properties of BTO+HA thick films. We did a study of the dielectric functionε33 of the samples. The role played by firing process of the film and the role played by the HA in the optical properties of the film is discussed.
ration [22]. For this reaction the material was ground on a Fritsch Pulverisette 6 planetary mill with the stoichiomet-ric amounts given in the above equation. Milling was per-formed in sealed stainless steel vials and balls under air, with 370 rpm as rotation speed. The powder mass to the ball mass ratio used in all the experiments was near 1/9. To
avoid excessive heat the milling was performed in 60 min milling steps with 30 min pauses. Mechanical alloying was performed for 60 h of milling to produce the ceramic HAP3-60.
2.2. BTO powder preparation
The used BTO powder was a commercial product (Ba-TiO3-Aldrich), for series A the commercial powder was sub-mitted to mechanical milling, in the same experimental con-ditions described before for HA. For series B the commercial powder was used directly without no extra milling.
2.3. Paste preparation
The paste was prepared from the suspension of organic material (resin, organic solvent and some additive to improve rheological behavior of the paste) and powders (BTO+HA), in ratio 30:70. To have a better adhesion between paste and substrate (Al2O3) it was added a low temperature melting glass in powder form.
2.4. Substrates and electrodes
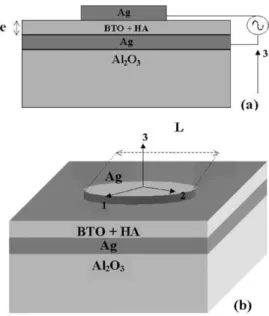
Alumina substrates were used as a commercial product (Engecer). The electrode material were produced by the screen printing technique (Joint Metal-PC200) in the geom-etry described in Fig. 1.
2.5. Preparation of the films
Fig. 1. A rectangular coordinate assigned to the sample for the measurement of the dielectric constant and loss in the thick film structure.
Table 1
The films in the A and B series were subjected to different firing process (see text)
Sample BTO HA Sample
BTO100A BTO100B 100 0 BTO100AT BTO100BT
BTO85A BTO85B 85 15 BTO85AT BTO85BT
BTO70A BTO70B 70 30 BTO70AT BTO70BT
BTO30A BTO30B 30 70 BTO30AT BTO30BT
BTO10A BTO10B 10 90 BTO10AT BTO10BT
obtained films usually had thickness that ranged from 20 to 400 µm, depending on the number of layers. All the films used in these measurements were composed of two layers.
We prepared different samples with different BTO and HA compositions. One has two main series called A and B (Table 1). In series B one use commercial BTO without mechanical milling. For series A one use commercial BTO with 10 h of mechanical milling. In both series one use HA obtained through mechanical milling as described before. For both series the indication of the samples is associated to the label BTO(Y) withY =100, 85, 70, 30, 10 (%) which is the percentage of BaTiO3in the film (see Table 1).
For the films in the A series BTO(Y)A (see Table 1),
the film was subjected to the firing process: 100◦C for
1 h+400◦C for 1 h+800◦C for 1 h (for both layers). For the films of the B in series BTO(Y)B, the film was
subjected to the firing process: 100◦C for 1 h+400◦C for
1 h+850◦C for 1 h (for both layers).
For the series BTO(Y)AT and BTO(Y)BT the process
is the same as form film BTO(Y)A and BTO(Y)B with an
additional firing at 850◦C for 4 h.
2.6. X-ray diffraction
The X-ray diffraction (XRD) patterns were obtained at room temperature (300 K) by step scanning using powdered
samples. We used five seconds for each step of counting time, with a Cu-Kα tube at 40 kV and 25 mA using the
geometry of Bragg-Brentano. The output data extracted from Rietveld refinement [23] is used to calculate the particle size. The analysis of the crystallite size (Lc) has been done for all samples using the Scherrer’s equation [24],
Lc= kλ
βcosθ,
wherekis the shape coefficient (value between 0.9 and 1.0), λ is the wave length,β is the full width at half maximum
(FWHM) of each phase and θ is the diffraction angle. For
this purpose, we chose the single peak near 31.62 degree within the pattern and according to the space group of BTO and 25.84 for HA. We have used the LaB6 (SRM 660, National Institute of Standard Technology) powder standard pattern to determine the instrumental width and afterward to calculate the crystallite size via first equation. The β
parameter has to be correct using the following equation:
β=
wexp2 −w2inst,
where wexp, winst are the experimental and instrumental width, respectively, obtained from LaB6 powder standard pattern using the following expression:
winst=Utan2θ+Vtanθ+W ,
whereU,V andW were obtained from output file extracted
from Rietveld refinement parameters of LaB6 sample. The crystallite size for the milled ceramic and for the film was obtained, assuming coefficientk=1.
2.7. Scanning electron microscopy
The photomicrograph of the films of BTO+HA, were obtained on a Scanning Electron Microscope, Phillips XL-30, operated in the range of 12 to 20 keV, for rectangular samples, covered with a layer of carbon of 30 nm of thickness.
2.8. Dielectric measurements
The dielectric measurements were obtained from a HP 4291A Material Impedance Analyzer in conjunction with a HP 4194 Impedance Analyzer, which jointly cover the region of 100 Hz to 1.8 GHz. In Fig. 1 one has the sample geometry we used for the dielectric and piezoelectric measurements. Rectangular coordinates are assigned to the samples as shown in Fig. 1. The 1–2 plane is the sample plane, and the 3-axis is perpendicular to the plane of the sample. The electrodes are circular (Ag) prepared using the screen printing technique.
2.9. Infrared spectroscopy
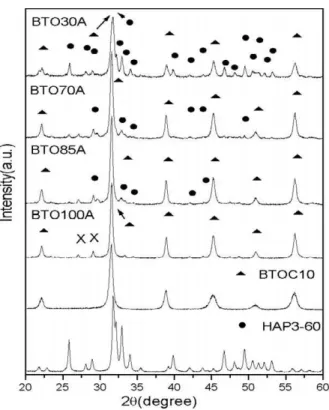
Fig. 2. X-ray diffraction of he HAP3-60, BTOC10 powders and BTO100A, BTO85A, BTO70A, BTO30A thick films.
composition. The pellet thickness varied from 0.5–0.6 mm. The IR spectra were measured from 400–1400 cm−1with a
Nicolet 5ZPX FT-IR spectrometer.
2.10. Raman spectroscopy
Micro-Raman measurements were performed using a T64000 Jobin Yvon spectrometer equipped with an N2-cooled charge coupled device (CCD) to detect the scattered light. The spectra were excited with an argon-ion laser (4880 Å). The spectrometer slits were set to give a spectral resolution always better than 2 cm−1. The Raman scattering was measured in a back scattering geometry directly from the powder.
3. Results and discussion
3.1. X-ray diffraction
Figs. 2 and 3 show X-ray diffraction (XRD) patterns of the films in series A and B together with the XRD of the powders (see Table 1). In Fig. 2 one has the XRD of series A (see Table 1) together with the XRD of the BTOC10 (commercial powder, milled for 10 h) and HAP3-60 which is the HA powder used in the film preparation (as discussed before). For the BTOC10 powder, the crystallite size is estimated as 18.1 nm (see Table 2). In the same figure one starts with the XRD of sample BTO100A. For this sample one can easily notice all the peaks associated
Fig. 3. X-ray diffraction of he HAP3-60, BTOC powders and BTO100B, BTO85B, BTO70B, BTO30B, BTO10B thick films.
to BTO. However, the crystallite size associated to BTO is around 28.8 nm (see Table 2). One can associate the increase of the grain size to the firing process that the film was submitted. One can also notice the presence of two weak peaks (X), that are probably associated to the presence of the flux material (powder glass) that was used to improve the adhesion between the paste and the substrate. If one starts increasing the amount of HA the peaks associated to this phase (HA) increase. For sample BTO70A they are easily identified and at BTO30A, the presence of HA is quite clear. Initially the crystallite size of the BTO increases from 18 to 29 and is maintained around this value.
In Fig. 3 one has the XRD of series B (see Table 1) together with the XRD of the BTOC (commercial powder, grain<2 µm) and HAP3-60 which is the HA powder used
in the film preparation. For the BTOC powder, the crystallite size is estimated as 57.7 nm (see Table 2). One can also notice that the peak located at 45.5◦ is broad with the
Table 2
Dielectric permittivity measurements, thickness (e), dielectric permittivity (K), and dielectric loss (D) and the crystallite size obtained from the X-ray
diffraction (Figs. 2 and 3) of the thick films samples and powders. The experimental error in the crystallite size is around±3 nm
Samples Thicknessc Densityρ K ε′33/ε0 D ε′′33/ε33′ Crystallite size Samples K ε′33/ε0 D ε33′′/ε33′
(µm) (g cm−3) (1 kHz) (1 kHz) (nm) (1 kHz) (1 kHz)
BTOC 57.7
BTOC10 18.1
HAP3-60 41.7
BTO100A 117 24.4 0.019 28.8 BTO100AT 22.9 0.81
BTO85A 213 23.7 0.007 28.4 BTO85AT 37.5 0.74
BTO70A 188 14.9 0.002 27.8 BTO70AT 50.1 1.65
BTO30A 85 3.47 0.01 24.5 BTO30AT 6.7 1.15
BTO100B 234 3.09 105 0.051 61.8 BTO100BT 202 3.15
BTO85B 327 2.57 40.8 0.006 62.4 BTO85BT 104 1.38
BTO70B 129 1.71 13.5 0.009 59.7 BTO70BT 19 0.79
BTO30B 199 1.13 5.7 0.008 54.7 BTO30BT 11.1 0.88
BTO10B 403 4.68 0.037 54.3 BTO30BT
BTO100BTC 147 92.7 0.006
BTO100BTD 176 78.4 0.085
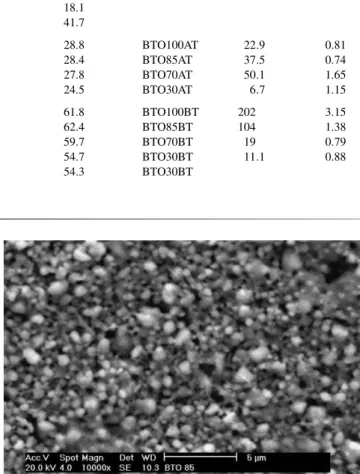
Fig. 4. Scanning electron photomicrograph of the BTO100B thick film (10.000×).
associate the increase of the grain size to the firing process to which the film was submitted. If one starts increasing the amount of HA the peaks associated to this phase increase. For sample BTO10B, the presence of HA is quite clear. The crystallite size of the BTO is around from 54 until 62 nm in the films of this series.
3.2. Scanning electron microscopy
The particle morphology of the films was investigated by means of SEM. In Figs. 4, 6 and 8 one has the sample BTO100B and Figs. 5, 7 and 9 are associated to sample BTO85B. Comparing Figs. 4 and 5 one can notice that the scanning electron photomicrograph of the films revealed a spherical morphology for the synthesized particles in film BTO85B (Fig. 5) and the presence of cylinder shaped grains for the BTO100B sample. This is confirmed when one compares Figs. 6 and 7. Figs. 8 and 9 show the scanning electron photomicrography of the
Fig. 5. Scanning electron photomicrograph of composite thick film BTO85B (10.000×).
Fig. 6. Scanning electron photomicrograph of the BTO100B thick film (5000×).
Fig. 7. Scanning electron photomicrograph of composite thick film BTO85B (5000×).
Fig. 8. Scanning electron photomicrograph of the BTO100B thick film (2000×).
Fig. 9. Scanning electron photomicrograph of composite thick film BTO85B (2000×).
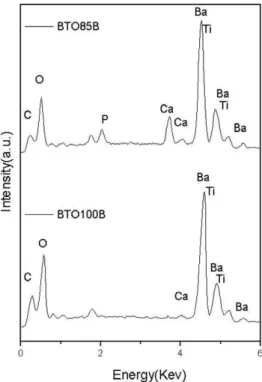
BTO100B film compared to the BTO85B film. Energy-dispersive spectroscopy (EDS) analysis (Fig. 10) showed that the main elements of the BTO100B were carbon, oxygen, barium and titanium. For the BTO85B film one has to include calcium and phosphorus. The EDS of a
Fig. 10. Energy dispersive spectroscopy in the thick film BTO100B: Ba/Ti=1.47 and thick film of BTO85B: Ba/Ti=1.42 and Ca/P=2.78.
crystal, present in the BTO100B film showed a mass ratio Ba/Ti=1.47 (Fig. 10), whereas it is Ba/Ti=1.42 for the
BTO85B. This is half of the expected value when compared to Ba/Ti=2.86 for the nominal BTO. We believe that the
BTO used is presenting an excess of Ti. Excess of TiO2, in BTO preparation, results in the formation of separate phases like Ba6Ti17O4 and this forms a eutectic with BTO [25]. However, the presence of others phases in the BTO used was not detected (see Figs. 2 and 3). For the BTO85B (see Fig. 10) where one has the presence of HA, the theoretical mass ratio is around Ca/P =2.15 and one actually has
Ca/P=2.78, which is in reasonable agreement with the
expected value.
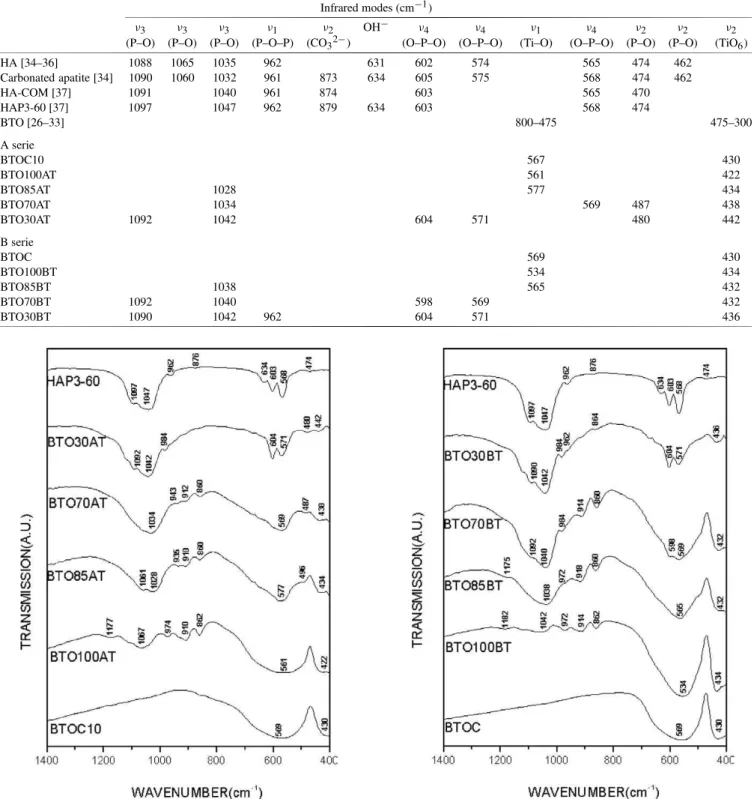
3.3. Infrared spectroscopy
Figs. 11 and 12 display the infrared absorptions related to series A and B together with the absorptions of the powders (see Table 3). In Fig. 11 one has the spectra of the BTOC10 (Commercial Powder, milled for 10 h) and HAP3-60. The main absorptions modes associated to BTO and HA are observed. The absorptions associated to BTO are
ν1(Ti–O), TO mode at 800 to 475 cm−1andν2(TiO6), LO mode at 475 to 300 cm−1, of the according to the literature
Table 3
Infrared modes of series A and B
Infrared modes (cm−1)
ν3 ν3 ν3 ν1 ν2 OH− ν4 ν4 ν1 ν4 ν2 ν2 ν2
(P–O) (P–O) (P–O) (P–O–P) (CO32−) (O–P–O) (O–P–O) (Ti–O) (O–P–O) (P–O) (P–O) (TiO6)
HA [34–36] 1088 1065 1035 962 631 602 574 565 474 462
Carbonated apatite [34] 1090 1060 1032 961 873 634 605 575 568 474 462
HA-COM [37] 1091 1040 961 874 603 565 470
HAP3-60 [37] 1097 1047 962 879 634 603 568 474
BTO [26–33] 800–475 475–300
A serie
BTOC10 567 430
BTO100AT 561 422
BTO85AT 1028 577 434
BTO70AT 1034 569 487 438
BTO30AT 1092 1042 604 571 480 442
B serie
BTOC 569 430
BTO100BT 534 434
BTO85BT 1038 565 432
BTO70BT 1092 1040 598 569 432
BTO30BT 1090 1042 962 604 571 436
Fig. 11. Infrared spectra of the films BTO(Y)AT compared with the IR of the starting materials (BTOC10, HAP3-60).
ν3(P–O). The modes at 879 cm−1attributed toν3(CO32−). The vibrations associated to free OH− is detected by the
modes at 634 cm−1. The modes at 603 and 568 cm−1 can
be attributed to the vibrations associated to ν4 (O–P–O). The mode at 474 cm−1is attributed to ν
2 (P–O) [37] (see
Fig. 12. Infrared spectra of the films BTO(Y)BT compared with the IR of
the starting materials (BTOC, HAP3-60).
Table 3 and Figs. 11 and 12). One can notice for sample BTO100AT, the characteristic absorptions modes of BTO, 561 and 422 cm−1. One can also notice the presence of
weak absorptions, 1177, 1067, 974, 910 and 862 cm−1 for
Fig. 13. Raman spectra of the films BTO(Y)AT compared with the Raman of the starting materials (BTOC10, HAP3-60).
BTO85AT and 943, 912, 860 and 487 cm−1for BTO70AT
and still 984 and 480 cm−1for BTO30AT, that are probably
associated to the presence of the flux material (powder glass) that was used to improve the adhesion between the paste and the substrate (see Table 3). In the same figure one can see of the vibrations associated to HAP3-60 and BTOC10 for the samples BTO85AT, BTO70AT and BTO30AT.
In Fig. 12, one has the spectra of the series B (see Ta-ble 3) together with the spectra of the BTOC (commercial powder, without extra milling). Similar behavior is observed for the samples of the B series with characteristic absorp-tions modes of BTOC and HAP3-60. Samples BTO100BT, BTO85BT, BTO70BT and BTO30BT also shows extra ab-sorptions observed in A series (see Fig. 11). We can also associate this absorptions to the of the flux material (powder glass) that was used to improve the adhesion between the paste the substrate (see also Table 2).
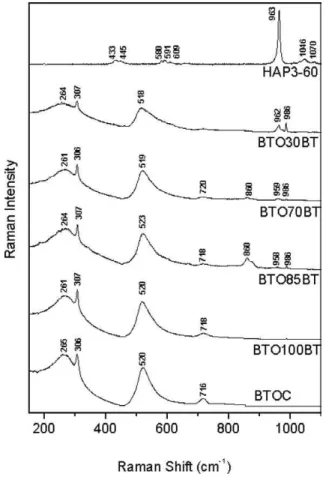
3.4. Raman spectroscopy
In Figs. 13 and 14 one has the Raman spectra related to the films in series A and B together with the Raman modes of the starting materials (see Table 4). In Fig. 13 one has the spectra of the films in A series (see Table 4) together with the spectra of the BTOC10 and HAP3-60. From Table 4 one can say that the Raman modes associated
Fig. 14. Raman spectra of the films BTO(Y)BT compared with the Raman
of the starting materials (BTOC, HAP3-60).
to BTO are: a very broad mode at 264 cm−1 ν4 (TiO6), the mode ν2 (TiO6) at 307 cm−1,ν1 (TiO6) at 519 cm−1 and ν1 (TiO6) at 717 cm−1 [26,27,38,39] (see Table 4). The mode at 264 cm−1 is attributed to a LO mode, and the mode at approximately 717 cm−1 is associated with the highest frequency LO mode of A1 symmetry [27]. The mode located at 307 cm−1 is assigned to the B1 mode.
It decreases in intensity with the increase of temperature, and this mode disappeares above TC, where the structure
becomes a cubic. Many researchers believe that the Raman mode is characteristic of the tetragonal BaTiO3[27,38–40]. The vibration observed at 519 cm−1 is assigned to a TO
vibration [26]. The mode at 264 cm−1is strongly affected by
the with the presence of HA. The amplitude decreases, being accompanied by an obvious flattening and displacement towards lower frequencies. This effect could be explained in terms of the grain size [27]. The characteristic Raman modes of the HA are observed [37,41,42] (see Table 4). The modes at 433 and 445 cm−1 are associated to vibrations
assigned to ν2 (O–P–O). The vibrations modes at 580, 591 and 609 cm−1 are modes ν
4 (O–P–O). The mode ν1 (O–P–O) has been assigned to the line at 963 cm−1, being
Ta bl e 4 Ram an m odes of ser ies A and B Ram an m odes (cm − 1) ν3 ν3 ν3 ν3 ν1 ν1 ν1 ν4 ν4 ν4 ν1 ν2 ν2 ν2 ν4 (P–O) (P–O) (P–O) (P–O) (P–O–P) (P–O–P) (T iO6 ) (O–P–O) (O–P–O) (O–P–O) (T iO6 ) (O–P–O) (O–P–O) (T iO6 )( T iO6 ) HA [34–36] 1075 1061 1053 1028 962 948 608 593 580 447 432 Carbonated apatite [37, 42] 1075 1070 1048 1029 962 948 608 592 584 448 432 HA-COM [37, 41, 42] 1072 1046 1029 959 608 590 577 445 432 HAP3-60 [37] 1070 1046 963 609 591 580 445 433 BT O [26, 27, 38–40] 717 519 307 264 As er ie BTO C 10 716 520 310 BT O100A T 715 518 306 255 BT O85A T 724 619 520 305 257 BT O70A T 962 725 621 594 519 308 256 BT O30A T 1078 1040 963 589 579 519 303 245 Bs er ie BTO C 717 520 306 265 BT O100BT 718 520 307 261 BT O85BT 958 718 523 307 264 BT O70BT 959 720 519 306 261 BT O30BT 962 518 307 264
Fig. 15. Dielectric permittivity (K) as a function of frequency of the
BTO(Y)A series.
some figure one can see the vibrations associated to the films BTO100AT, BTO85AT, BTO70AT and BTO30AT (see Table 4 and Fig. 13). In the same figure one can see the modes in 985 and 863 cm−1in the samples BTO85AT and
BTO70AT. They are not associated to BTO or HA and could be probably associated to the presence of the flux material (powder glass).
In Fig. 14, one has the spectra of series B (see also Table 4) together with the spectra of the BTOC (commercial powder, without no extra milling). The Raman spectra of the B series is similar to the A series. However, for this series the BTOC spectra is sharper when compared with the spectra of ample BTOC10 (Fig. 13). This is probably associated to the bigger crystallite size of the commercial barium titanate (BTOC) compared to the milled one (BTOC10). Extra Raman modes at 860 and 986 cm−1were also observed in
the films BTO85BT, BTO70BT and BTO30BT (see Table 4 and Fig. 14). In the B series the Raman spectra present more sharp peaks when compared with A series. This could be explained by the bigger crystalline size used in the BTO used in B series, as discussed before, indicating that starting crystalline size of the precursors is fundamental for the future characteristics of the films.
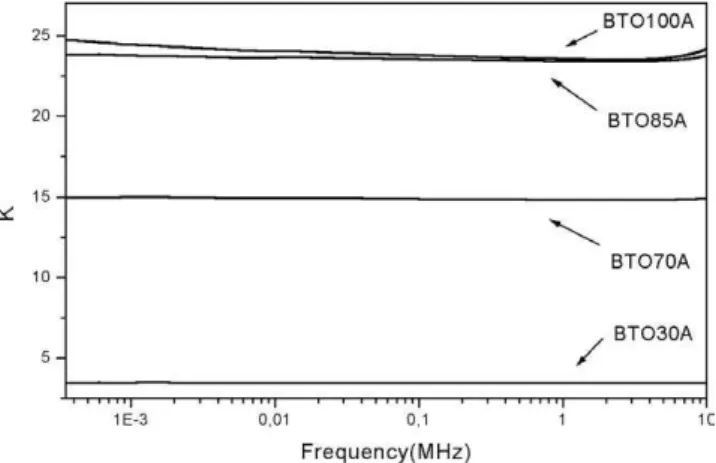
3.5. Dielectric measurements
In Fig. 1 one has the sample geometry we used for the dielectric measurements. Rectangular coordinates are assigned to the samples. The thickness of each film is given in Table 2. The electrode diameter is around 1 cm for all the films.
In Fig. 15 one has the dielectric constant (DC) measure-ments of the films in series A. One can notice that, as we start increasing the HA content, the DC decreases. This is an expected result because the DC of HA at 1 kHz, was re-ported in the literature to be around 5.8 [43]. In this situation the increase of HA concentration leads to the decrease of the DC of the composite film. The dielectric loss of this series is low, with the average value aroundD=0.05 (see Table 2).
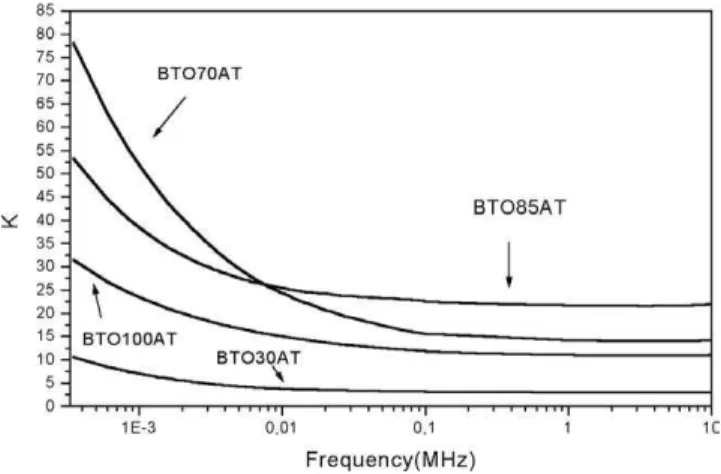
Fig. 16. Dielectric permittivity (K) as a function of frequency of the
BTO(Y)AT series.
from 24.4 to 3.47 in sample BTO30A (see Table 2). The other important point is that the increase of HA content lead to a decrease of the density(ρ)of the film, taking into
ac-count that the density of BTO ceramic is around 5.7 g cm−3
and HA is around 3.16 g cm−3. We have to emphasize that
this behavior also happens in series B (see Table 2) where the film density decreases from 3.09 (BTO100B) to 1.13 g cm−3
(BTO30B) (see Table 2).
When one submit the same A series to an extra firing process, which will result in AT series (see Fig. 16 and Tables 1 and 2), one can notice that the DC of the BTO film does not increase. For sample BTO100AT the DC at 1 kHz is around 22.9 which is almost the same value obtained for the BTO100A film (see Table 2). However, the dielectric loss is much higher. For the BTO100AT, it is around 0.81, which is one order of magnitude higher compared to BTO100A. If one compares the series AT with series A (in Table 2) one can conclude that the DC does not increase much, but the loss increase in between one to two orders of magnitude. However, one can notice that for the film BTO70AT the DC is higher (K =50) compared to the pure BTO film (BTO100AT,K=22.9) see Fig. 16 and Table 2. In Fig. 17
one has the dielectric constant (DC) measurements of the films in series B. The DC for this situation is higher compared to series A, because of the crystallite size of the starting BTO (26 nm). One can also notice that the same behavior observed at series A is happening again. As we start increasing the HA content, the DC decreases. In this situation the increase of HA concentration leads to the decrease of the DC of the composite film. The dielectric loss of this series is low, with the average value aroundD=0.04
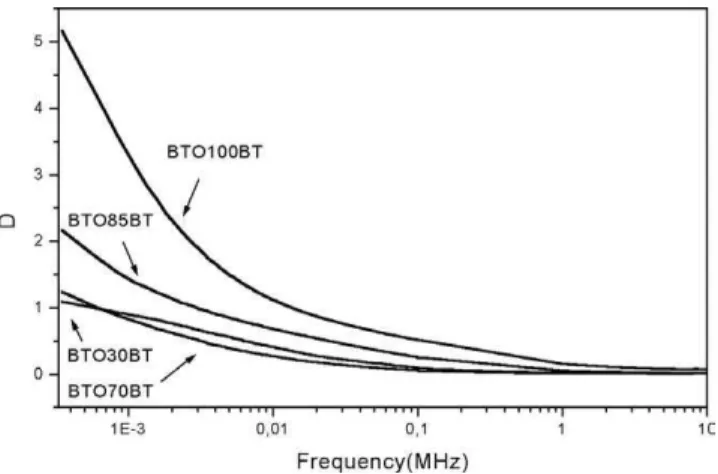
(see Table 2). At 1 kHz frequency, one can notice that the DC decreases from 105 to 4.6 in sample BTO10A. In Fig. 18 one has the dielectric loss for the B series. One can notice that there is a minimum inDfor frequencies around 1 MHz, and
the BTO100B film presents the highest loss compared with the films containing HA.
When one submit the same B series to an extra firing process, which will result in BT series (see Fig. 19 and
Fig. 17. Dielectric permittivity (K) as a function of frequency of the BTO(Y)B series.
Fig. 18. Dielectric loss (D) as a function of frequency of the BTO(Y)B
series.
Fig. 19. Dielectric permittivity (K) as a function of frequency of the BTO(Y)BT series.
Tables 1 and 2), one can notice that the DC of the BTO film increases. For sample BTO100BT the DC at 1 kHz is around 202 which is almost twice the value obtained for the BTO100B film (see Table 2). However, the dielectric loss is much higher. In Fig. 20 one has the dielectric loss of the BTO(Y)BT series. The loss is higher for the BTO100BT
Fig. 20. Dielectric loss (D) as a function of frequency of the BTO(Y)BT
series.
of magnitude higher compared to BTO100B. The stronger increase of the DC for series B is associated to the crystallite size of the commercial powder in the beginning of the firing process of the film. For the B series, the crystallite size is bigger compared to series A and the firing process was done at higher temperatures.
In a general view, the increase of HA concentration will lead to a decrease the DC. However, some unexpected situations occur, where the presence of HA could increase the DC, which was observed in series AT for sample BTO70AT. For that film the addition of HA at 15% and 30% lead to an increase of the DC of the BTO film (BTO100AT) from 22.9 to 37.5 and 50.1, respectively (see Table 2 and Fig. 16). A further increase of the HA concentration lead to a decrease of the DC of the film (see Fig. 16).
4. Conclusions
In this paper we carried out a study of the effect of the presence of hydroxyapatite (HA) on the dielectric and opti-cal properties of the barium titanate (BTO) thick film. The films were prepared in two layers using the screen print-ing technique on Al2O3substrates. Mechanical alloying has been used successfully to produce nanocrystalline powders of hydroxyapatite (HA) to be used in the films. We also look for the effect of the grain size of the BaTiO3—BTO and HA in the final properties of the film. The samples were stud-ied using X-ray diffraction, scanning electron microscopy (SEM), Raman and infrared spectroscopies and dielectric measurements. We did a study of the dielectric function
ε33and dielectric loss of the samples. The X-ray diffraction (XRD) patterns of the films indicate that all the peaks asso-ciated to BTO phase are present in the films in the tetragonal phase. One can also notice an increase of the crystallite size with respect to the firing process to which the film was sub-mitted.
The particle morphology of the films was investigated by means of SEM. For the BTO films and composite films a spherical morphology was observed for the synthesized
particles by SEM. However, for the BTO films the presence of cylinder shaped grains was detected.
Energy-dispersive spectroscopy (EDS) analysis showed that the main elements of the BTO film were carbon, oxygen, barium and titanium. For the composite film one has to include calcium and phosphorus. The EDS of a crystal, present in the BTO film showed a mass ratio Ba/Ti=1.47,
whereas it is Ba/Ti=1.42 for the composite film. We
believe that used BTO is presenting an excess of Ti in the structure. For the composite film where one has the presence of HA the mass ratio expected is around Ca/P=2.15 and
one actually has Ca/P=2.78, which is good agreement with
the expected value. It was also observed that the increase of HA concentration lead to the decrease of the density and the dielectric constant (DC) of the composite film.
The main infrared absorptions modes associated to BTO and HA are observed. For the A series, extra IR modes at 860, 912, 972, 1039 and 1099 cm−1for the BTO100A film
and 858 and 914 cm−1for the BTO85A and BTO70A were
observed. These modes are not detected for B series. This behavior could be associated to the fact that for A series the crystallite size of BTO (BTOC crystallite size is 13.4 nm) is lower compared to series B (BTOC crystallite size is around 26 nm), see also Table 2. This lower size could interfere in reaction with the flux material resulting in the existence of extra absorptions.
The main Raman modes associated to BTO and HA are observed. However, extra Raman modes at 860 and 986 cm−1were observed in the films BTO85BT, BTO70BT
and BTO30BT for B series and modes in 985 and 863 cm−1
in the samples BTO85AT and BTO70AT in A series were observed. These modes could have the same origin of the IR modes. They are probably associated to a solid state reaction with the flux material.
Looking now for high DC and low loss film, which is the best options for use in microwave devices like dielectric resonators, one has to find a balance between the content of HA and BTO. In a general view, the increase of HA concentration will lead to a decrease the DC and loss at the same time. However, some equilibrium situations are present, where the presence of HA could increase the DC, which was observed in series AT for sample BTO70AT. For that film the addition of HA at 30% lead to an increase of the DC of the BTO film 22.9 to 50.1 and an increase of the loss of the film as well. This strongly suggests that the screen-printing composite BTO-HA thick films are good candidates for applications where one are looking for high DC materials with low loss.
Acknowledgements
Symposium on Advanced Packaging Materials, 1997, p. 68. [9] K. Kinoshita, A. Yamaji, J. Appl. Phys. 47 (1976) 371.
[10] W.R. Buessem, L.E. Cross, A.K. Goswami, J. Am. Ceram. Soc. 49 (1966) 33.
[11] F.S. Yen, H.I. Hsiang, Jpn. J. Appl. Phys. 34 (1995) 6149. [12] H.I. Hsiang, F.S. Yen, J. Am. Ceram. Soc. 79 (1996) 1053. [13] G. Arlt, D. Hennings, G.J. With, J. Appl. Phys. 58 (1985) 1619. [14] H.I. Hsiang, F.S. Yen, Jpn. J. Appl. Phys. 32 (1993) 5029. [15] K. Sudarsanan, Acta Crystallogr. B 25 (1969) 1534. [16] M.J. Yaszemsk, et al., Biomaterials 17 (1996) 175. [17] H.S. Liu, et al., Ceramics Internat. 23 (1997) 19. [18] G.F. Fernandes, et al., Quim. Nova 23 (2000) 441. [19] G. Heimke, Angew. Chem. 101 (1989) 111. [20] L.L. Hench, J. Am. Ceram. Soc. 74 (1991) 1487. [21] M.R. Bet, et al., Quim. Nova 20 (1997) 475.
[22] C.C. Silva, A.G. Pinheiro, M.A.R. Miranda, J.C. Góes, A.S.B. Som-bra, Solid State Sci. 5 (2003) 553.
[23] H.M. Rietveld, Acta Crystallogr. 22 (1967) 151.
[34] D.G.A. Nelson, B.E. Willianson, Aust. J. Chem. 35 (1982) 715. [35] W.L. Suchanek, P. Shuk, K. Byrappa, R.E. Riman, K.S. Te Huisan,
G.F. Janas, Biomaterials 23 (2002) 699.
[36] A. Bertoluza, G. Bottura, P. Taddei, A. Tinti, M.A. Morelli, J. Raman Spectrosc. 27 (1996) 759.
[37] C.C. Silva, Éstudos das propriedades Ópticas, Elétricas e Térmicas da Hidroxiapatita obtida por Moagem de Alta Energia, seus Compósitos e Filmes Espessos, PhD thesis, UFC, 2003.
[38] W.-S. Cho, J. Phys. Chem. Solids 59 (1998) 659. [39] C.H. Perry, D.B. Hall, Phys. Rev. Lett. 15 (1965) 700.
[40] E.W. Kreutz, J. Gottmann, M. Mergens, T. Klotzbücher, B. Vosseler, Surf. Coat. Technol. 116–119 (1999) 1219.
[41] Q.-y. He, X.-g. Tang, J.X. Zhang, I.-M. Wu, Nanostruct. Mater. 11 (1999) 287.
[42] C.G. Kontoyannis, N.C. Bouropoulos, P.G. Koutsoukos, Vibrac. Spec-trosc. 15 (1997) 693.