www.elsevier.com/locate/ssscie
Study of the electrical conductivity and piezoelectricity
in iron doped collagen films
V.O. Sousa Neto
a, C.C. Silva
a, A.F.L. Almeida
a, S.D. Figueiró
b, J.C. Góes
c,e,
J.A.C. de Paiva
e, C.E.C. Magalhães
d, A.S.B. Sombra
e,∗aDepartamento de Química Orgânica e Inorgânica, Centro de Ciências, UFC, Fortaleza, Ceará, Brazil
bDepartamento de Bioquímica e Biologia Molecular, Centro de Ciências, UFC, Fortaleza, Ceará, Brazil cDepartamento de Engenharia Mecânica, Centro de Tecnologia, UFC, Fortaleza, Ceará, Brazil dDepartamento de Química Analitica e Físico-Química, Centro de Ciências, UFC, Fortaleza, Ceará, Brazil
eLaboratório de Óptica não Linear e Ciência dos Materiais (LONLCM), Departamento de Física, Universidade Federal do Ceará,
Caixa Postal 6030, CEP 60455-760, Fortaleza, Ceará, Brazil
Received 2 May 2001; received in revised form 1 October 2001; accepted 8 October 2001
Abstract
In this paper we did a study of collagen membranes prepared with iron as an impurity. In this study one try to understand the function of the iron in the collagen structure in view of increasing the value of piezoelectric strain tensor elementd14. We prepared different samples
with different iron doping levels. One has samples doped by immersion in solutions of FeCl2at 0.1 M and 0.2 M (ColFeCl01 and ColFeCl02) and iron doped directly in solution with Fe2O3at 5% and 15% (Col7Fe5 and Col7Fe15). We did a study of the Mössbauer spectroscopy, DC
electrical conductivity and the piezoelectric strain tensor elementd14, the elastic constants55, and the dielectric functionε11of the samples.
The loss factorQ−1of the samples was also measured using the admittance resonance method. The role played by the iron in the different situations and the consequences for the transport properties is discussed.2002 Éditions scientifiques et médicales Elsevier SAS. All rights reserved.
Keywords: Collagen; Biofilms; Piezoelectricity; Biopiezoelectricity
1. Introduction
Collagen, which exists in a variety of morfological forms, is the most abundant structural protein of the animal con-nective tissue and has a long history as biomaterial [1]. In-dividual molecules of collagen, which are semiflexible rods ∼280 nm in length and∼1 nm in diameter, undergo self-assembly to form interwoven network-like structures, rang-ing from long fibrils to complex. The native fibril possess a high degree of axial alignment of collagen molecules and are characterized by a regular stagger of approximately 1/4 of a rod length between each molecule and its axially aligned neighbour, which is characterized by a banding pattern with a∼67 nm period [2]. Type I collagen molecules form sta-ble solutions in acids, pH3.5 and low ionic strength at any temperature from freezing to denaturation. Monomeric
*Correspondence and reprints.
E-mail address: [email protected] (A.S.B. Sombra).
native molecules are also soluble and form stable solutions at 3.5pH7.4 and low ionic strength at temperatures in the range from freezing to maximum of 20◦C. At tem-peratures greater than this, aggregates and fibrils begin to form, although the rates obviously depend on the solution conditions. The fibrils which ultimately form are usually well ordered pattern similar to those observed in vivo. Self-assembly in pure systems is very dependent upon the tem-perature, ionic strength, nature of the added salt, and pH, which suggests that growth of the fibrils is largely directed by hydrophobic and eletrostatic forces [3]. Collagen fibril assembly is an example of an entropy-driven self-assembly process, which is driven by the loss of collagen-bound sol-vent molecules [4].
The piezoelectric properties of collagen has been inves-tigated in complex biological systems such as bone and tendon. The piezoelectric properties of bone are of inter-est in view of their role in bone remodelling [5]. The stress generated potential of bone promoted osteogenesis, which
are mediated by electrical current generated by piezoelec-tric materials through changing pressure [6]. The magnitude of the piezoelectric sensitivity coefficients of bone depends on frequency, on direction of load, and on relative humid-ity. Values up 0.7 pC N−1 have been observed in bone [7]. Some authors [8] examined the relation between collagen’s film piezoelectricity and its electron microscopic appear-ance, in films with different degree of organization, and sug-gest that the piezoelectric effect originate either at the level of tropocollagen. In this paper we did a study of collagen membranes prepared with iron as an impurity. Our study is trying to understand the function of the iron in the colla-gen structure. We prepared different samples with different iron doping levels. One has samples prepared in solutions of FeCl2at 0.1 M and 0.2 M (ColFeCl01 and ColFeCl02) and
iron doped directly with Fe2O3at 5% and 15% (Col7Fe5 and
Col7Fe15) followed by extensive water washes and dried in laminar flow of air. We did a study of the Mössbauer spec-troscopy, DC electrical conductivity and the piezoelectric strain tensor element d14, the elastic constant s55, and the
dielectric functionε11 of the samples. The loss factorQ−1
of the samples was also measured using the admittance res-onance method. The role played by the iron in the different situations and the consequences for the transport properties is discussed.
2. Experimental procedure, experimental methods
Soluble collagen
The collagen was prepared by solubilization of collagen from bovine serosa after 72 h of treatment under alkaline conditions in presence of salts, followed by homogenization in acetic acid solution, at pH=3.5 [9]. The samples were di-alised against acetic acid solution, at pH=3.5, and brought to a final concentration of 1%, determined by hydroxipro-line [10].
Films
The membranes, casted in acrylic molds from a collagen solution, were equilibrated in phosphate buffer by 24 h, 0.13 mol L−1, in the following pH: 3.4 and 7.4 (see Table 1), followed by extensive water washes and dried in laminar flow of air.
Doped films with Fe2O3
Starting from the collagen (gel) at pH=7.4, the Fe2O3
was added up to the point where the final concentration was 5% and 15% (for samples Col7Fe5 and Col7Fe15, respec-tively). The homogenized the samples went to centrifugation at 10000 rpm for 15 min and dried in a laminar flow of air, at room temperature.
Doped film with iron using solutions of FeCl2
The collagen films were doped with iron by immersion in solutions of FeCl2 (0.1 mol L−1 and 0.2 mol L−1 for
ColFeCl01 and ColFeCl02, respectively).
Table 1
Collagen films with the pH of preparation
Sample Films pH
Col7 Collagen 7.4
ColFeCl01 Collagen-FeCl2(0.1 M) 3.4
ColFeCl02 Collagen-FeCl2(0.2 M) 3.4
Col7Fe5 Collagen-5% Fe2O3 7.4
Col7Fe15 Collagen-15% Fe2O3 7.4
Thermal analysis
The thermal stability of the collagen samples were determined by measures of its denaturation temperature, using an equipment Shimadzu DSC-50, membranes samples were sealed in aluminum cell and heated up with rate of 5◦C min−1with N2atmosphere.
Dielectric function measurements
The complex dielectric function measurements were performed with a HP 4291A Material Impedance Analyzer in conjunction with a HP 4194 Impedance Analyzer, which jointly cover the region of 100 Hz to 1.8 GHz. The electrodes were deposited by painting silver powder suspension.
Atomic absorption spectroscopy (AAS)
A Varian SpectrAA40 flame atomic absorption spectrom-eter was used for iron dspectrom-etermination. The spectral bandwidth was set at 0.2 nm. The analytical measurements were made in an oxidizing air acetylene flame composition, at 248.3 nm by using a Varian iron hollow cathode lamp operating at 5 mA. All measurements were made with at least three replicates and based on integrated absorbancy.
DC conductivity
Samples used for electrical measurements were plates in the geometry described in Fig. 1 where the circular surface area has 1 cm in diameter and thickness around 30 µm. The silver electrodes were applied in both faces. The DC con-ductivity is measured when the sample is heated from low temperature (6 K min−1) with an applied constant DC volt-age (50 V) using a conventional electrometer (Keithley 617 Programmable Electrometer). In Fig. 1 one has the sample geometry we used for the dielectric and piezoelectric mea-surements. Rectangular coordinates are assigned to the sam-ples as shown in Fig. 1. The 2-3 plane is the sample plane, and the 1 axis is perpendicular to the plane of the sample. The flat faces of the samples are painted with a silver elec-trode.
Mössbauer spectroscopy
Fig. 1. A rectangular coordinate assigned to the sample for the measurement of piezoelectric and dielectric constant.
with fixed linewidth and isomer shift and computes the con-tribution of each curve to the total absorption spectrum by least square procedure. All the isomer shifts (δ) quoted are relative to metallic iron (α-Fe).
3. Piezoelectric model
Piezoelectricity may exist for certain symmetries of crystalline structures. In general anisotropic crystals have the piezoelectric effect and their piezoelectric constants can be represented by the matrix:diJ, wherediJ are called as
the piezoelectric strain constants. Some of them are null, according to the symmetry of the material [12]. In the case of natural biopolymers the symmetry observed isD∞(∞2),
which show only shear piezoelectricity. In this cased25=
−d14. In the case of bone, the piezoelectricity appears only
when the shearing force acts on the orientated collagen fibers so that they slip past one another [11]. Shear piezoelectricity is observed almost universally for the oriented textures of biopolymers [11].
Shear piezoelectricity is also observed for the oriented films of a variety of synthetic polymers with optical activity. Rectangular coordinates are assigned to the film sample. The 1 axis is perpendicular to the plane of the sample, plane 2-3 (Fig. 1).
The coupled electromechanical equations for our system is:
(1)
SI=SI JETJ+DIjEj,
(2)
Di=εTijEj+diJTJ.
WhereSI (S1, . . . , S6)is the strain and TJ (T1, . . . , T6) is
the stress,Ejis the electric field andDi is the displacement
vector. With constantssI JE (compliance for constant electric field),εTij (dielectric permittivity for constant stress) and the piezoelectric strain elementdiJ. Using the tensors defined
before in Eqs. (1) and (2), and taking into account that the electric field is applied in direction 1 (E2=E3=0) one has:
(3)
D1=εT11E1+d14T4,
(4)
S4=s55ET4+d14E1.
From Eqs. (3) and (4) one can see the electro-mechanical coupling through the d14 piezoelectric tensor element. In
this geometry one has a mechanical wave propagating in the plane of the sample (S4↔S23) coupled with the electric
field in the “1” axis.
After an easy manipulation one has forD1vector:
(5)
D1=εT11
1− d
2 14 s55EεT11
E1+ d14 s55E S4.
One can define nowk14, which is the piezoelectric coupling
factor:
(6)
k214= d
2 14 s55EεT11.
From the definition of k14, one can define the relations of
elastic compliance and electric permittivity measured under different conditions:
(7)
s55D s55E =
εS11
εT11=1−k 2 14.
The piezoelectric strain elementd14for the shear
piezoelec-tric is given by Eq. (6) [12]:
(8)
d14=k14
ε11Ts55E.
With Eq. (7):
(9)
k14=
1−ε
S 11 ε11T ,
wherek14is the piezoelectric coupling factor,εT11is the
di-electric permittivity obtained by a measurement of the ca-pacitance at a frequency below the fundamental resonance,
ε11S is obtained by measurement of the capacitance at a fre-quency above the resonance mode. The measurement of the dielectric permittivity was done in the range of 1 MHz to 1 GHz in the geometry of Fig. 1. The obtained values for 1 MHz, and 1 GHz could be found in Table 4 and Fig. 8. In our calculations we assumeεT11at 1 MHz (below the piezo-electric resonance frequency) andεS11at 1 GHz (above reso-nance).
From Eqs. (3) and (4), one has forT4:
(10)
T4=
1
s55DS4− d14 s55EεS11D1,
assuming that∂D1/∂x4=0 we can obtain the equation of
motion:
(11)
∂2u4 ∂t2 =
1
ρs55D ∂2u4
where u4 is the displacement on the plane of the sample
(plane perpendicular to electric field, see Fig. 1), andρ is the density.
The obtained velocity is:
(12)
v=1 ρs55D
=ω
k,
where ω is the frequency and k is the wavenumber (k= 2π/λ).
The elastic compliances55D, which is determined from the successive resonance frequencies of the shear mode. Could be calculated from Eq. (12) assuming that the most pro-nounced resonances are those where the body can accom-modate one half wavelength of the standing elastic wave (L=λ/2). In this case one can obtains55D from Eq. (12):
(13)
s55D= 1 4ρ(f·L)2,
wheref ·Lis the frequency constant which is the product of the resonance frequency and the diameter of the sample (controlling dimension of the sample,L≫e, see Fig. 1) and
ρis the sample density. From the experimental measurement of ε11T , ε11S , f ·L and ρ one can obtain s55D (Eq. (13)),
k14 (Eq. (9)) and d14 (Eq. (8)). In Table 1 one has the
experimental values of these constants under study.
3.1. Loss factor measurement
For the ceramics that are used as transducers for the gen-eration of ultrasonic waves, considerable heat, is generated in the transducer at a high power level, and thus limits the maximum radiated power. The origin of this effect has been investigated by some authors. Some of them attributed it to the dielectric hysteresis [13], but its main cause was inter-preted as the internal friction of the ceramic [12]. The dis-sipation of mechanical energy near the resonance must be represented by an internal resistance. For the piezoelectric ceramics the internal friction and dielectric loss are found to be mostly caused by the dissipations within the grain crystal-lite, and the major contribution of the dissipation in the grain may be the average in some sense, involving mechanical and dielectric loss losses of single domain crystal. The other fac-tor that could influence the loss, is the water presence in the preparation process. The water absorption in collagen films is dependent on the pH of the liquid solution used for im-mersion. However in our experimental procedure the sam-ples were dried in laminar flow of air (see the experimental procedure). In this situation we do not expect big differences for samples prepared in different pH’s. However we can ex-pect that membranes formatted in water at pH of 7.4, could allowed the water to participate in the structure of the fi-bres through a hydrogen bond between adjacent molecules. However this effect was not detected in our measurements (see Table 5). The loss factor was measured (Q−1) using the
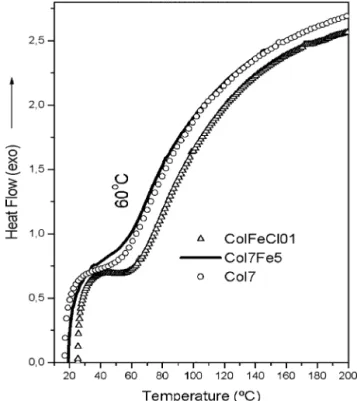
Fig. 2. DSC curves of the samples Col7, Col7Fe5, ColFeCl01.
electric admittance resonance curve by:
(14)
Q−1=f2−f1 f0
.
The frequencies corresponding to |Y| = |Ym|0.707 are
in-dicated by f2 andf1 where|Ym| is the peak value of the
resonance andf0is the frequency of the resonance.
4. Results and discussion
Fig. 2 shows the DSC curves of three collagen films, Col7, Col7Fe5 and ColFeCl01 (see Table 1). The main feature in the DSC curves of collagen are the denaturation endotherm. For these samples they are around 60◦C. This is
an indication that the iron doping is maintaining the basic configuration of the collagen structure even for samples prepared in different pH conditions.
Fig. 3. Mössbauer spectra of sample ColFeCl02 (see Table 2). () experi-mental points and the continuous line is the theoretical fitting.
Fig. 4. Quadrupole splitting distribution for Fe3+and Fe2+associated to Fig. 3.
Table 2
Mössbauer parameters as obtained by the Normos fitting program. Table shows the more probable values of quadrupole splitting (∆max), isomer
shift (δ) and the absorption relative area %.δis measured relative to metallic iron. (The errors in the Mössbauer parameters are±0.01 mm s−1.) Sample Site ∆max(mm s−1) δ(mm s−1) Area (%) H(T)
ColFeCl01 Fe2+ – – − 52.8
Fe3+ 0.18 0.57 100
ColFeCl02 Fe2+ – 0.81 12.5
Fe3+ 0.71 0.34 87.5
Col7Fe5 Fe2+ – – − 52.8
Fe3+ 0.2 0.58 100
Col7Fe15 Fe2+ – – − 52.8
Fe3+ 0.21 0.58 100
Fig. 5. Mössbauer spectra of samples Col7Fe5, Col7Fe15, ColFeCl01 (see Table 2), () experimental points and the continuous line is the theoretical fitting.
area population. According to Dyar [15] Fe3+ions in an oc-tahedral coordination [Fe3+(VI)], present the Mössbauer pa-rameterδwith values ranging from 0.35 to 0.55 mm s−1 rel-ative to metallic iron, whereas for a tetrahedral coordination [Fe3+(IV)] theδvalue ranges from 0.20 to 0.30 mm s−1. For Fe2+ions, values ofδbelow 1.0 mm s−1relative to metallic iron, are associated to tetrahedral coordination [Fe2+(IV)] and values of δ above 1.0 mm s−1 are associated to octa-hedral coordination [Fe2+(VI)]. The Mössbauer parameter quadrupole splitting (∆) is also useful for evaluating the co-ordination number since a distorted tetrahedral site is char-acteristically less symmetric than a distorted octahedral site, therefore different values of∆should be obtained. However it is observed [15] that coordination number should be pri-marily determined fromδ values. In our case (see Table 2), for Fe3+ions, the value of δ is 0.34 mm s−1 and for Fe2+ ion δ is 0.81 mm s−1. Therefore we can assume that both iron ions are at sites of distorted octahedral coordination. The quadrupole splitting values are also in agreement with this interpretation.
Fig. 4 also shows the probability distributions of the Lorentzian doublets versus quadrupole splitting for Fe3+ and Fe2+ion in sample ColFeCl02. As we can see the distri-butions show different relative maxima of quadrupole split-ting distribution (∆max), which are associated to different
distortions of the octahedral symmetry around the iron ions. The position of the∆maxrepresents the most probable value
of the quadrupole splitting of the site. One can observe that for ColFeCl02 one has the presence of Fe3+ and Fe2+ in sites with distorted octahedral symmetry. Under this inter-pretation the Fe3+ ions which are 87.5% of the total iron, are in average site with∆max=0.71 mm s−1in a broad
The Mössbauer spectrum for samples ColFeCl01, Col7-Fe5 and Col7Fe15 shows, one magnetic sextet component assigned to, based on isomer shift values (0.57, 0.58 and 0.58 mm s−1, respectively) and quadrupole splitting values (0.18, 0.2 and 0.21 mm s−1, respectively), a magnetic phase associated to Fe3+with hyperfine magnetic fields of 52.8 T (see Table 2 and Fig. 5). These magnetic phases was not identified up to this point in our study but we believe that these parameters are quite close to hematite (α-Fe2O3)
which has δ=0.38 mm s−1,∆=0.12 mm s−1 andH = 51.5 T [16]. It is worth mentioning that, for all samples, we recorded the high velocity spectra (±10 mm s−1) to check the possibility of magnetic phases precipitation.
To confirm the iron doping in samples ColFeCl01 and ColFeCl02, we use the AAS technique to find the final dop-ing conditions. It was observed that the final concentrations of iron was 2.85±0.02 and 3.49±0.02 in W% of iron in the sample for ColFeCl01 and ColFeCl02, respectively. This is an indication that the increase in the iron doping was around 22% for sample ColFeCl02 compared to ColFeCl01. How-ever with this higher level of concentration (ColFeCl02) the iron atoms seems to be more dispersed over the sample, re-sulting in a paramagnetic Mössbauer spectra (Figs. 3 and 4) of this sample. For the less concentrated sample ColFeCl01 the magnetic interaction is present indicating more interac-tion between the iron atoms (see Fig. 5). The samples doped by Fe2O3 (Col7Fe5 and Col7Fe15) present a magnetic
in-teraction with Mössbauer parameters close to the hematite phase (see Fig. 5 and Table 2). However for all the iron doped samples we believe that the iron is present in the col-lagen film around the colcol-lagen fibers but not taking part di-rectly in the collagen fiber itself.
4.1. DC conductivity
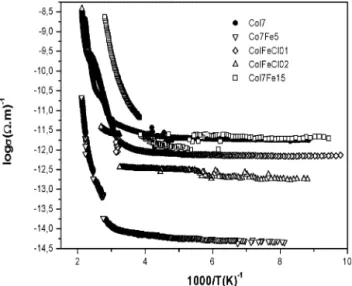
In Fig. 6 and Table 3 we have the DC conductivity of the samples in Table 1. At room temperature (T = 300 K) the conductivity increases from 9.1×10⁻¹⁵ to 3.3×10⁻¹¹ (%m)−1. The activation energy also varies from 0.48 to 0.71 eV. For the samples under study the highest conductivity was obtained for Col7Fe15. Around room temperature it is around ten times bigger then pure collagen (Col7). However with the decrease of the Fe2O3
concentration the conductivity decrease by a factor of 10−4, which is lower than the pure collagen sample (Col7). The decrease of the conductivity for values lower than the pure
Fig. 6. DC conductivity of samples Col7, Col7Fe5, Col7Fe15, ColFeCl01, ColFeCl02 as a function of temperature.
collagen is under study in our group. For the samples prepared by immersion in FeCl2one notice that there is also
a decrease of the sample conductivity with the increase of the iron concentration. For sample ColFeCl01 the conductivity is in the same order of the pure collagen (10−12(%m)−1) and decrease to 10−13to ColFeCl02. Generally, iron, as detected by Mössbauer spectroscopy exists, as Fe2+ and Fe3+, so conduction could occur by electrons hopping between metal transition ions like Fe2+, Fe3+, therefore the Fe2+/Fetotal
and the average distance between metal transition ions in the matrix are important factors for the DC conductivity. Murawski and Growski [17] have found that the maximum conductivity occurs at a concentration ratio Fe2+/Fetotal=
0.5 in iron phosphate glasses. Dimitriev et al. [18] have found that Fe2+/Fetotal increases with the increase of the
iron doping in these samples. It is quite clear that the conversion Fe2+⇔Fe3+is a fundamental factor for the DC conductivity. In a metal transition oxide glass, we could have mixed conductivity in which the relative contributions of ionic and electronic components of the total conductivity can be continuously changed.
Mott [19] has theoretically investigated the hopping conductivity of oxide glasses containing transition metal ions. The conduction process have been described in terms of phonon assisted hopping of small polarons between localised states and the following equation has been obtained for the conductivity of the nearest neighbour hopping in the
Table 3
EDC, activation energy for DC conductivity,sDCis the DC conductivity
Sample Col7 ColFeCl01 ColFeCl02 Col7Fe5 Col7Fe15
EDC(eV) 0.71 0.48 0.53 0.76 0.49
σDC(T =300 K) (%m)−1 3.9×10⁻¹² 1.46×10⁻¹² 3.54×10⁻¹³ 9.1×10⁻¹⁵ 3.3×10⁻¹¹
*Fe2+(A%) – 12.5 – –
*Fe3+(A%) 100 87.5 100 100
Table 4
Density (ρ), thickness (e), dielectric permittivity (ε), frequency constant (f·L) and piezoelectricity (d14) of the samples Col, ColFeCl01, ColFeCl02, Col7Fe5,
Col7Fe15
ρ(Kg m−3) e(µm) εT11/ε0at 1 MHz ε11S /ε0at 1 GHz f·L(kHz m) d14(10−12C N−1)
Col7 946.61 34.10 1.24 1.17 368.88 0.036
ColFeCl01 834.09 34.10 1.43 1.32 326.48 0.054
ColFeCl02 1096.68 64.50 1.22 1.19 462.91 0.017
Col7Fe5 922.24 37.50 1.37 1.30 363.13 0.035
Col7Fe15 1147.63 33.10 1.72 1.42 421.6 0.063
nonadiabatic regime at high temperatures:
(15)
σ=ν0e
2C(1−C)
kT R exp(−2αR)exp
−W
kT
,
whereν0is the optical phonon frequency,αis the decay rate
of the wave function,C is the ratio of concentration of an ion in the low valence state to the total concentration of the transition metal ion,R is the average hopping distance,W
is the activation energy,eis the electronic charge,kis the Boltzmann constant andT is the absolute temperature. The activation energyW is associated with the electron–lattice interaction and static disorder by:
(16)
W=WH+ WD
2 ,
whereWHis the hopping energy andWDis the energy
dif-ference between two adjacent ions. For the DC conductivity we will assume the equation:
(17)
σ=σ T exp
−E
DC kt
,
whereσ0 is the pre-exponential factor andEDCis the
acti-vation energy for DC conductivity. The data on Table 3 was obtained from the fitting procedure using Eq. (17). In Fig. 7 one has the frequency dependence of the absolute value|Y| of the admittance of sample Col7. The measurement was done with the sample in disk type geometry as shown in Fig. 1. Rectangular coordinates are assigned to the samples as shown in Fig. 1. The 2-3 plane is the sample plane, and the 1 axis is perpendicular to the plane of the sample. The flat faces of the samples are painted with silver electrodes. The thickness and the diameter of each sample are found in Tables 4 and 5. For all the studied samples the diameter “L” was varied between 1 to 3.6 cm, and the thickness “e” varied from 33 to 64 µm.
In Fig. 7, one has measurements for different diameters of the disk, which is indicated in Fig. 7. From Fig. 7, the frequency constant,f·Lassociated to the shear piezoelec-tric mode of this sample (Col7) was obtained (see Table 4). The same procedure was used for all samples and is sum-marised in Table 4. The average value obtained for the shear mode wasf ·L∼368.8 kHz m, which is a value, of about two orders of magnitude higher compared with PZT [11]. In Fig. 8 one has the dielectric function in the region of 1 MHz to 1 GHz to all the samples. One can observe that sample Col7Fe15 present the highest value for the dielectric permittivity in the region under study. From Fig. 8 one has
Fig. 7. Electrical admittance as a function of external frequency and the disk diameter (L) for sample Col7.
Fig. 8. Dielectric function of the samples as a function of the frequency.
the dielectric permittivityεT
11at 1 MHz (which is the
dielec-tric permittivity obtained by a measurement of the capaci-tance at a frequency below the fundamental resonance) and
Table 5
Loss factor (Q−1) for each sample as a function of the sample diameter (L)
L(cm) Col7 ColFeCl01 ColFeCl02 Col7Fe5 Col7Fe15
Q−1 1.0 – – – –
Q−1 1.2 0.16 0.26 – 0.14 0.17
Q−1 1.4 0.26 – – 0.24 0.18
Q−1 1.6 0.16 0.17 0.28 0.18 0.15
Q−1 1.8 0.17 – – 0.15 0.18
Q−1 2.0 0.27 0.22 0.27 0.14 –
Q−1 2.2 0.18 – – 0.15 0.21
Q−1 2.4 – 0.31 0.33 0.14 0.15
Q−1 2.6 0.20 – – 0.17 0.17
Q−1 2.8 0.20 0.21 0.19 –
Q−1 3.2 0.26 0.27 0.34 – –
Q−1 3.6 – – 0.63 – –
can obtain the piezoelectric strain elementd14for the shear
piezoelectricity (see Table 4). The piezoelectric strain ten-sor elementd14 obtained for sample Col7Fe15 was around
0.063 pC N−1, which is the highest value for all the studied samples which is 75% higher than the pure collagen (Col7). This is an indication that one can obtain higher piezoelec-tricity (d14) using direct Fe2O3doping.
In Table 5 one has all the values of the loss factorQ−1
for all the samples.
5. Conclusions
In this paper we did a study of collagen membranes pre-pared with iron as an impurity. One try to understand the function of the iron in the collagen structure in view of in-creasing the value of piezoelectric strain tensor elementd14.
We prepared different samples with different iron doping levels. One has samples doped by immersion in solutions of FeCl2at 0.1 M and 0.2 M (ColFeCl01 and ColFeCl02) and
iron doped directly with Fe2O3at 5% and 15% (Col7Fe5 and
Col7Fe15). The DSC results for collagen films: pure colla-gen and samples prepared by immersion and direct doping (Col7, Col7Fe5 and ColFeCl01) shows that the denatura-tion endotherm is around 60◦C. This is an indication that the iron doping is not promoting strong changes in the structure of the collagen structure even for samples prepared in dif-ferent pH conditions. The Mössbauer spectrum for samples ColFeCl01, Col7Fe5 and Col7Fe15 shows, one magnetic sextet component assigned to, based on isomer shift val-ues (0.57, 0.58 and 0.58 mm s−1, respectively), a magnetic phase associated to Fe3+ with hyperfine magnetic fields of 52.8 T. These magnetic phases was not identified up to this point in our study but we believe that these parameters are quite close to hematite (α-Fe2O3). Sample ColFeCl02 show
a paramagnetic spectra which can be interpreted as the su-perposition of two broad doublets. The more intense doublet can be assigned, based on isomer shift and quadrupole split-ting values, to high spin ferric iron (Fe3+), and the less in-tense to high spin ferrous iron (Fe2+). To confirm the iron doping in samples ColFeCl01 and ColFeCl02, we use the
atomic absorption spectroscopy technique to find the final doping conditions. It was observed that the final concentra-tions of iron was 2.85±0.02 and 3.49±0.02 in W% of iron in the sample for ColFeCl01 and ColFeCl02, respectively. This is an indication that the increase in the iron doping was around 22% for sample ColFeCl02 compared to ColFeCl01. For the samples under study the highest conductivity was obtained for Col7Fe15. At room temperature it is around ten times bigger then pure collagen (Col7). However with the decrease of the Fe2O3concentration the conductivity
de-crease by a factor of 10−4. Which is lower than the pure col-lagen sample (Col7). The decrease of the conductivity for values lower than the pure collagen is under study in our group. For the samples prepared by immersion in FeCl2one
notice that there is also a decrease of the sample conductivity with the increase of the iron concentration. One can observe that sample Col7Fe15 present the highest value for the di-electric permittivity in the region under study. The piezoelec-tric strain tensor elementd14obtained for sample Col7Fe15
was around 0.063 pC N−1, which is the highest value for all the studied samples and 75% higher than the pure colla-gen (Col7). This is an indication that one can obtain higher piezoelectricity (d14) using direct Fe2O3doping and which
will also provide higher electrical permittivity, DC conduc-tivity and lower loss for collagen applications.
Acknowledgements
This work was partly sponsored by FINEP, CNPq, CAPES (Brazilian agencies).
References
[1] M.E. Nimni, Collagen: Biotechnology, Vol. 3, CRC, 1988. [2] J.A. Chapman, Electron Microsc. Rev. 3 (1990) 143.
[3] R. Komasa-Penkova, Biochim. Biophys. Acta 1297 (1996) 171. [4] K.E. Kadler, Biochem. J. 316 (1996) 1.
[5] G.W. Hastnigs, F.A. Mahmud, J. Biomed. Eng. 10 (1988) 515. [6] F. Jianqing, Y. Huipin, Z. Xingdong, Promotion of osteogenesis by a
[7] J.B. Park, R.S. Lakes, Biomaterials: An Introduction, Plenum Press, New York, 1992.
[8] A.A. Marino et al., Calcif. Tissue Int. 31 (1980) 257. [9] G. Goissis, C.M. Moriak, BR 9.000.972, 2 de março de 1990. [10] J.S. Romero, M. Pons, M.C. Coque, G.R. Ramos, Anal. Lett. 27 (8)
(1994) 1557.
[11] E. Fukada, Piezoelectricity and pyroelectricity of biopolymers, in: Ferroelectric Polymers, Marcel Dekker Inc., 1995, pp. 393–439. [12] T. Ikeda, Fundamentals of Piezoelectricity, Oxford Science
Publica-tions, 1996.
[13] T. Ikeda, J. Phys. Soc. Japan 13 (1958) 809.
[14] E.B. de Araujo, J.A.C. de Paiva, M.A.B. de Araujo, A.S.B. Sombra, Phys. Status Solidi B 197 (1996) 231.
[15] M.D. Dyar, Am. Mineral. 70 (1995) 304.
[16] N.N. Greenwood, T.C. Gibb, Mössbauer Spectroscopy, Chapman and Hall, 1971, p. 241.
[17] L. Murawski, O. Growski, Acta Phys. Pol. A 50 (1976) 463. [18] Y. Dimitriev, J. Bart, V. Dimitrov, M. Arnaudov, Z. Anorg. Allg.
Chem. 479 (1981) 229.