Electron microscopic changes of detrusor in benign
enlargement of prostate and its clinical correlation
_______________________________________________
Sher Singh Yadav
1, Rohit Bhattar
1, Lokesh Sharma
2, Gautam Banga
3, Trilok Chandra Sadasukhi
41 Department of Urology and Renal Transplantation, SMS Medical College, Jaipur, Rajasthan, India; 2
Department of Urology, NIMS Medical College, Jaipur, Rajasthan, India; 3 SCI International Hospital, New Delhi, India; 4 Department of Urology, Mahatma Gandhi Hospital, Jaipur, Rajasthan, India
ABSTRACT
ARTICLE
INFO
______________________________________________________________ ______________________
Aims: To study the ultra structural changes in bladder musculature in cases of BPE and their clinical relevance.
Material and Methods: In this descriptive longitudinal, controlled, observational study patients were enrolled into three groups, group 1, group 2A and group 2B. Control group (group-1) consisted of age matched normal male patients, who underwent sur-veillance or diagnostic cystoscopy for microscopic hematuria or irritative symptoms. Case group (group-2) comprised of patients with BPE, undergoing TURP. Case group (group-2) was further classified into: Category 2A (patients not on catheter) and cat-egory 2B (patients on catheter). All relevant clinical parameters like IPSS, prostate size, Qmax, PVR were recorded. Cystoscopy and bladder biopsy were performed in all patients. Various ultrastructural parameters like myocytes, fascicular pattern, intersti-tial tissue, nerve hypertrophy and cell junction pattern were analyzed under electron microscope and they were clinically correlated using appropriate statistical tests.
Results: Control group had significant difference as compared to case group in terms of baseline parameters like IPSS, flow rate and prostate size, both preoperatively and postoperatively, except for PVR, which was seen only preoperatively. There was statis-tically significant difference in ultrastructural patterns between case and control group in all five electron microscopic patterns. However, no significant difference was found between the subcategories of case groups.
Conclusions: BPE is responsible for ultra structural changes in detrusor muscle and these changes remain persistent even after TURP. Nerve hypertrophy, which was not thoroughly discussed in previous studies, is also one of the salient feature of this study.
Keywords:
Prostatic Hyperplasia; Prostate; Urinary Bladder
Int Braz J Urol. 2017; 43: 1092-101
_____________________
Submitted for publication: June 15, 2016
_____________________
Accepted after revision: September 11, 2016
_____________________
Published as Ahead of Print: March 27, 2017
INTRODUCTION
Bladder dysfunction is often seen secon-dary to outlet obstruction in benign prostatic en-largement (BPE). These dysfunctions persist even after surgical correction and may be responsible for persistence of symptoms. However, the under-lying mechanism for bladder dysfunction is not
of this study was to study electron microscopic changes in bladder muscle in cases of BPE and its clinical correlation.
Normal bladder muscles are composed of fascicles. Fascicles in turn are made up of uni--directionally arranged four to twelve spindle sha-ped myocytes which are surrounded by interstitial microsepta, made up of collagen and occasionally by elastin (2). Hailemarium and Elbadawi graded fascicles as 1) Compact- Bundle of fascicles with occasional myocyte separation, 2) Intermedia-te- Mixture of compact and loose fascicles and 3) Loose- Moderate to severe myocyte separation or irregular arrangement with rarely seen uniform units (2). Together these muscle fascicles are com-pact and form muscle bundle and these too are also separated by collagen and elastin. Normal amount of collagen help in mechanical cell cou-pling, which help in complete bladder emptying. Collagen content in detrusor muscle is much va-ried and most studies are qualitative in nature, ho-wever Mirore et al. had showed that mean collagen content in normal detrusor muscle is <21% (3). For contraction, only a small proportion of myocytes are directly stimulated by nerve while majority of them receive the signals either through electrical or mechanical coupling via Intercellular junction (ICJ) that is why sparse axon bundles are seen in interstitium. Commonest ICJ is intermediate cell junction, which consists of two closely apposed cell wall (sarcolemma) lying parallel to each other for a length of up to 10 micro meters with paired symmetrical dense plaques. Other junction pat-terns are less frequently seen in normal detrusor. When myocytes are tightly opposed than that is known as “gap junction”. Other variants are “pro-trusion junction”, which are slender finger like projection between cells with tip to tip contact and “ultra close abutment” (Figure-1a), which are a tight opposition on a parallel surface in a sha-dow bomb impression configuration (4).
Although gap junctions are seen in nor-mal detrusor, their ratio compared to nornor-mal ICJs increases in patients with detrusor instability, de-monstrating a syncytium pattern of gaps betwe-en cell processes linking up to or more than tbetwe-en myocytes. This leads to the summated detrusor contraction. So instead a low resistance pathway
Figure 1 - a) Variant of normal Intercellular Junctions (x-16400); 1b) Myocytes with normal intercellular junction and protrusion junction (X-17000); 1c) Normal Intercellular Junction (X-17600) this consists of two closely apposed 25-70nm wide gap sarcolemma lying parallel to each other for a length of up to 10µm with paired symmetrical dense plaques.
A
B
occur, thus mediating rapid electrical coupling. This ultimately results in the unstable contractions seen on urodynamic studies of subjects with an overactive detrusor (4, 5).
In pathological conditions, myocytes, interstitium and cell junction may show certain changes (6-8), these changes may be isolated or in various combinations. In BPE there may be changes in myocytes cell density, shape and content. Besides hypertrophy, myocytes may be empty or contain vacuoles and debris, their sha-pe may be shriveled or disruptive. In dysfunctio-nal bladder, myocytes can be breaded, branched, intertwined or bizarre shaped (9). In pathological conditions, fascicles may show marked separa-ted arrangement. Abnormal fascicle arrangement and architecture is usually associated with ab-normal interstitial tissue. Interstitium may have excessive collagen or elastin, loose fascicular pat-tern is more particularly associated with increa-sed interstitial tissue and seen in hypocontractile bladder (6-8). When nerve is thickened over its length then it can be considered as hypertrophy. Although no study had exactly quantify this, in our study we considered >10 micrometer diame-ter as an abnormal finding.
MATERIAL AND METHODS
After institutional review board appro-val the descriptive type of observational study with control group and longitudinal design was conducted in our department. Informed written consent was taken from all the patients. Patients attending the treatment of lower urinary tract symptom (LUTS), retention of urine and hematu-ria were enrolled. Detailed history was noted and physical examination was done in all patients. In-ternational prostate symptom score (IPSS) was re-corded in all catheter free patients. Besides routine investigations, prostate specific antigen (PSA) es-timation, and ultrasonography (USG) of kidneys, bladder and prostatic regions were also done in all the patients. Uroflowmetry (UFM) and post void residual urine (PVR) estimation were carried out in all the catheter free patients, whereas, UDS was also done in selected patients only. Patients with significant LUTS or retention of urine undergoing
trans urethral resection of prostate (TURP) were enrolled in the case group (group-2). These pa-tients were categorized into groups.
Control (group-1) comprised of age ma-tched patients, who underwent cystoscopy for evaluation of microscopic hematuria or irritati-ve LUTS without any evidence of BPE. Patients having IPSS >8, prostate volume>25mL, PVR >50mL, or peak flow rate (Qmax) <15mL/sec were excluded from this group.
Case (group-2) comprised of patients suffering from BPE. Only patients who had prostate volume >35mL with either retention of urine or having IPSS >15 and undergone TURP were included in this group. Patient ha-ving Qmax >15mL/sec or showing malignancy on TURP biopsy were excluded from this group. This group was further subcategorized into two groups: group 2A (catheter free) and group 2B (patients on catheter drainage).
Patients with past history of prostatic or bladder surgery, stricture urethra, neurologi-cal disorder, pelvic irradiation, prostatic/bladder malignancy, diabetes, renal impairment, prosta-tic or bladder abnormalities, active urinary tract infection, PSA>4ng/mL or on medical treatment (alfa blockers, 5 alfa reductase inhibitors, phospho diesterase 5 inhibitors {PDE 5I}, anticholinergics and cholinergics) and those with follow-up dura-tion of less than 3 months, were also excluded from the study.
re-garding myocyte changes like degenerative pattern, fascicular arrangement, interstitial tissue pattern, nerve hypertrophy and communication between myocytes and these findings were compared with patient’s clinical findings. Collagen content >34%, nerve diameter >10 micrometer and in ICJ, gap junc-tion ratio >50% (gap juncjunc-tion/normal ICJ) were la-beled as abnormal parameter in our study (3, 5).
Post operatively at the end of 1st and 3rd month patients of both groups were assessed by IPSS, PVR, Qmax and prostatic volume. Endoscopy and UDS were performed in selected cases.
In statistical analysis, continuous variables were summarized as mean and standard deviation, while categorical/nominal variables as proportions (%). One way ANOVA test with Post Hoc Tukey HSD test were used for analysis of continuous variables where subgroups were more than two, while chi--square test and Fisher exact test were used for no-minal/categorical variables as per their indications. P value <0.05 was taken as significant. SPSS 21.0 version was used for all statistical calculation.
RESULTS
In our patient series 50 patients met the in-clusion criteria, with 21 patients in control group and 29 patients in case group. Case group 2A had 20 patients and group 2B had 9 patients. Table-1 shows the preoperative clinical parameters and comparison between various groups. Group-1 and group-2 were comparable in terms of their age but had statistically significant difference with respect to IPSS, flow rate and prostate size. In terms of PVR all three categories (group 1, group 2A and group 2B) had statistically significant differences.
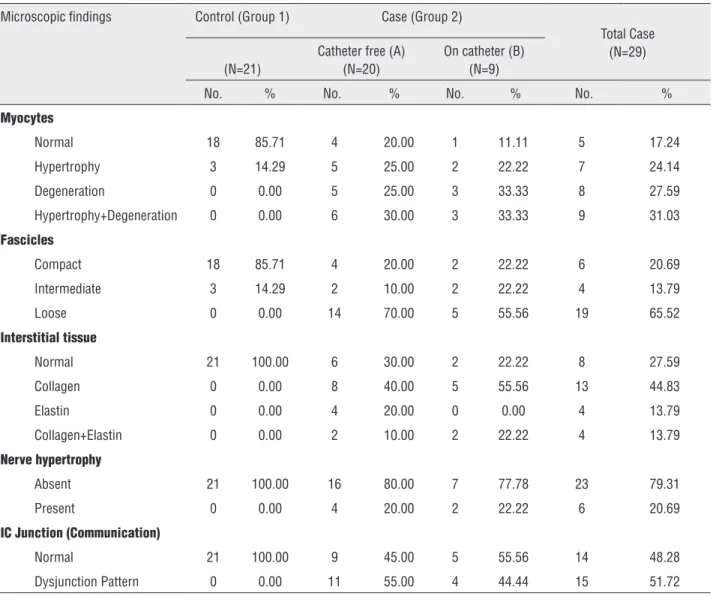
Table-2 shows electron microscopic featu-res of control and case group patients. In control group 18 (85.71%) patients had normal myocyte pattern (Figure-1b) whereas majority of patients in case group had varied morphological features. In case group, 9 (31.03%) patients had both myocyte hypertrophy and degenerative pattern (Figure-2a). Degenerative pattern (Figure-3) was seen in 17 (58.62%) case group patients and out of these, 12
Table 1 - Preoperative (Baseline) comparison between groups.
Characters Group N Mean Std. Deviation ‘p’ Value* Significant difference from#
Age(in years)
Control (Group 1) 21 60.19 3.49
0.289*
Case (Group2 A) 20 62.35 5.70
Case (Group2 B) 9 62.56 5.66
IPSS
Control (Group 1) 21 3.14 1.46
<0.001
Case (Group2 A) 20 20.45 3.90
Case (Group2 B) 9 -+ -+
Flow Rate(Qmax)
Control (Group 1) 21 17.29 2.62
<0.001
A,B
Case (Group2 A) 20 6.54 1.31 1,B
Case (Group2 B) 9 0.00+ 0.00+ 1,A
Prostate Size (in grams)
Control (Group 1) 21 16.00 2.35
<0.001
A,B
Case (Group2 A) 20 59.15 11.85 1
Case (Group2 B) 9 62.00 15.28 1
PVR(in mL)
Control (Group 1) 21 5.29 6.48
<0.001
A,B
Case (Group2 A) 20 88.35 50.14 1,B
Case (Group2 B) 9 400.00 242.38 1,A
Table 2 - Comparison of electron microscopic findings between groups and statistical correlations.
Microscopic findings Control (Group 1) Case (Group 2)
Total Case (N=29) (N=21)
Catheter free (A) (N=20)
On catheter (B) (N=9)
No. % No. % No. % No. %
Myocytes
Normal 18 85.71 4 20.00 1 11.11 5 17.24
Hypertrophy 3 14.29 5 25.00 2 22.22 7 24.14
Degeneration 0 0.00 5 25.00 3 33.33 8 27.59
Hypertrophy+Degeneration 0 0.00 6 30.00 3 33.33 9 31.03
Fascicles
Compact 18 85.71 4 20.00 2 22.22 6 20.69
Intermediate 3 14.29 2 10.00 2 22.22 4 13.79
Loose 0 0.00 14 70.00 5 55.56 19 65.52
Interstitial tissue
Normal 21 100.00 6 30.00 2 22.22 8 27.59
Collagen 0 0.00 8 40.00 5 55.56 13 44.83
Elastin 0 0.00 4 20.00 0 0.00 4 13.79
Collagen+Elastin 0 0.00 2 10.00 2 22.22 4 13.79
Nerve hypertrophy
Absent 21 100.00 16 80.00 7 77.78 23 79.31
Present 0 0.00 4 20.00 2 22.22 6 20.69
IC Junction (Communication)
Normal 21 100.00 9 45.00 5 55.56 14 48.28
Dysjunction Pattern 0 0.00 11 55.00 4 44.44 15 51.72
(41.37%) patients had either retention of urine or significant PVR before TURP 18 (85.71%) patients of control group had compact fascicular arran-gement whereas, in case group loose fascicular pattern was more prevalent which was seen in 19 patients (65.52%) (Figure-2b). Normal intersti-tial pattern was seen in all control group patients whereas increased collagen (Figure 4a and 4b) was seen as the predominant interstitial pattern in case group in 13 patients (44.83%). Nerve hyper-trophy (Figure-5) was absent in all control group patients while it was present in 23 (79.31%) pa-tients of case group. Normal communication
pat-tern (Figure-1c) was present in all control group patients, whereas in case group 15 (51.72%) pa-tients showed dysjunction pattern.
Table-3 shows that on application of chi--square test and Fischer exact test there was a sta-tistically significant difference in all electron mi-croscopic patterns in the control and case groups. However, there was no statistically significant di-fference in microscopic patterns among the subca-tegories of the case group.
the-se patients, into IPSS <19 and >19, then although abnormality is more evident in patients with severe symptoms (IPSS >19) it was not statistically sig-nificant. Similarly in cases of PVR, ultrastructural characteristics like myocytes and communication pattern are more evident in severe symptoms (PVR >300mL) but these were statistically insignificant.
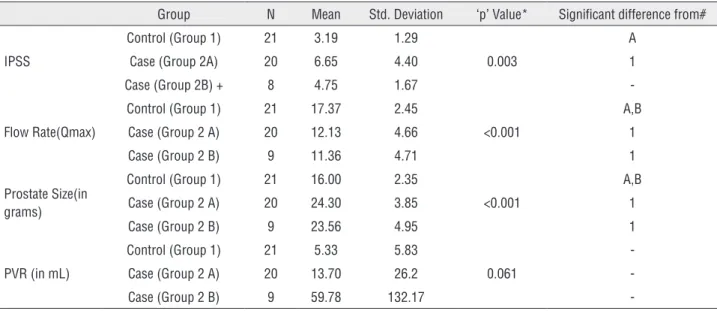
Table-5 shows the postoperative outcome after surgery (TURP). After TURP, all patients except two, successfully voided after catheter removal. In these two patients, catheter was kept for longer du-ration (15 days), after that one of them was able to void. These patients also had urodynamic finding of hypotonic bladder and complete myocyte degene-rative pattern on electron microscopy. On analysis, there was significant improvement in postoperative clinical parameters like IPSS, Qmax, decrease in PVR and prostatic size in the case group when compared to preoperative parameters. However, when compa-red to control group, the postoperative outcome of case group were found to be inferior.
Figure 2 - a) Myohypertrophy (a-X-27600 and b-X-13000). Marked intercellular separation and cellular hypertrophy. Excessive collagen present between the cells as well as between the fascicles. Red arrow shows myohypertrophy and black arrow shows excessive collagen and 2b) shows myohypertrophy in obstructed bladder shown by red arrow and loose fascicle with increased intercellular space shown by black arrow (X-13200).
A
B
DISCUSSION
Initial electron microscopic studies sugges-ted that aging can lead to morphological changes in bladder musculature (4, 6, 10). However, recent studies failed to demonstrate these findings (11-13). In our study, we did not find any correlation be-tween morphological changes and aging, as nearly all of our age matched control patients had normal muscular architecture in bladder on electron mi-croscopy. Probably these observational differences among various studies might be due to the variation in selection criteria and lack of control group.
Figure 3 - Degenerative pattern (X-12800). Black arrow shows degenerative pattern.
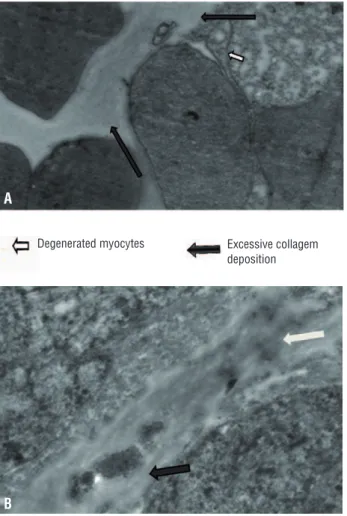
Figure 4 - a) Widened intercellular spaces with excessive collagen deposition along with degenerative myocytes (X-25860) and 4b) Excessive Collagen with Hyperelastosis (X-22380) with black arrow shows collagen and red arrow shows elastin.
Degenerated myocytes Excessive collagem deposition
of collagen deposited in interstitium of obstructed bladder (15, 16). Mirone et al. showed that detrusor collagen content increases in symptomatic cases of obstructive BPE and this could be responsible for persistence LUTS (17). Our fi nding also supported the concept that myohypertrophy is responsible for increased collagen deposition in bladder outlet obstruction (BOO), as nearly all of our case group patients having myohypertrophy also had increa-sed interstitial tissue content. However, whether ex-cessive collagen deposition is more frequently seen in acute (14) or chronic retention (12), is still an unanswered question. Notably, we failed to fi nd any difference in interstitial tissue content among sub-categories of case group.
Various studies had shown that degenera-tive changes in bladder muscle are responsible for increased residual urine, which persists even after TURP (9). In the present series, all patients having degenerative changes were able to void postopera-tively, except two patients, without signifi cant PVR. These two patients were found to have severe dege-nerative myocytes changes. This suggests that not only presence but severity of degenerative pattern also affects the outcome.
BOO induced growth factors regulate bla-dder remodeling by different mechanisms (17). The increased expression of nerve growth factor (NGF) is reported to be a key factor in the neuronal hyper-trophy observed in BOO patients (18). In our study, nerve hypertrophy was seen in six patients although individual signifi cance of this feature could not be
A
B
Table 4 - Showing correlation of ultrastructural characterstics with IPSS and PVR.
Ultrastructural characterstics
IPSS PVR
<19 >19 Total ‘p’ Value* <300mL >300mL Total ‘p’ Value*
Myocytes Normal 2 (22.22%) 0 (0%) 2
0.099344
5 (22.73%) 0 (0%) 5
0.165377
Abnormal 7 (77.78%) 11 (100%) 18 17 (77.27%) 7 (100%) 24
Fscicles Normal 2 (22.22%) 2 (18.18%) 4
0.82218
4 (18.18%) 2 (28.57%) 6
0.555599
Abnormal 7 (77.78%) 9 (81.82%) 16 18 (81.82%) 5 (71.43%) 23
Interstitial tissue Normal 3 (33.33%) 3 (27.27%) 6
0.76857 6 (27.27%) 2 (28.57%) 8 0.946613
Abnormal 6 (66.67%) 8 (72.73%) 14 16 (72.73%) 5 (71.43%) 21
Nerve hypertrophy
Normal 8 (88.89%) 9 (81.82%) 17
0.65952
17 (77.27%) 6 (85.71%) 23
0.631069
Abnormal 1 (11.11%) 2 (18.18%) 3 5 (22.73%) 1 (14.29%) 6
IC Junction (Communication)
Normal 4 (44.44%) 6 (54.55%) 10
0.65309
11 (50%) 3 (42.86%) 14
0.741854
Abnormal 5 (55.56%) 5 (45.45%) 10 11 (50%) 4 (57.14%) 15
* Chi-square Test
Table 3 - Statistical correlation of electron microscopic findings in various groups.
Abnormality of electron microscopic pattern
Control (Group 1) v/s Cases (Group 2)
Control (Group 1) v/s Case (Group 2 A)
Control(Group 1) v/s Case (Group 2 B)
Case A v/s B (Group 2A v/s Group
2B)
Myocytes* <0.001 <0.001 <0.001 1.000
Fascicles* <0.001 <0.001 <0.001 0.643
Interstitial Tissue* <0.001 <0.001 <0.001 0.544
Nerve Hypertrophy# 0.033 0.048 0.083 1.000
IC junction (Communication)#
<0.001
<0.001 0.005 0.700
* Chi-square Test; # Fisher Exact Test
correlated with any clinical outcome. But we be-lieve that along with muscle hypertrophy, it may be one of the adaptive change in response to ou-tlet obstruction. In the present study, we also found significant correlation between increase in prostatic volume, PVR, IPSS and decrease in Qmax, with the morphological changes in bladder muscle, although this had a nonlinear relationship.
In an animal study, Kim et al. had shown that, changes in detrusor can regress after the cor-rection of obstruction (1). Although there was signi-ficant improvement in IPSS, PVR, UFM after TURP in our case group, the outcomes were inferior when
num-Table 5 - Post operative (at 3rd months) comparison between groups.
Group N Mean Std. Deviation ‘p’ Value* Significant difference from#
IPSS
Control (Group 1) 21 3.19 1.29
0.003
A
Case (Group 2A) 20 6.65 4.40 1
Case (Group 2B) + 8 4.75 1.67
-Flow Rate(Qmax)
Control (Group 1) 21 17.37 2.45
<0.001
A,B
Case (Group 2 A) 20 12.13 4.66 1
Case (Group 2 B) 9 11.36 4.71 1
Prostate Size(in grams)
Control (Group 1) 21 16.00 2.35
<0.001
A,B
Case (Group 2 A) 20 24.30 3.85 1
Case (Group 2 B) 9 23.56 4.95 1
PVR (in mL)
Control (Group 1) 21 5.33 5.83
0.061
-Case (Group 2 A) 20 13.70 26.2
-Case (Group 2 B) 9 59.78 132.17
-* ANOVA Test; # Tukey HSD; + one patient not able to void
ber of patients and lack of post TURP morphological data to confirm the residual detrusor changes. With enrolment of more number of patients and quanti-fication of morphological changes, impact of the-se changes on various clinical findings could have been better explored.
CONCLUSIONS
In our study detrusor morphological chan-ges have been seen in various combinations in cases of BOO. These ultrastructural patterns showed non-linear correlation with clinical measures of bladder dysfunction. Nerve hypertrophy, which was not thoroughly discussed in previous studies, is one of the key features of this study. Surgery definitively leads to improvement in various clinical parameters but these parameters could not reach up to the level of control group because of underlying morpholo-gical changes.
ABBREVIATIONS
BOO = Bladder outlet obstruction
BPE = Benign prostatic enlargement
ICJ = Intercellular junction
IPSS = International prostate symptom score
LUTS = Lower urinary tract symptoms
NGF = Nerve growth factor
PDE 5I = Phosphodiesterase inhibitors
PSA = Prostatic specific antigen
PVR = Post void residual urine
Qmax = Peak flow rate
TURP = Transurethral resection of prostate
UDS = Urodynamics studies
UFM = Uroflowmetry
USG = Ultrasonography
CONFLICT OF INTEREST
None declared.
REFERENCES
1. Kim JC, Yoon JY, Seo SI, Hwang TK, Park YH. Effects of partial bladder outlet obstruction and its relief on types I and III collagen and detrusor contractility in the rat. Neurourol Urodyn. 2000;19:29-42.
2. Hailemariam S, Elbadawi A, Yalla SV, Resnick NM. Structural basis of geriatric voiding dysfunction. V. Standardized protocols for routine ultrastructural study and diagnosis of endoscopic detrusor biopsies. J Urol. 1997;157:1783-801. 3. Mirone V, Imbimbo C, Sessa G, Palmieri A, Longo N, Granata
4. Elbadawi A, Yalla SV, Resnick NM. Structural basis of geriatric voiding dysfunction. III. Detrusor overactivity. J Urol. 1993;150:1668-80.
5. Blatt A, Chan L, Tse V. Structural-functional correlation in bladder dysfunction: Is there a role for detrusor ultrastructural analysis? Department of Urology, Concord Repatriation General Hospital, Sydney, Australia, Pelviperineology 2007; 26: 33-37 available at. < http://www.pelviperineology.org/ pelvic_floor/pdf/structural_functional_correlation_bladder_ dysfunction.pdf>
6. Elbadawi A, Yalla SV, Resnick NM. Structural basis of geriatric voiding dysfunction. IV. Bladder outlet obstruction. J Urol. 1993;150:1681-95.
7. Brierly RD, Hindley RG, McLarty E, Harding DM, Thomas PJ. A prospective controlled quantitative study of ultrastructural changes in the underactive detrusor. J Urol. 2003;169:1374-8.
8. Brierly RD, Hindley RG, McLarty E, Harding DM, Thomas PJ. A prospective evaluation of detrusor ultrastructural changes in bladder outlet obstruction. BJU Int. 2003;91:360-4. 9. Hindley RG, Brierly RD, McLarty E, Harding DM, Thomas
PJ. A qualitative ultrastructural study of the hypocontractile detrusor. J Urol. 2002;168:126-31.
10. Elbadawi A, Yalla SV, Resnick NM. Structural basis of geriatric voiding dysfunction. I. Methods of a prospective ultrastructural/urodynamic study and an overview of the findings. J Urol. 1993;150:1650-6.
11. Gosling JA. Modification of bladder structure in response to outflow obstruction and ageing. Eur Urol. 1997;32(Suppl 1):9-14.
12. Holm NR, Horn T, Smedts F, Nordling J, de la Rossette J. The detrusor muscle cell in bladder outlet obstruction--ultrastructural and morphometric findings. Scand J Urol Nephrol. 2003;37:309-15.
13. Holm NR, Horn T, Smedts F, Nordling J, de la Rossette J. Does ultrastructural morphology of human detrusor smooth muscle cells characterize acute urinary retention? J Urol. 2002;167:1705-9.
14. Collado A, Batista E, Gelabert-Más A, Corominas JM, Arañó P, Villavicencio H. Detrusor quantitative morphometry in obstructed males and controls. J Urol. 2006;176:2722-8. 15. Freedman AL, Qureshi F, Shapiro E, Lepor H, Jacques
SM, Evans MI, et al. Smooth muscle development in the obstructed fetal bladder. Urology. 1997;49:104-7.
16. Rubinstein M, Sampaio FJ, Costa WS. Stereological study of collagen and elastic system in the detrusor muscle of bladders from controls and patients with infravesical obstruction. Int Braz J Urol. 2007;33:33-9; discussion 39-41.
17. Buttyan R, Chen MW, Levin RM. Animal models of bladder outlet obstruction and molecular insights into the basis for the development of bladder dysfunction. Eur Urol. 1997;32:32-9.
18. Steers WD, Kolbeck S, Creedon D, Tuttle JB. Nerve growth factor in the urinary bladder of the adult regulates neuronal form and function. J Clin Invest. 1991;88:1709-15.