Prevalence of noise-induced hearing loss in drivers
Andréa Cintra Lopes1, Vanessa Guioto Otowiz2, Patrícia Monteiro de Barros Lopes3, José Roberto Pereira Lauris4, Cibele Carméllo Santos5.
1) PhD. Associate Professor, Department of Speech Pathology, Faculty of Dentistry of Bauru, FOB-USP. 2) Audiologist for Hearing and Communication Institute. Speech therapist.
3) Degree in Speech Pathology. Speech Therapist - Director of SEAI-Specialized Industrial Audiology. 4) Doctor. Associate Professor, Department of Pediatric Dentistry, Orthodontics and Public Health, FOB-USP.
5) Speech. Master in Sciences Graduate Program in Applied Dental Sciences - Area Speech Pathology, Faculty of Dentistry of Bauru - FOB-USP.
Institution: Department of Speech Pathology. University of Dentistry of Bauru. University of São Paulo. Bauru / SP - Brazil.
Mailing address: Andrea Lopes Cintra - Department of Speech Pathology, Faculty of Dentistry of Bauru - University of São Paulo - Dr. Octavio Al Pinheiro Brisolla, 9-75 - Vila Universidade - Bauru / SP - Brazil - Zip code 17043-101 - PO Box: 73 - Telephone: (+55 14) 3235-8000 ext: 8532 - Email: [email protected]
Article received October 14, 2009. Article approved on April 27, 2011.
S
UMMARYIntroduction: Work-related hearing loss is one of the most common occupational illness progresses over the years of noise
exposure associated with the work environment, may cause damage to undertake physical activity, the individual’s physiological and mental besides causing hearing damage irreversible interfering with communication and quality of life. With high prevalence of male evaluates which is the second leading cause of hearing loss. Since there is no medical treatment for this type of hearing loss, it is evident the importance of preventive and conferences aimed at preserving hearing and health as a whole.
Objective: To assess the prevalence of hearing loss in audiometry admission of drivers.
Methods: Retrospective study. By 76 charts of professional drivers in leased transport companies. We analyzed data from
specific interview and pure tone audiometry.
Results: The prevalence of abnormal tests was 22.36% with the lowest thresholds for tritonal average of 3,000, 4,000 and 6,000
Hz. The higher the age, the higher thresholds.
Conclusion: This study has highlighted the occurrence of hearing in the absence of complaints. Considering that PAIR is
preventable, justifies the importance of coordinated and multidisciplinary involving not only health teams and safety, but also the institutions involved in preserving the health of workers, as the team SESMET, unions or prosecutors.
Keywords: noise; pure tone audiometry; hearing loss.
evolution, but preventable (3). Also described as a cumulative and insidious disease that progress over the years of noise exposure associated with the work environment. His initial signs show the onset of hearing thresholds in one or more frequency range between 3000-6000 Hz (4).
Occupational noise may also contribute to accidents in the workplace; it increases communication difficulties (5), maintenance of attention, concentration and memory (6), in addition to stress and excessive fatigue (7).
Although work-related hearing loss has reached major proportions in the industrial environment, the estimates of prevalence of this disease in different segments of the working classes, are basically made by some epidemiological studies, once again, that in most cases, does not cause incapacity for work, according to the Ministry of Social Security, in 1998, difficulties in determining this aspect notification of this hazard to worker health (8).
I
NTRODUCTIONHearing loss related to work has been the subject of studies in the field of public health in terms of hearing disorders that affect communication and quality of life of workers. It is an occupational disease of high prevalence.
A survey of the literature to ascertain the existence of similar work undertaken with the approach proposed in this study. To this end the research was performed in the Cochrane Portal Virtual Health Library (VHL), Medline, Lilacs and SciELO, using the following keywords: hearing loss, driver / hearing loss, and drivers. The study period was from 1997 to 2009. This search identified 37 articles. Excluding repeated studies and those not related directly or indirectly to the subject of this project were obtained from a total of 9 studies listed in Table 1.
The studies related to hearing loss in drivers, as well as the prevalence of PA and main symptoms are presented in Table 2.
Whereas the effects of work-related Hearing Loss (PAIR, acoustic trauma and hearing loss caused by exposure to chemicals) may impair the quality of life since they affect work and social relations with the disease is evident importance of preventive and collective aimed at preserving hearing and overall health.
Thus, this study has the main objective to assess the prevalence of hearing loss in audiometry admission of drivers. These data that will be used to implement educational measures and / or preventive in this population.
M
ETHODThis is a retrospective study, which examined the medical records of 76 audiometries admission of leased drivers in transport companies after having received the approval of the Research Ethics Committee, as Case No. 147/2009. We excluded records of drivers who had hearing loss with undetermined etiology, aged 55 years or who were deemed unfit for the role. Interview data were observed specific and pure tone audiometry, performed by the audiometer Interacoustics Midimate 622 model. Audiometry was performed in a soundproof booth and auditory rest of 14 hours. Previously audiometry was performed visual inspection of the external auditory canal to verify the possibility for the realization of pure tone audiometry.
Statistical method
The values observed in the studied variables were stored in Microsoft Excel. We used descriptive statistics by mean, median, minimum and maximum values. To analyze the comparison between right ear and left ear test was used t-test. We used the Pearson correlation coefficient to assess
was used to an analysis of variance and Tukey test. In all statistical tests we adopted a significance level of 5% (p <0.05).
R
ESULTSRegarding the characterization of the study population, this study was composed only by male workers, ranging from age 19 to 54 years, with 63.16% of the sample had between 19 and 35 years, 21.05% were aged between 36 to 45 years and 15.79% aged 46-54 years.
In the interview specifies, it can be seen that the presence of tinnitus were reported by one subject (1.32%). No other symptoms were identified impaired or non-occupational information.
The prevalence of altered audiometry was 22.36%.
While investigating, through Friedaman test if there was any more often affected, there were no significant results.
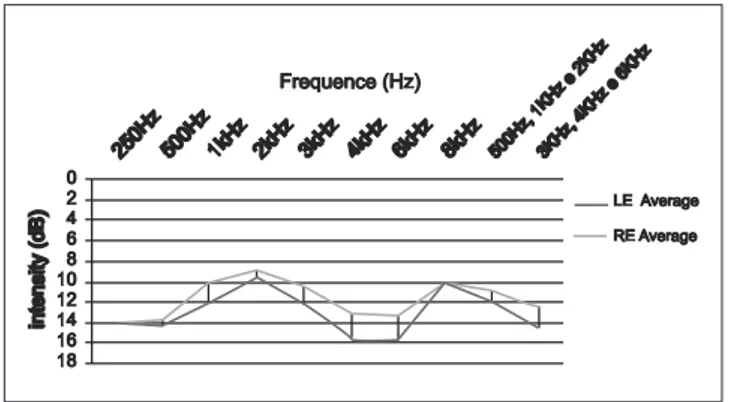
Chart 1 shows the mean thresholds for all frequencies studied, considering the average tritonal (500Hz, 1kHz and 2kHz) and (3 kHz, 4 kHz and 6 kHz) for both ears through the paired t test, in which the frequencies of 500KHz, 1kHz, 2kHz and 3kHz average of tritonal, 4kHz and 6kHz both ears studied showed statistically significant result. In the right and left ears, the average tritonal 500Hz, 1kHz and 2kHz, obtained was 11.67 dB, while the average tritonal 3kHz, 4kHz and 6kHz for the right ear was 10.83 dB while the left ear was 13 33 dB. Thus, there are increased thresholds for high frequencies.
Regarding the age groups studied, the highest prevalence was obtained from changes observed in the older age groups. Table 1, using the Test of Pearson Correlation Coefficient presents data averages tritonal correlation with the age groups.
Picture 1.Number of citations found in search sources on the studies related to hearing loss in drivers.
Descriptors Source Search
Cochrane Medline Lilacs SicElo
Hearing loss and drivers 7 20 4 0
Picture 2. Studies related hearing loss in drivers.
Authors/Year Objective Casuistry Age Prevalence of DA
Cordeiro, Lima-Filho e Associated between 278 drivers: Without Without
Birth / 1994 induced hearing loss 147 drivers information information
by noise and cumulative 131collectors of vehicles
time of work collective of the city of
Campinas - SP
Martins e cols / 2001 Investigate the hearing 174 participants 18 to 60 37%
(140 bus drivers years old group of drivers (34%)
e 34 collectors) group of collectors (3%)
Corrêa Filho et al / 2002 To estimate the 108 drivers of Average of 32.7% of the
prevalence hearing loss Campinas - SP 38.64 years total examined
of and noise-induced hypertension in urban bus drivers
Cepinho, Corrêa, Investigate hearing 111 drivers from 35 to 43 4,5% GI and
Bernardi / 2003 GI bus years old 11,5% GII
57 GII truck drivers
Freitas e Nakamura / To study the incidence of 104 drivers from 21 to 63 19% of
2004 induced hearing loss two companies years old, audiometries
by noise in drivers mass transport with average
from bus with the engine from from 37,5 years
checking the front Campinas - SP
audiological profile of this population
Silva e Mendes / 2005 Quantify exposure 141 drivers of Without 46% in the group
of bus drivers Bus - group exposed information considered as above
the body vibration - and control group, and 24% no defined as
whole and noise, and being 74 (52,5%) of unexposed
analyze the possible group with a driver
association between in the company
These two factors not exceeding three years
of risk for PAIR 67(47,5%) with
five years or more
Siviero et al / 2005 To study the prevalence 50 drivers from Without 28% of audiograms
hearing loss audiometric and the bus, with time information suggesting PAINSPE
characteristics on drivers of exposure to
City Bus noise over
Maringá - Paraná five years
Silva, Gomes, Zaher / Audiological profile 28 drivers Until 63 yeras 50% presented PAIR
2006 from ambulance
drivers
Lopes, Russo, Fiorini / Studying the hearing 75 drivers 27 to 61 years 28,6%
2007 and its relationship to Truck with time profession
life quality in drivers varying
of trucks 5 a 40 years
Janghorbani, Sheikhi, Estimating the Random sample of Greater than or Prvalence of bilateral PAIR
Pourabdian / 2009 prevalende and the 4300 drivers that equal to 20 was of 18,1%, bigger in
factores risks drives over long years right ear 6,5% do
created three groups with Group I consists of workers aged 19-35 years, group II of 36 to 45 years and group III 46-54 years. Table 2 shows the mean and standard deviation of hearing thresholds in these age groups.
From the results presented in Table 2 it was noted that the frequencies of 3 kHz, and the average tritonal 3kHz, 4kHz and 6kHz in the right ear and left ear 3kHz significant difference between the age group 19-35 years and 46 to 54 years, so those frequencies in the lower age group had better hearing thresholds than the group aged 46-54 years. The frequency of 6 kHz in the right ear with the group aged 36 to 45 showed better thresholds statistically significant compared to groups aged between 46 and 54 years.
D
ISCUSSIONThe health care worker is a will that intertwines
psychologists, nurses, speech therapists, as well as management teams.
Traffic noise is a major cause of noise pollution, especially in large centers. Several studies have described the compromises health in drivers, since the performance of professional drivers is of great responsibility, are responsible for the care and safety of the vehicle, lives under its responsibility, valuable and toxic loads, defective signaling pathways in addition to their own health care, these added responsibilities, this profession is characterized by daily challenges that the driver is forced to confront in their working day. Besides these aspects, excessive noise, heat it gives off from inside the cab, the conformation of the chair, not always anatomically correct, and remaining in the same position in front of the steering wheel, these professionals require intense physical and mental activity.
In this study, the age of the study population Table 2. Mean and standard deviation of hearing thresholds in the different age groups.
Graphic 1. Shows the comparison between the average hearing thresholds of right and left ears done all frequencies studied and compare the average of hearing thresholds of mid frequencies (500Hz, 1kHz and 2kHz) and high (3 kHz, 4 kHz and 6 kHz) for both ears.
Table 1. Correlation between age groups and the average tritonal.
Correlation R P
500Hz, 1kHz e 2kHz OD 0,2641 0,021*
500Hz, 1kHz e 2kHz OE 0,1945 0,092
3kHz, 4kHz e 6kHz OD 0,2459 0,032*
3kHz, 4kHz e 6kHz OE 0,3026 0,008*
* Statistically significant correlation (p<0,05)
Age group Ear 250Hz 500Hz 1KHz 2kHz 3 kHz 4kHz 6kHz 8kHz frequencies high averages frequencies Aver. SD Aver. SD Aver. SD Aver. SD Aver. SD Aver. SD Aver. SD Aver. SD Aver. SD Aver. SD 19 a 35 14.63 4.77 13.65 4.58 9.58 6.09 7.71 7.07 8.75 7.96 12.08 11.62 9.89 11.46 9.27 8.87 10.31 4.68 11.22 8.77 36 a 45 Right 12.19 7.74 12.19 7.74 9.69 6.45 9.69 6.94 11.25 10.80 10.94 9.87 9.71 11.25 12.50 9.83 10.52 5.70 10.77 8.26 46 a 54 15.42 3.96 16.25 4.83 12.92 5.82 12.50 10.55 16.25 11.51 20.00 10.22 7.53 13.75 10.83 10.19 13.89 5.43 18.61 8.25
19 a 35 13.85 5.95 14.17 4.58 4.83 6.09 9.17 5.86 10.42 8.30 12.81 11.98 15.10 11.32 8.65 9.49 11.60 3.95 12.78 9.44 36 a 45 Left 13.75 6.71 13.44 7.74 5.32 6.45 10.31 6.70 14.06 8.61 18.13 7.72 15.63 9.98 11.88 9.46 11.67 5.34 15.94 8.12 46 a 54 15.83 4.69 15.83 4.83 6.08 5.82 10.42 6.56 17.08 12.70 23.75 12.45 18.33 10.52 13.75 10.25 13.33 4.08 19.72 8.81
0 0 2 2 4 4 6 6 8 8 10 10 12 12 14 14 16 16 18 18
intensity (dB)intensity (dB)
Frequence (Hz) Frequence (Hz)
LE LE AAverageverage
RE RE AAverageverage
250Hz
of males, justified in terms of the professional category studied, since this also obtained in all studies cited in the literature.
Another data obtained from medical records analyzed was that there was only one information from tinnitus (1.32%), information obtained in a participant 54 years of age who had normal audiogram, bilaterally. Tinnitus is a common complaint and is present in 4% of the sample of the work of Araujo (2002) (14) and 2.75% in the work of LOPES and NELLI (2008) (15). We believe that in this study there was no association of altered thresholds and tinnitus probably by way of collecting information.
Considering the results obtained in this study, an alarming factor, though expected, was the prevalence of abnormal audiograms, since PAIR ranks second among the most frequent diseases of the hearing. In this study, the prevalence of abnormal tests was 22.36%, this figure is equivalent to other studies. In studies HANGER and BARBOSA-BRANCO (2004) (3) had a prevalence of 48% in workers exposed to noise, LOPES and NELLI (2009) (15) the prevalence was 24.75%, this professional category, previous studies showed a prevalence ranging from 4.5% to 46% (16,12,9,10,11,17,18 and 13). Although the literature indicates a high prevalence of abnormal tests in subjects exposed to occupational noise, 100% of the records analyzed reported no abuse hearing, given that observed in previous studies (19).
The comparative analysis between the mean tritonal 500, 1kHz and 2kHz and 3kHz, 4kHz and 6kHz, as can be seen in Table 1, demonstrates worse thresholds for high frequencies, meeting with literature data (20, 21, 14 and 15).
In analyzing whether age influenced the participants studied in auditory thresholds, as shown in Table 2 the age influenced the audiometric findings, the higher the age, the higher thresholds, as well as the findings of LOPES, RUSSO and FIORINI, 2007 (12) and LOPES and NELLI, 2009 (15).
By analyzing the results of audiometry admission of these workers and assuming 100% of them did not complain hearing, and the prevalence of abnormal tests was high it is essential that the audiometric assessment should not only indicate the annual prevalence of hearing impairment, but rather by midst deploy a Prevention Program hearing Loss (PPPA), which primarily promotes actions to prevent the onset or worsening of hearing loss, as well as the extra-auditory effects caused by exposure to loud noise or other risk agents to audition for professional drivers. Once you for good job performance, the driver
should enjoy good health, working hours and conditions appropriate.
Finally, there is the need for greater investment in research capable of providing subsidies to create viable strategies for prevention and intervention in this population.
C
ONCLUSIONThis study has highlighted the occurrence of hearing loss suggestive of work-related hearing loss in the absence of hearing complaints. Considering that PAIR is preventable, justifies the importance of coordinated and multidisciplinary involving not only health teams and safety, but also the institutions involved in preserving the health of workers, as the team SESMET, unions or prosecutors.
R
EFERENCES1. Gabas G. Listen well and protect yourself. Rev Protection. 2007, 181:54-61.
2. Atti JL, Correa AG, Stefani F, Vaccaro S. Noise Induced Hearing Loss. Rev Cient AMECS. 2000, 9(2):40-4.
3. Hanger MRHC, Barbosa-Branco A. Auditory effects resulting from occupational noise exposure in workers at quarries in the Federal District. Rev Brazilian Med Assoc. São Paulo. 2004, 50(4):396-9.
4. Gatto C, Lerman RA, Teixeira, TM, Magni C, Morata TC. The analysis of the conduct of doctors before workers with hearing loss. Rev. Communication Disorders. São Paulo. 2005, 17(1):101-14.
5. Hétu R, Quoc HT. Psychoacoustic performance in workers with PAIR. In: Axelson A, Bordigrevink H, Hamernik RP, Hellstrom P, Henderson D, Salvi RJ, editors. Scientific basis of noise-induced hearing loss. New York: Thieme; 1996. p. 264-85.
6. Silva GLL, Gomes MVSG, Zaher VL. Audiological profile of ambulance drivers from two hospitals in the city of São Paulo, Brazil. Arq Int Otolaryngol. 2006, 10(2):132-140.
7. Ferreira Jr M. Noise-induced hearing loss. In: Ferreira Jr Ed. Worker Health. São Paulo: Rocca; 2000, p.265-85.
9. Martins AL, Alvarenga KF, Bevilacqua MC, Costa Filho AO. Hearing loss in bus drivers and conductors. Rev Bras Otolaryngol. 2001, 67(4):467-73.
10. Corrêa Filho HR, Costa LS, Hoehne EL, Pérez MAG, Nascimento LCR, Moura EC. Noise-induced hearing loss and hypertension in bus drivers. Rev Public Health. 2002, 36(6):693-701.
11. Freitas RGF, NAKAMURA HY. Noise Induced Hearing Loss in Bus Drivers with Motor Front. Health Rev Piracicaba. 2003, 5(10):13-19.
12. Lopes G, Russo ICP e Fiorini AC. Study of hearing and quality of life in truck drivers. Rev CEFAC. 2007, 9(4):532-42.
13. Janghorbani M, Sheikhi A, Pourabdian S. The prevalence and correlates of hearing loss in drivers in isfahan, iran. Archives of Iranian medicine. 2009, 12(2):128-34.
14. Araujo SA. Noise-induced hearing loss among workers of metallurgical. Rev Bras Otolaryngol. 2002, 68(1):47-52.
15. Lopes AC, Nelli MP, Lauris JRP, Amorin RB, MeloADP. Terms of hearing health at work: investigation of auditory effects in workers exposed to occupational noise. Arq Int Otolaryngol. 2009, 13(1):49-54.
16. Cepinho PC, Correa A, Bernardi APA. Hearing loss in
truck and bus drivers from Sao Paulo. Rev Cefac. 2003, 5(2):181-6.
17. Silva LF; Mendes R. Combined exposure to noise and vibration and its effects on the hearing of workers. Rev Public Health. 2005, 39(1):9-17.
18. Siviero AB; Fernandes MJ, Lima JAC; Santoni CB, Bernadi APA. Prevalence of hearing loss among drivers of public transport buses in the city of Maringá, PR. Rev Cefac. 2005, 7(3):376-81.
19. Amorin RB, Lopes AC, Santos KTP, Melo ADP, Lauris JRP. Changes in Occupational Hearing Exposure Musicians. Arq Intern Otolaryngol. 2008, 12(3):377-83.
20. Kós AOA, Kós MI. Etiologies of hearing loss and auditory characteristics. In: Frota, Silava. Fundamentals in Speech. Rio de Janeiro: Ed. Guanabara Koogan, 1998.
21. Ruggieri M, Cattan S, Giardini LDL, Oliveira KAS. Noise-induced hearing loss in 472 workers from the region of ABC. Arq Méd ABC. 1991, 14(1):19-23.
References which are cited only in table 2