Abstract
Submitted: November 15, 2016
Modiication: April 7, 2017 Accepted: May 19, 2017
Reliability of light microscopy
and a computer-assisted replica
measurement technique for
evaluating the it of dental copings
The aim of this in vitro study was to assess the reliability of two measurement systems for evaluating the marginal and internal it of dental copings. Material and Methods: Sixteen CAD/CAM titanium copings were produced for a prepared maxillary canine. To modify the CAD surface model using different parameters (data density; enlargement in different directions), varying it was created. Five light-body silicone replicas representing the gap between the canine and the coping were made for each coping and for each measurement method: (1) light microscopy measurements (LMMs); and (2) computer-assisted measurements (CASMs) using an optical digitizing system. Two investigators independently measured the marginal and internal it using both methods. The inter-rater reliability [intraclass correlation coeficient (ICC)] and agreement [Bland-Altman (bias) analyses]: mean of the differences (bias) between two measurements [the closer to zero the mean (bias) is, the higher the agreement between the two measurements] were calculated for several measurement points (marginal-distal, marginal-buccal, axial-buccal, incisal). For the LMM technique, one investigator repeated the measurements to determine repeatability (intra-rater reliability and agreement). Results: For inter-rater reliability, the ICC was 0.848-0.998 for LMMs and 0.945-0.999 for CASMs, depending on the measurement point. Bland-Altman bias was -15.7 to 3.5 µm for LMMs and -3.0 to 1.9 µm for CASMs. For LMMs, the marginal-distal and marginal-buccal measurement points showed the lowest ICC (0.848/0.978) and the highest bias (-15.7 µm/-7.6 µm). With the intra-rater reliability and agreement (repeatability) for LMMs, the ICC was 0.970-0.998 and bias was -1.3 to 2.3 µm. Conclusion: LMMs showed lower inter-rater reliability and agreement at the marginal measurement points than CASMs, which indicates a more subjective inluence with LMMs at these measurement points. The values, however, were still clinically acceptable. LMMs showed very high intra-rater reliability and agreement for all measurement points, indicating high repeatability.
Keywords: Prosthodontics. Computer-aided design. Computer-aided manufacturing. Permanent dental restoration. Reproducibility of results.
Heike RUDOLPH1
Silke OSTERTAG2,3
Michael OSTERTAG2,4
Michael H. WALTER2
Ralph Gunnar LUTHARDT1
Katharina KUHN1
Original Article
http://dx.doi.org/10.1590/1678-7757-2016-0590
1Universität Ulm, Zentrum für Zahn-, Mund- und Kieferheilkunde, Klinik für Zahnärztliche Prothetik, Ulm, Deutschland.
2Technische Universität Dresden, Medizinische Fakultät Carl Gustav Carus, Poliklinik für Zahnärztliche Prothetik, Dresden, Deutschland.
3Private practice, Esslingen, Deutschland. 4Private practice, Stuttgart, Deutschland.
Corresponding address: Katharina Kuhn Center of Dentistry - Department of Prosthetic
Introduction
The it of dental restorations has been subjected to numerous investigations. A poor marginal it is associated with secondary caries6, which is among the most common causes of ixed partial-denture loss28. Both marginal and internal it measurements
are used to evaluate new materials and manufacturing
procedures for dental restoration9-13,21,26.
Many measurement methods have been established to investigate the it of dental restorations. To conirm a method’s validity, however, two methods should be
studied and compared22. A commonly used method is
the internal silicone replica technique, described by Holmes, et al.5 (1989), which enables the investigation of both marginal and internal gaps. Light-body silicone replicas ill the space between the restoration and the die. They are coated from the inner or outer side with a heavy-body silicone of various colors. After stabilization of the thin light-body material, the replicas are cut in different planes for analysis by light
microscopy9,11-13,15,19,21,30.
Another possibility for determining the replica’s
thickness is a computer-assisted technique that
measures the optically captured replicas digitally14,20.
The validity of the replica technique for the predictable
reproduction of cement thickness, regardless of the
measurement point location, has been proven15.
However, evidence regarding the reliability and
repeatability of the conventional light microscopy
replica technique is sparse21, and none are available for the more recent computer-assisted replica technique. The reliability of a measurement method is determined
by comparing the measurements performed by several
investigators (inter-rater reliability and agreement),
whereas repeatability is calculated by repeated measurements by the same investigator. Thus, repeatability can be referred to as intra-rater reliability and agreement, which is done throughout this paper. This study focused on analyzing the reliability and repeatability of the conventional light microscopy
replica technique by determining both inter-rater and intra-rater reliability and agreement for speciic measurement point locations. As a second step, the study aimed to compare the conventional light
microscopy replica technique to the more recent
computer-assisted replica technique by means of the
respective inter-rater reliability and agreement for speciic measurement point locations.
The hypotheses for this in vitro study were that:
(1) the conventional light microscopy replica technique for the analysis of dental coping it shows high intra-rater reliability and agreement; (2) the conventional light microscopy method and the computer-assisted
replica technique for the analysis of dental coping it show high inter-rater reliability and agreement; and (3) the intra-rater and inter-rater reliability and agreement are independent of the specific
measurement point location for the conventional light
microscopy technique (intra-rater and inter-rater) and
the computer-assisted replica technique (inter-rater) for analyzing dental coping it.
Material and methods
Manufacture of copings and replicas
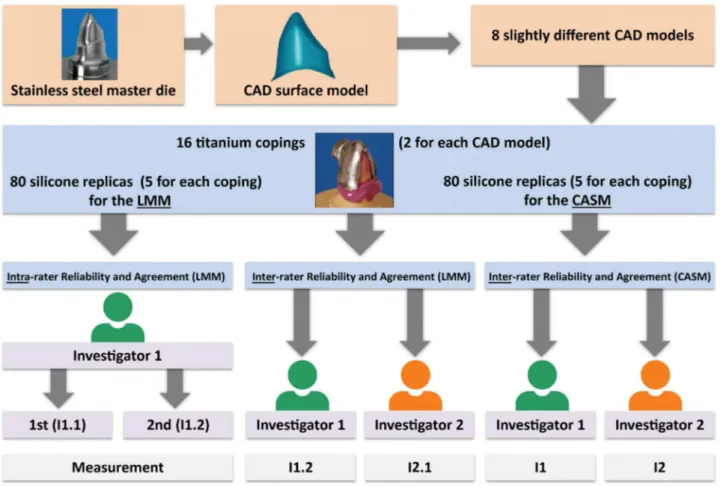
A prepared (chamfer) stainless steel maxillary canine (FDI 13) and its computer-aided design (CAD) surface model served as the master die (height 7.8 mm, cone angle 4°, bucco-oral diameter 10 mm at the margin). Using the CAD software (Surfacer®V.10.0; Imageware Inc., Ann Arbor, MI, USA), the parameters were modiied to create eight different CAD models resulting in varying fit. Therefore, the following parameters were modiied: four CAD models showed high data density (point clouds of 123,029) and four CAD models showed low data density (point clouds of 8,513). Both data density groups were modiied with regard to the it by enlarging the originally sized data (1st CAD model) in z-direction (height; 2nd CAD model), in x-/y- direction (circumference; 3rd CAD model) and x-/y-/z-direction (height and circumference, 4th CAD model). Two titanium copings were manufactured for each of the eight different CAD models, resulting in 16 copings. For each titanium coping, ive silicone replicas were produced for the light microscopy measurements (LMMs) and for the computer-assisted measurements (CASMs), respectively. This resulted in 80 (16x5) silicone replicas for the LMMs and 80 (16x5) silicone replicas for the CASMs, respectively (Figure 1).
While differences in it inluenced by different CAD model parameters were analyzed in a previous evaluation14, this study focused on the intra- and inter-rater reliability and agreement.
stay on the master die. The restoration was “cemented” with light-body addition-curing silicone (Dimension® Garant L; 3MESPE AG, Seefeld, Germany) on the master die with a force of 20 N using a scale with a digital display (Leifheit AG, Nassau/Lahn, Germany). An individual marker ring with grooves fabricated with training alloy (Degussa Dental GmbH & Co., Hanau-Wolfgang, Germany) was used for subsequent reproducible segmentation. After 10 min, using pliers, the restoration was removed from the master die in the axial direction. The master die replicas were reinforced by coating them with a heavy-body addition-curing silicone (clear color contrast) before cutting.
The silicone replicas for the CASMs could not be produced on the master die due to its highly light-relecting metallic surface, which was inappropriate for digitizing by the optical three-coordinate measurement system used (ODKM 97; Fraunhofer Institute for Applied Optics and Precision Engineering, IOF, Jena, Germany). Therefore, 80 plaster dies — one for each replica — were fabricated using the double mix impression technique. Using the plaster dies, replicas (Dimension® Garant L; 3MESPE AG, Seefeld, Germany) were manufactured as described above for the LMMs.
The light-body silicone replica was not coated with heavy-body silicone for stabilization because no cutting was involved.
All replicas for the LMMs and for the CASMs were manufactured by the same operator to guarantee comparability.
LMMs
For the LMMs, the 80 coated replicas were cut with a scalpel in the mesio-distal and buccal-lingual directions according to the impressions of the marker ring. The method described by Holmes, et al.5 (1989) deined the “marginal gap” and the “internal gap”. Two values were gained for the marginal-buccal (ma-b), marginal-distal (ma-d), and axial-buccal (ax-b) measurement points, and eight values were obtained for the incisal (inc)
measurement point, as both sides of each sectional cut were considered (incisal: both sides of four sectional cuts) (Figure 2). At those measurement points, the replica’s thickness was orthogonally determined using a measuring microscope (40× magniication; Zeiss, Jena, Germany). For all analyses, the mean values from both sides of each sectional cut were calculated, resulting in one value for each measurement point:
Figure 1- Study protocol; CAD= computer-aided design. LMM= light microscopy measurement; CASM= computer-assisted measurement;
ma-b, ma-d, ax-b, and inc. Thus, comparability with the computer-assisted measurements (see below) was obtained.
CASMs
For the CASMs, the digitizing system ODKM 97 was used (measurement uncertainty of ~8 µm, as stated by the manufacturer (Fraunhofer Institute for Applied Optics and Precision Engineering, IOF, Jena, Germany)25. Each plaster die was digitalized once
with a replica and once without a replica in the same spatial orientation. Thus, no further alignment of the two resulting point clouds was necessary16. Before digitization, the silicone replica was covered with Cerec® powder (titanium oxide; VITA Zahnfabrik, Bad Säckingen, Germany). Calibration was performed each time the program was initiated and after every 10 measurements. While topical digitalization devices usually perform an automatic calibration before starting a measurement, older systems such as the ODKM 97 needed to be calibrated using standard geometries and a calibration software. The point clouds were processed using software tools (Argus; Fraunhofer Institute for Applied Optics and Precision Engineering, IOF, Jena, Germany) and aligned (Surfacer® 10.6; Ann Arbor, MI, USA) with the corresponding CAD master model, as described by Luthardt, et al.17 (2003). Color-coded difference images (needle plot) in standard (ISO) views were used to determine the 80 replicas’ thickness at measurement points corresponding to those of the LMMs (ma-b, ma-d, ax-b, inc).
Accordance between measurements at both
sides of each sectional cut (LMMs)
The accordance between the two measurements at both sides of each sectional cut (LMMs) was checked. For this purpose, the mean, standard deviation, and minimum and maximum values of the difference (absolute value) between those measurements were calculated exemplarily for the irst measurement of the irst investigator [Investigation 1.1 (I1.1)] (Figure 1).
Intra-rater reliability and agreement (LMMs)
The irst investigator repeated the examination of all existing 80 silicone replicas for the LMMs with the frequently used interval of one week in intra-rater
reliability studies1,3,8, resulting in two measurements: I1.1 and I1.2. The measurements of the 80 replicas’ thickness were analyzed separately for the first and second examination and for the measurement points. The mean, median, minimum, and maximum values were calculated and presented in bar charts. For determining intra-rater reliability, the intraclass correlation coeficient (ICC) was calculated using a two-way random effects model27 with the unjustiied model (“absolute agreement”). In addition, Bland-Altman bias analyses2 were performed to determine the intra-rater agreement. The mean of the differences (bias) between the two measurements (I1.1 minus I1.2; no absolute values) at a speciic measurement point was calculated. The closer to zero the mean is, the lower is the bias and the higher the agreement Figure 2- Measurement points: marginal-buccal (ma-b), marginal-distal (ma-d), axial-buccal (ax-b), incisal (inc); igure modiied from
between the two measurements.
Inter-rater reliability and agreement (LMMs
and CASMs)
The measurements were performed by two
investigators (postgraduates) with the same professional status (Dr. med. dent. candidates). The training time for the LMMs and ODKMs before starting the measurements was the same for each investigator. The irst investigator performed both LMMs (I1.1 and I1.2, twice) and the CASMs (I1, once). For calculation of inter-rater reliability and agreement, only one measurement of the first investigator (LMM) was randomly chosen (I1.2). The second investigator repeated the measurements independently from the irst investigator, once for both measurement systems (LMM: I2.1 and CASM: I2) (Figure 1). The measurements of the 80 replicas’ thickness were analyzed separately for the irst and second investigator for both measurement techniques and for the measurement points. The mean, median, minimum, and maximum values were calculated and presented in bar charts. To quantify the inter-rater reliability, the intraclass correlation coeficient (ICC) was calculated using a two-way random effects model27 with the unjustiied model (“absolute agreement”). This correlation coeficient is suitable for both intra-rater and inter-intra-rater reliability23. In addition,
Bland-Altman bias analyses2 were performed to determine the inter-rater agreement. The mean of the differences (bias) between the two examiners’ measurements (LMMs: I1.2 minus I2.1; CASMs: I1 minus I2; no absolute values) at a speciic measurement point was
calculated.
The IBM SPSS Statistics software (IBM SPSS 21.0; IBM Corporation, Armonk, NY, USA) was used for all analyses.
Results
Accordance between measurements at both
sides of each sectional cut (LMMs)
The mean ± SD (minimum value, maximum value) of the difference (absolute value) between the two measurements at each sectional cut was 5±7 µm (0, 50 µm) for the marginal values (ma-b, ma-d), 7±6 µm (0, 20 µm) for the axial values (ax-b), and 20±29 µm (0, 190 µm) for the incisal values (inc).
Intra-rater reliability and agreement (LMMs)
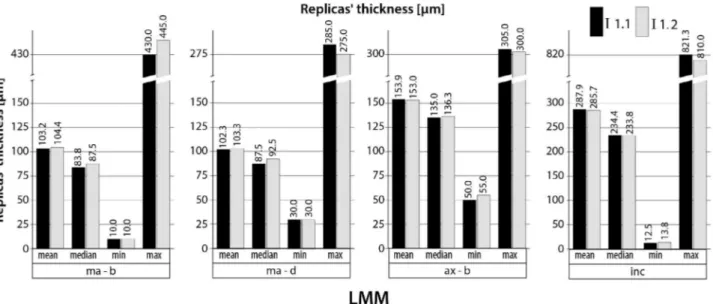
The results of the 80 replicas’ thickness measurements (mean, median, minimum, and maximum values) are shown in bar charts (Figure 3) for each examination of the irst investigator (I1.1 and I1.2) and for each measurement point. The ICCs for the intra-rater reliability ranged from 0.970 to 0.998 (LMM) and the bias from -1.3 to 2.3 µm, depending on the respective measurement point. For the marginal measurement points (ma-b and ma-d), the irst investigator measured the replicas’ thickness systematically slightly lower the irst time (I1.1) than the second time (I1.2), resulting in a negative bias (e.g. -1.0 µm for ma-d measurement point). For the ax-b and inc measurement points, the irst investigator
Figure 3- Replicas’ thickness (n=80) for the light microscopy measurements (LMMs); I1.1 and I1.2= irst and second measurements of the
measured the replicas’ thickness systematically slightly higher the irst time (I1.1) than the second time (I1.2), resulting in a positive bias (e.g. ax-b: 0.9 µm). The ICC and its 95% conidence interval (CI), as
well as the bias are shown in Table 1 for each speciic measurement point.
ICC (LL; UL) for intra-rater reliability (LMMs;
I1.1 and I1.2)
ICC (LL; UL) for inter-rater reliability
(LMMs; I1.2 and I2.1)
ICC (LL; UL) for inter-rater reliability
(CASMs; I1 and I2)
bias [µm] for intra-rater agreement (LMMs; I1.1-I1.2)
bias [µm] for inter-rater agreement (LMMs; I1.2-I2.1)
bias [µm] for inter-rater agreement (CASMs; I1-I2)
ma-b 0.993 (0.990;0.996) 0.978 (0.958;0.988) 0.984 (0.975;0.990) -1.3 -7.6 0.8 ma-d 0.970 (0.954;0.981) 0.848 (0.702;0.915) 0.994 (0.991;0.996) -1.0 -15.7 1.9
ax-b 0.992 (0.988;0.995) 0.984 (0.974;0.990) 0.945 (0.916;0.965) 0.9 3.5 -3.0 inc 0.998 (0.998;0.999) 0.998 (0.997;0.999) 0.999 (0.999;1.000) 2.3 -2.2 -1.4
Table 1- Intraclass correlation coeficient analyses for intra-rater reliability for LMM and for inter-rater reliability for LMM versus CASM;
Bland-Altman bias analysis for intra-rater agreement for LMM and for inter-rater agreement for LMM versus CASM
Deinitions: ICC= intraclass correlation coeficient; LL= lower limit; UL= upper limit; LMMs= light microscopy measurements; CASMs= computer-assisted measurements; I1.1 and I1.2= irst and second measurements of the irst investigator (LMM); I2.1= measurement of the second investigator (LMM); I1 and I2= measurements of the irst and second investigators (CASM); bias= mean of differences between measurements at speciic measurement points.
Measurement points: marginal-buccal (ma-b), marginal-distal (ma-d), axial-buccal (ax-b), incisal (inc).
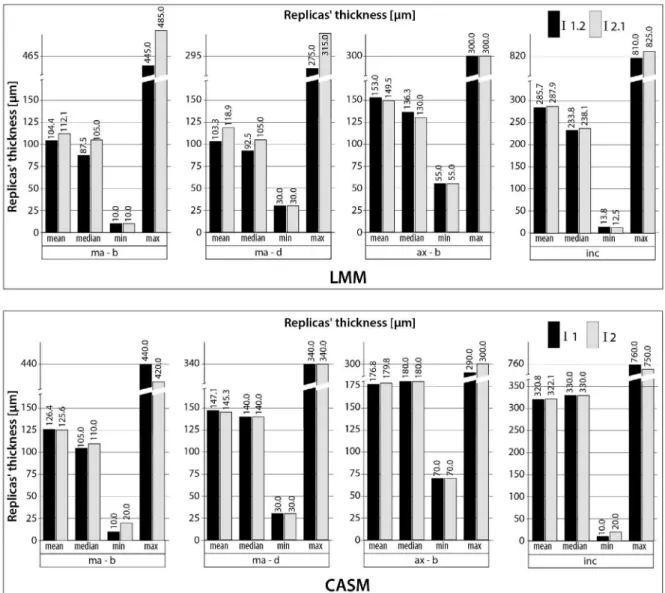
Figure 4- Replicas’ thickness (n=80 for each measurement technique) for the light microscopy measurements (LMMs) and for the
Inter-rater reliability and agreement (LMMs
and CASMs)
The results of the 80 replicas’ thickness measurements (mean, median, minimum, and maximum values) are shown in bar charts (Figure 4) for each examination (LMM: I1.2 versus I2.1; CASM: I1 versus I2) and for each measurement point. The ICCs for the inter-rater reliability ranged from 0.848 to 0.998 (LMM) and from 0.945 to 0.999 (CASM). The bias also showed a wider range between the speciic measurement points for the LMMs (-15.7 to 3.5 µm) than for the CASMs (-3.0 to 1.9 µm). For the LMMs, the irst investigator (I1.2) measured the replicas’ thickness systematically lower (exception: measurement point ax-b) than the second investigator (I2.1), resulting in a negative bias (e.g. -15.7 µm for ma-d measurement point). The ICC and its 95% CI and the bias are shown in Table 1 for each measurement point.
Discussion
The ICC for the intra-rater reliability of the LMMs shows very high values and a rather narrow 95% CI. The bias shows values very close to zero for all measurement points. These results indicate high repeatability of LMMs in the current study, regardless of the speciic measurement points. Thus, the study’s first hypothesis can be accepted, and the third
hypothesis can also be accepted for the intra-rater evaluation of the LMMs.
The inter-rater reliability for the LMMs shows similarly high values for the ICC, except for the ma-d measurement, which has a slightly lower ICC (<0.9) and a wider 95% CI for the ICC. The bias shows this dependence on the measurement point more clearly. Although the bias for the ax-d and inc measurement points is still close to zero, the ma-b bias is almost 6 times higher and the ma-d bias is almost 16 times higher than the bias for the intra-rater agreement. The first investigator systematically determined
lower marginal values (ma-b, ma-d) than the second investigator, which may have been due to the dificulty identifying the exact marginal measurement point. The light-body material thins toward the margins, in contrast to the thicker layers that are found axially and incisally. Thus, the Bland-Altman bias gave a more differentiated view than the ICC, as has been
previously claimed2. In summary, the results indicate a subjective inluence for the LMMs at the ma-b and ma-d measurement points. The inter-rater reliability of the LMMs still seems acceptable, however, given the clinically acceptable marginal it values7,29. Thus, the study’s second hypothesis can be accepted, whereas
the third hypothesis must be rejected for inter-rater evaluation using LMMs.
The inter-rater reliability for the CASMs shows very high ICC values with a rather narrow 95% CI. The bias values are closer to zero than the LMMs’ bias values for every measurement point and are rather independent of the measurement point. These differences can be explained by the different method of determining the replica’s thickness. For the CASM technique, no perpendicular measurement5 is needed. Instead, the thickness is automatically given in the color-coded difference images (needle plot) at a speciic measurement point determined by the examiner. In summary, the results indicate that the CASM technique is somewhat more objective than the LMM technique and is independent of the measurement point. Thus, the study’s second and third hypotheses can be accepted for the CASM technique.
The inluence of the investigators’ professional status on the measurement results was not evaluated,
which could be considered a limitation of the study. However, for the inter-rater analyses, the measurements were performed by two investigators
(postgraduates) with the same professional status (Dr. med. dent. candidates). Thus, a comparison between two individuals’ measurements (inter-rater)
was possible without a further interfering factor (professional status). However, the influence of this possible interfering factor is a further aspect of
interest and should be addressed in future studies in this research ield.
The use of computer-assisted analyses is a constantly growing ield not only in dental research. While the conventional replica technique does not require high investment costs and is easily learned, the opposite is true for the CASM technique. The latter technique implies the use of complex software for digitizing and analysis. Fortunately, topical software are becoming more user-friendly.
As an in vitro investigation, this study shows the
well-known limitations of in vitro studies compared to
in vivo studies; e.g. it is lacking a randomized design in
A speciic limitation of in vitro coping it analyses
studies is the artiicially superior coping it compared to the achievable coping it under in vivo conditions.
Clinical factors, e.g. saliva or blood contamination, during dental impression making or margin geometry, lead to unintended modiications in coping it18. In addition, in vivo studies evaluating the intra- and
inter-rater reliability of measurement techniques usually
include different patients1,3,8. To simulate in vivo
conditions, we performed modiications on purpose to create different CAD models. The different CAD models successfully resulted in copings with varying it and thus varying replicas’ thickness between the samples as shown before14, which can also be seen
in the wide range of values for the replicas’ thickness for each measurement point (Figures 3 and 4). A further positive aspect of this in vitro study is the measurement of 80 replicas resulting in a rather high sample size. This enhances the quality of our analyses.
The analyses of the 80 replicas’ thickness showed similar values (mean, median, minimum, and maximum values) for both measurements of the irst investigator (intra-rater testing). For the inter-rater testing, these values showed higher accordance
between both investigators’ measurements for the CASM than for the LMM, which is in accordance with the results of the ICC and bias analyses above. The CASMs tended to show higher mean values for the replicas’ thickness than the LMMs. This phenomenon has already been described in a study that compared
both techniques14. The difference between the values is in the range of powder thickness (20–40 µm under ideal conditions)4,20. For the CASM technique,
a powder had to be applied on the replica against surface relection and light scattering. Using optically digitizable silicones would eliminate the need for the powder20. However, this phenomenon did not inluence the CASM inter-rater analyses as both examiners performed the measurements on the same, previously powdered samples.
For the LMMs, we used the mean at both sides of each sectional cut for the marginal and axial values and the mean of eight measurements (both sides of four sectional cuts) for the incisal value. This was done to have points analogous to those used for the CASMs, in which no cutting took place, and to reduce error15. To
estimate the impact of this procedure, we determined
the accordance between the measurements at both sides of each sectional cut. This analysis revealed a
rather high accordance for the marginal and axial values. The accordance for the incisal values was lower but still clinically suficient.
For the CASM technique, the replicas were manufactured on duplicate plaster dies due to the stainless steel master dies’ relection. For the LMM technique, the replicas were directly manufactured on the master die. The mean values for the difference between duplicate plaster dies and steel master die are +9.2/-8.5 µm (SD 1.1/0.5) for the identical plaster dies’ manufacturing procedure (identical master die/ impression technique and material/ plaster material)24. Thus, areas of reduction (mean: -8.5 µm) and areas of enlargement (mean: +9.2 µm) compared to the steel master die were found resulting in higher or
lower thickness of the replicas on the plaster dies for the CASMs. However, this error can be classiied as negligible, as the mean values are in the range of the measurement uncertainty of 8 µm of the ODMK 97 digitizing system, and show a very low standard deviation (SD 1.1/0.5)24. Besides, the error can be classiied as a systematic one due to the identical manufacturing procedure for all gypsum dies. It did not inluence the CASM inter-rater analyses, as both examiners performed the measurements on the same samples.
Despite multiple studies evaluating the crown it with the replica technique using LMMs22, their intra- and inter-rater reliability and agreement has rarely been determined. Molin and Karlsson21 (1993) determined the mean difference and the coeficient of correlation between pairwise measurements for the replica technique with LMMs for inlay preparations. However, they did not specify how they calculated the mean difference (absolute values or not: “bias”) and the coeficient of correlation. They also did not clarify whether the pairwise measurements had
been performed by a single investigator (intra-rater
reliability) or different investigators (inter-rater reliability). Neither the measurement points nor the inlay material used for the correlation analyses was speciied. Thus, our study is the irst to have evaluated both intra- and inter-rater reliability (ICC) and agreement (Bland-Altman bias) for the replica technique with LMMs separately for different measurement points. The replica technique with CASMs14,20 used in this study had not been previously evaluated for its reliability.
techniques, LMMs and CASMs, using identical copings. Thus, for the irst time, a direct comparison of inter-rater reliability and agreement between the LMM and CASM techniques was possible, which adds new information to studies in this area. The comparison showed slightly higher reliability and agreement with the CASM technique and no dependence on the measurement points — in contrast to the LMM technique.
Light microscopy and the computer-assisted replica
technique are used in studies to evaluate new materials
used and new manufacturing procedures applied for
dental restorations for daily clinical practice9-14,20,21,30. Given the clinically acceptable marginal it values7,29, both techniques are reliable methods for the evaluation of dental restoration it prior to the clinical use of new materials and manufacturing procedures for dental restorations. However, the CASM technique shows slightly superior reliability, especially for determining the marginal it.
Conclusion
The following conclusions can be drawn for the
internal replica technique for evaluating the marginal and internal it of dental copings.
The light microscopy replica measurements
showed high intra-rater reliability and agreement
(repeatability) and somewhat worse, but still clinically
acceptable, inter-rater reliability and agreement at the marginal measurement points.
The computer-assisted replica measurement was
slightly more objective than the light microscopy
replica measurement and was independent from the measurement point.
Acknowledgments
These results are based on a doctoral dissertation submitted to the Medical Faculty Carl Gustav Carus, Dresden University of Technology, Germany, by Silke Ostertag née Benzinger in 2004. The authors declare that there was no external funding. The authors have no conlicts of interest to declare.
References
1- Baude M, Mardale V, Loche CM, Hutin E, Gracies JM, Bayle N. Intra- and inter-rater reliability of the Modiied Frenchay Scale to measure active upper limb function in hemiparetic patients. Ann Phys Rehabil Med. 2016;59S:e59-e60.
2- Bland JM, Altman DG. Statistical methods for assessing agreement between two methods of clinical measurement. Lancet. 1986;1(8476):307-10.
3- Blomkvist AW, Andersen S, de Bruin E, Jorgensen MG. Unilateral lower limb strength assessed using the Nintendo Wii Balance Board: a simple and reliable method. Aging Clin Exp Res. 2016. doi:10.1007/ s40520-016-0692-5. Epub ahead of print.
4- Hickel R, Dasch W, Mehl A, Kremers L. CAD/CAM - illings of the future? Int Dent J. 1997;47(5):247-58.
5- Holmes JR, Bayne SC, Holland GA, Sulik WD. Considerations in measurement of marginal it. J Prosthet Dent. 1989;62(4):405-8. 6- Karlsson S. A clinical evaluation of ixed bridges, 10 years following insertion. J Oral Rehabil. 1986;13(5):423-32.
7- Karlsson S. The it of Procera titanium crowns. An in vitro and clinical
study. Acta Odontol Scand. 1993;51(3):129-34.
8- Kim SJ, Yang YN, Lee JW, Lee JY, Jeong E, Kim BR, et al. Reliability and validity of Korean version of Apraxia Screen of TULIA (K-AST). Ann Rehabil Med. 2016;40(5):769-78.
9- Kohorst P, Brinkmann H, Dittmer MP, Borchers L, Stiesch M. Inluence of the veneering process on the marginal it of zirconia ixed dental prostheses. J Oral Rehabil. 2010;37(4):283-91.
10- Kohorst P, Brinkmann H, Li J, Borchers L, Stiesch M. Marginal accuracy of four-unit zirconia ixed dental prostheses fabricated using different computer-aided design/computer-aided manufacturing systems. Eur J Oral Sci. 2009;117(3):319-25.
11- Kokubo Y, Nagayama Y, Tsumita M, Ohkubo C, Fukushima S, Vult von Steyern P. Clinical marginal and internal gaps of In-Ceram crowns fabricated using the GN-I system. J Oral Rehabil. 2005;32(10):753-8. 12- Kokubo Y, Ohkubo C, Tsumita M, Miyashita A, Vult von Steyern P, Fukushima S. Clinical marginal and internal gaps of Procera AllCeram crowns. J Oral Rehabil. 2005;32(7):526-30.
13- Kokubo Y, Tsumita M, Kano T, Sakurai S, Fukushima S. Clinical marginal and internal gaps of zirconia all-ceramic crowns. J Prosthodont Res. 2011;55(1):40-3.
14- Kuhn K, Ostertag S, Ostertag M, Walter MH, Luthardt RG, Rudolph H. Comparison of an analog and digital quantitative and qualitative analysis for the it of dental copings. Comput Biol Med. 2015;57:32-41. 15- Laurent M, Scheer P, Dejou J, Laborde G. Clinical evaluation of the marginal it of cast crowns - validation of the silicone replica method. J Oral Rehabil. 2008;35(2):116-22.
16- Luthardt RG, Bornemann G, Lemelson S, Walter MH, Hüls A. An innovative method for evaluation of the 3-D internal it of CAD/ CAM crowns fabricated after direct optical versus indirect laser scan digitizing. Int J Prosthodont. 2004;17(6):680-5.
17- Luthardt RG, Kuhmstedt P, Walter MH. A new method for the
computer-aided evaluation of three-dimensional changes in gypsum
materials. Dent Mater. 2003;19(1):19-24.
18- Luthardt RG, Walter MH, Quaas S, Koch R, Rudolph H. Comparison of the three-dimensional correctness of impression techniques: a randomized controlled trial. Quintessence Int. 2010;41(10):845-53. 19- Martins LM, Lorenzoni FC, Melo AO, Silva LM, Oliveira JL, Oliveira PC, et al. Internal it of two all-ceramic systems and metal-ceramic crowns. J Appl Oral Sci. 2012;20(2):235-40.
20- Moldovan O, Luthardt RG, Corcodel N, Rudolph H. Three-dimensional it of CAD/CAM-made zirconia copings. Dent Mater. 2011;27(12):1273-8.
21- Molin M, Karlsson S. The it of gold inlays and three ceramic inlay systems. A clinical and in vitro study. Acta Odontol Scand.
22- Nawaleh NA, Mack F, Evans J, Mackay J, Hatamleh MM. Accuracy
and reliability of methods to measure marginal adaptation of crowns
and FDPs: a literature review. J Prosthodont. 2013;22(5):419-28. 23- Rousson V, Gasser T, Seifert B. Assessing intrarater, interrater and test-retest reliability of continuous measurements. Stat Med. 2002;21(22):3431-46.
24- Rudolph H, Graf MR, Kuhn K, Rupf-Kohler S, Eirich A, Edelmann C, et al. Performance of dental impression materials: benchmarking of materials and techniques by three-dimensional analysis. Dent Mater J. 2015;34(5):572-84.
25- Rudolph H, Salmen H, Moldan M, Kuhn K, Sichwardt V, Wöstmann B, et al. Accuracy of intraoral and extraoral digital data acquisition for dental restorations. J Appl Oral Sci. 2016;24(1):85-94.
26- Shim JS, Lee JS, Lee JY, Choi YJ, Shin SW, Ryu JJ. Effect of
software version and parameter settings on the marginal and internal
adaptation of crowns fabricated with the CAD/CAM system. J Appl Oral Sci. 2015;23(5):515-22.
27- Shrout PE, Fleiss JL. Intraclass correlations: uses in assessing rater reliability. Psychol Bull. 1979;86(2):420-8.
28- Tan K, Pjetursson BE, Lang NP, Chan ES. A systematic review of the survival and complication rates of ixed partial dentures (FPDs) after an observation period of at least 5 years. Clin Oral Implants Res. 2004;15(6):654-66.
29- Valderrama S, Van Roekel N, Andersson M, Goodacre CJ, Munoz CA. A comparison of the marginal and internal adaptation of titanium and gold-platinum-palladium metal ceramic crowns. Int J Prosthodont. 1995;8(1):29-37.
30- Yun MJ, Jeon YC, Jeong CM, Huh JB. Comparison of the it of cast
gold crowns fabricated from the digital and the conventional impression