Abstract
Submitted: May 21, 2016
0RGL¿FDWLRQ6HSWHPEHU
Accepted: September 26, 2016
Cell proliferation markers at the
invasive tumor front of oral squamous
cell carcinoma: comparative analysis
in relation to clinicopathological
parameters of patients
Objectives: To evaluate the number of AgNORs per nucleus and the expression of Ki-67 at the tumor invasion front (TIF) in relation to clinical
carcinomas in an Uruguayan population. Material and Methods: This study was conducted through a retrospective survey from 2000 to 2010 at the National Institute of Cancer Montevideo, Uruguay and included 40 patients. The samples were obtained from the resection of the tumor and the TIF was 5 (1992). Expression of Ki-67 was assessed by the percentage of positive tumor cells and the AgNOR was recorded as the mean AgNOR (mAgNOR) and the percentage of AgNOR per nucleus (pAgNOR). All analyzes were performed by a blinded and calibrated observer. Results:
of Ki-67 and AgNOR with the different types of TIF, regional metastasis and patients prognosis, however it was observed an increase in Ki-67 expression associated with worse patient’s clinical staging, although not statistically
AgNOR and Ki-67 are not prognostic markers at the tumor invasive front of carcinoma of oral squamous cell.
Ke y w or ds: Cell proliferation. Oral cancer.
Aurita Veronica
Beovide CORTEGOSO1
Natalia Koerich LAUREANO2
Alessandra Dutra da SILVA2,3
Chris Krebs DANILEVICZ2
Alessandra Sellinger MAGNUSSON2
Fernanda VISIOLI2
Pantelis Varvaki RADOS2
http://dx.doi.org/10.1590/1678-7757-2016-0238
1Universidad de la República del Uruguay, Facultad de Odontología, Montevideo, Uruguay.
2Universidade Federal do Rio Grande do Sul, Faculdade de Odontologia, Departamento de Patologia Oral, Porto Alegre, RS, Brasil.
3Universidade Luterana do Brasil, Faculdade de Odontologia, Departamento de Patologia Oral, Canoas, RS, Brasil.
Corresponding address: Pantelis Varvaki Rados Universidade Federal do Rio Grande do Sul -
Faculdade de Odontologia Rua Ramiro Barcelos, 2492, sala 503 Porto Alegre - RS - 90035-003 - Brazil Phone: +55 51 3308-5011 Fax +55 51 3308-5427
Introduction
Oral cancer is a important global health disease
with more than 300,000 new cases annually, totalizing over 275,000 cases and 128,000 deaths per year
and the morbidity and mortality rates have not
improved in the past decades18.Studies have shown
different patterns of oral squamous cells carcinomas in the various regions of the world, but few studies
have evaluated this neoplasm in the Uruguayan
population2,9. In addition, in Uruguay oral squamous
cell carcinoma (OSCC) is diagnosed late, which provides poor prognosis and low survival rate for this
disease20.
The high failure rate of treatment for patients with oral OSCC suggests the need for better prognostic
markers to identify aggressive tumors and tumors that
do not respond well to current therapy3. The prognostic
evaluation by the TNM system is limited because it only evaluates clinical parameters and do not take into
account the histopathological characteristics, neither
the tumor-host interrelationship5,17,26.
The histological features of the OSCC can be widely different from one area to another within the
same tumor. It is believed that the most useful site
for predicting prognosis is the forehead area of tumor
invasion front (TIF) as it would presumably reside
various molecular interactions that are crucial for
the progression of cancer: increased angiogenesis,
alteration of adhesion molecules, overproduction of enzymes that degrade the extracellular matrix and
an increase in the expression of proteins related to
cell proliferation1,4,5. The analysis of morphological
features such as: degree of keratinization, nuclear polymorphism, pattern of invasion and lymphocytic
as a supplement to the TNM4,5,17.
Rapidly growing tumors proved to be deeply invasive and with a poorer prognosis compared with
slow-growing tumors. Experimental evidence suggests
that the degree of cell proliferation in a tumor is an indicator for estimating biological aggressiveness12,29.
The increased proliferative capacity may be an early
indicator of malignant transformation, and, thus,
relevant to analyze the tumor prognosis7,11.
Proliferative markers such as argyrophilic nucleolar
organizer regions (AgNORs) and Ki-67 have been used
26,29. The
AgNOR technique consists of silver impregnation of
proteins associated with the active nucleoli organizer
regions (NORs). Ki-67 is a nuclear antibody that recognizes non-quiescent cells. AgNOR and Ki-67 can
provide valuable information about cell proliferation
velocity in tumors25, and the total fraction of
proliferating cells, respectively10,17,29.
This theme has been studied by other authors,
however so far results are contradictory17,21,22,28. To
our knowledge, there are no studies in the English literature evaluating concomitantly these proliferation
markers (Ki-67 and AgNOR) in TIF in order to predict
overall prognosis in OSCC as assessed in our study. So
the aim of this research is to evaluate cell proliferation, through the analysis of the number of AgNORs per
nucleus and the expression of Ki-67, in the tumor
invasion front in comparison with clinical parameters
an Uruguayan population.
Material and methods
This study was conducted through a retrospective
survey of the period between January 2000 and
December 2010, in the Laboratory of Pathology
Anatomy Cancer Institute (INCA) (Montevideo, Uruguay) and approved by the local Ethics Committee
with approval protocol number decree 379/08,
expedient 091900/000274-13. 109 cases of OSCC
were found, of whom 40 met all the inclusion criteria: intra-oral tumors (tumors from lip and oropharynx
were excluded), complete clinical data (gender,
age, location, TNM), pathology data (clinical stage,
degree of differentiation), a clearly demonstrated
because did not meet all the inclusion criteria or due to extensive areas of necrosis and poor preservation
of the histological structures.
All patients underwent surgical treatment followed
by radiotherapy and/or chemotherapy. Samples were obtained from the resection of the tumor, and the TIF
with a normal range of connective tissue. The gender,
age, location data TNM, clinical staging and evolution
(T2 N0M0); Stage III (T1,T2,N1 and M0 or T3,N0,N1
N0, N1,N2 and M0)13.
Serial sections from tissue samples, 3 μm in
samples. The first was stained with hematoxylin
according to Bryne, et al.5 (1992).For each tumor,
the degree of keratinization, nuclear polymorphism,
were graded and given scores between 1 and 4. The
scores were summed into a total score with variable
(good); 9-12 (moderate) and 13-16 (poor). The
second section was submitted to immunohistochemical
method for the detection of Ki-67 and the third was silver-stained for the detection of AgNORs.
Immunohistochemistry
The samples were dewaxed and processed for
minutes). Endogenous peroxidase was blocked by
incubation in 3% hydrogen peroxide in methanol. After
washing, the sections were incubated with primary
antibody Ki-67, concentration 1:25, (monoclonal anti-human, clone MIB-1, DakoCytomation; Glostrup,
Denmark). Envision (DakoCytomation; Carpinteria,
CA, EUA) and diaminobenzidine tetrahydrochloride
(DAB, DakoCytomation; Carpinteria, CA, EUA) were
counterstained with hematoxylin of Harris, dehydrated
and mounted. Positive control was obtained according
to the manufacturer.
Microscopic images were captured with an Olympus
binocular microscope equipped with an Olympus®
video camera [QColor 5, Coolet, RTV and a Dell
computer (Dimension 5150)]. Image J software (National Institutes of Health, Bethesda, MD, EUA)
was used to count Ki-67 positive cells. 1000 cells were
Cells with a brown nucleus were considered positive,
regardless of the intensity of the color.
AgNOR
The samples were subjected to the AgNOR technique following the protocol described by Ploton,
et al.24
the criteria established by Crocker et al.8 (1988). The
immersion oil. AgNOR dots per
on the images captured. Mean AgNORs per nucleus
(mAgNOR) in each sample, and the percentage
AgNORs p e r nucleus (pAgNOR>1, pAgNOR>2, pAgNOR>3, pAgNOR>4) were calculated according
to the methodology proposed by Xie, et al.30 (1997).
Statistical analysis
All quantification of Ki-67 and AgNORs was performed by a single blinded observer, and the
grading scores in TIF were performed by two
pathologists (Kappa=0.87).
Statistical analysis was performed using Software
GraphPad Prims 5 (GraphPad Software,Inc.; La
Variables n %
Age 17 42.5
<60 23 57.5
Sex Men 31 77.5
Woman 9 22.5
Location Tongue 20 50.0
Palate 6 15.0
Buccal mucosa 7 17.5
Floor of the mouth 2 5.0
Trigon retromolar 5 12.5
Evolution Live 17 42.5
Dead 23 57.5
T 1 0 0.0
2 17 42.5
3 15 37.5
4 8 20.0
N N0 24 60.0
N1 8 20.0
N2 6 15.0
N2b 1 2.5
N2c 1 2.5
M M0 40 100.0
Clinical Staging I 0 0.0
II 12 30.0
III 14 35.0
IV 14 35.0
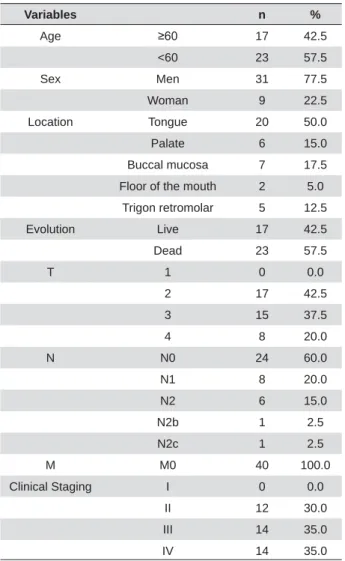
Table 1- Clinicopathological features of the tumor samples
Jolla, CA, USA). According to date distribution, the
comparison of Ki-67 immunostaining and AgNORs was
performed by ANOVA followed by post hoc Tukey test.
Results
The sample was composed of patients with mean
age of 63.3 years, ranging from 40 to 91 years. Most of them were men (77.50%), the tongue was the
preferred location (50%) and most of the tumors
were T2 (42.50%). No lymph node metastasis (N0)
was detected in 60% cases. Regarding the evolution
of patients, 57.50% of patients died by the tumor.
Clinicopathological features of the 40 tumors samples are summarized in Table 1.
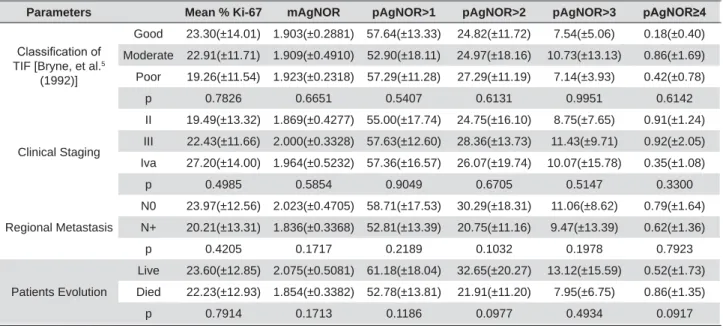
between immunostaining of Ki-67 and AgNOR with
different types of TIF (Figure 1, Table 2). An increase in Ki-67 mean associated with worse patient’s
clinical staging was noted, although not statistically
(died because of the tumor) showed lower mAgNOR
Parameters Mean % Ki-67 mAgNOR pAgNOR>1 pAgNOR>2 pAgNOR>3 S$J125
&ODVVL¿FDWLRQRI TIF [Bryne, et al.5
(1992)]
Good 23.30(±14.01) 1.903(±0.2881) 57.64(±13.33) 24.82(±11.72) 7.54(±5.06) 0.18(±0.40)
Moderate 22.91(±11.71) 1.909(±0.4910) 52.90(±18.11) 24.97(±18.16) 10.73(±13.13) 0.86(±1.69)
Poor 19.26(±11.54) 1.923(±0.2318) 57.29(±11.28) 27.29(±11.19) 7.14(±3.93) 0.42(±0.78)
p 0.7826 0.6651 0.5407 0.6131 0.9951 0.6142
Clinical Staging
II 19.49(±13.32) 1.869(±0.4277) 55.00(±17.74) 24.75(±16.10) 8.75(±7.65) 0.91(±1.24)
III 22.43(±11.66) 2.000(±0.3328) 57.63(±12.60) 28.36(±13.73) 11.43(±9.71) 0.92(±2.05)
Iva 27.20(±14.00) 1.964(±0.5232) 57.36(±16.57) 26.07(±19.74) 10.07(±15.78) 0.35(±1.08)
p 0.4985 0.5854 0.9049 0.6705 0.5147 0.3300
Regional Metastasis
N0 23.97(±12.56) 2.023(±0.4705) 58.71(±17.53) 30.29(±18.31) 11.06(±8.62) 0.79(±1.64)
N+ 20.21(±13.31) 1.836(±0.3368) 52.81(±13.39) 20.75(±11.16) 9.47(±13.39) 0.62(±1.36)
p 0.4205 0.1717 0.2189 0.1032 0.1978 0.7923
Patients Evolution
Live 23.60(±12.85) 2.075(±0.5081) 61.18(±18.04) 32.65(±20.27) 13.12(±15.59) 0.52(±1.73)
Died 22.23(±12.93) 1.854(±0.3382) 52.78(±13.81) 21.91(±11.20) 7.95(±6.75) 0.86(±1.35)
p 0.7914 0.1713 0.1186 0.0977 0.4934 0.0917
Table 2- Proliferative markers, percentage of Ki-67 positive cells and AgNOR, according to Bryne et al.5 (1992) histological malignancy grade of the TIF (tumor invasion front), clinical staging of the tumor, regional metastasis and patient evolution. Legend: mAgNOR=average AgNOR perQXFOHXVS$J125 SHUFHQWDJHRI$J125perQXFOHXV&OLQLFDO6WDJLQJ ,,71DQG0&OLQLFDO6WDJLQJ ,,,771 DQG0RU711DQG0&OLQLFDO6WDJLQJ ,YD7771DQG0RU7D111DQG01 QRUHJLRQDOPHWDVWDVLV N+=presence regional metastasis
Figure 1- Photomicrography of stained sections of TIF. Good differentiation (A, D), Moderate differentiation (B, E) and poor differentiation
In relation to regional metastasis, the mean of
Ki-67 and AgNOR in the N0 tumor group was higher
than in the N+ tumor group, although not statistically
Discussion
The TIF is characterized by cells with a lower degree
of differentiation and a higher degree of cell dissociation compared to other parts of the tumor. These cells are
more aggressive and tend to invade and metastasize.
Recent studies suggest that cells presented at the TIF
have different molecular characteristics than those in
prognostic area of the tumor1,4,5. The proliferative
activity analysis at the TIF has been studied as an
attempt to predict the biological behavior of tumor, as well as the possibility of local recurrence and
metastatic potential. However, the proliferative activity
at TIF association with clinical pathological parameters
remains controversial16,17,26.
The cell proliferation markers Ki-67 and AgNOR
in TIF of oral cancer were evaluated in a total of 9
studies so far10,17,19,21-23,26,28,29. The association with
prognosis was evaluated in 5 of these studies, however contradictory results have been observed21-23,26,29. In
our study it was not observed a clear relationship
between prognosis, regional metastasis and cell
proliferation at the TIF assessed by immunostaining of Ki -67 and AgNOR counting.
Regarding the clinical evolution, we observed a
lower AgNOR counts and Ki-67 positive cells in TIF of
patients with worse prognosis, although not statically
Piffko, et al.22 (1997) which observed that OSCC with
favorable prognosis contained lower mean AgNOR at the TIF than patients with poor prognosis. This may
be due to different methodology, different sample
sizes, or a combination of these factors, which could
explain the differences between our studies. Piffko, et al.22 (1997) performed a morphometric analysis of
AgNOR, whereas we performed a quantitative analysis.
observed for clinical staging of tumors and proliferative activity of the TIF. Our results demonstrated a
tendency of higher mean Ki-67 positive cells in patients
with worse clinical staging (stage IV), (not statistically
Tumulari, et al.26 (2004), which showed that advanced
stage clinical (stages III and IV) of the OSCC presented
a higher mean of Ki-67 staining when compared the early stage of the disease (stage I and II). However,
these results disagree with Piffkó, et al.23 (1996),
who studied Ki-67 at TIF and Watanabe, et al.29
(2010), which noted that the Ki-67 expression was not correlated with clinicopathological features such
as survival and clinical staging of OSCC.
Gonzalez-Moles, et al.15 (2010), reported that the
Ki-67 has no prognostic value in oral cancer, although
the authors did not evaluate this marker at the TIF.
This can be explained because Ki-67 is a marker of
the total fraction of proliferating cells, expressed in all cell cycle phases, excepted G0, being negative to cells
in quiescence. Other explanation is that only a small
group of cells within the tumor would be responsible
for the malignant growth, corresponding to cells in constant proliferation, and the expression of Ki-67
what could explain the lack of prognostic value of
Ki-67 expression6,14.
The results of the present study suggest that
the invasive front cells could expend more energy
to perform migration and invasion process than to
performing cell division. During the tumor invasion, cells undergo epithelial mesenchymal transition,
what gives them migratory and invasive properties.
The acquired mesenchymal phenotype implies the
reorganization of the cytoskeleton what may be incompatible with high cell proliferation27. Accordingly
with our results, Pereira, et al.21 (2016) observed low
Ki-67 expression in the TIF and suggests that this may
be due to the analysis of cell proliferation has only been performed in TIF, so we can infer that proliferative
by other factors the tumor microenvironment.
Different results between this study and the
literature could be explained by differences in criteria
analysis of immunostaining. Another explanation is
that oral cancer may behave differently around the
markers in an Uruguayan population.
Many aspects may be necessary to establish the
real prognosis of OSCC including: clinical staging, the
presence of distant metastasis, depth of tumor, location
the characteristics of the entire tumor. Furthermore,
the tumors consist of a heterogeneous cell population with biological behavior variable depending on a
complex interplay between host and tumor16,17.
In conclusion, our results demonstrated that the
proliferation at the TIF in OSCC measured by Ki-67 and AgNOR, is not useful to predict patient prognosis.
Further studies should be performed in order to clarify
whether the tumor invasive front analysis is directly related to prognosis.
article is reported.
References
1- Bànkfalvi A, Piffkò J. Prognostic and predictive factors in oral cancer: the role of the invasive tumour front. J Oral Pathol Med. 2000;29:291-8. 2- Barrios E, Vassallo J, Alonso R, Garau M, Musetti C. III Atlas de incidencia del cáncer en el Uruguay 2002-2006. Montevideo: Comisión Honoraria de Lucha Contra el Cáncer; 2010. 58 p.
new opportunity for cancer prevention? Oncologist. 2005;10:493-500. 4- Bryne M. Is the invasive front of an oral carcinoma the most important area for prognostication? Oral Dis. 1998;4:70-7.
5- Bryne M, Koppang HS, Lilleng R, Kjaerheim A. Malignancy grading of the deep invasive margins of oral squamous cell carcinomas has high prognostic value. J Pathol. 1992;166:375-81.
6- Cattoretti G, Becker MH, Key G, Duchrow M, Schlüter C, Galle J, et al. Monoclonal antibodies against recombinant parts of the Ki-67 antigen (MIB 1 and MIB 3) detect proliferating cells in microwave-processed
7- Coutinho-Camillo CM, Lourenço SV, Nishimoto IN, Kowalski LP, Soares FA. Expression of Bcl-2 family proteins and association with clinicopathological characteristics of oral squamous cell carcinoma. Histopathology. 2010;57:304-16.
8- Crocker J, Egan MJ. Correlation between NOR sizes and numbers in non-Hodgkin's lymphomas. J Pathol. 1988;156:233-9.
9- De Stefani E, Boffetta P, Deneo-Pellegrini H, Ronco AL, Acosta G, Ferro G, et al. The effect of smoking and drinking in oral and pharyngeal cancers: a case-control study in Uruguay. Cancer Lett. 2007;246:282-9. 10- Dissanayake U, Johnson NW, Warnakulasuriya KA. Comparison of cell proliferation in the centre and advancing fronts of oral squamous cell carcinomas using Ki-67 index. Cell Prolif. 2003;36:255-64.
Popescu MR. P53, p16 and Ki67 immunoexpression in oral squamous carcinomas. Rom J Morphol Embryol. 2012;53:89-93.
et al. Cytogenetic characterization of head and neck squamous cell carcinoma cell lines as model systems for the functional analyses of tumor-associated genes. J Oral Pathol Med. 2010;39:382-9. 13- Gale N, Pilch B, Sidransky D, El Naggar A, Westra W, Califano J, et al. Epithelial precursor lesions. In: Barnes l, Eveson JW, Reichart P, Sidransky D (editors). Pathology and genetics of head and neck tumors. Lyon: IARC Press; 2005. p. 177-9.
14- Gerdes J, Schwab U, Lemke H, Stein H. Production of a monoclonal antibody reactive with a human nuclear antigen associated with cell proliferation. Int J Cancer. 1983;31:13-20.
15- Gonzalez-Moles MA, Ruiz-Avila I, Gil-Montoya JA, Esteban F, Bravo M. Analysis of Ki-67 expression in oral squamous cell carcinoma: why Ki-67 is not a prognostic indicator. Oral Oncol. 2010;46:525-30. 16- Kurokawa H, Yamashita Y, Takeda S, Miura K, Murata T, Kajiyama M. The expression of proliferating cell nuclear antigen (PCNA) and p 53 protein correlate with prognosis of patients with oral squamous cell carcinoma. Fukuoka Igaku Zasshi. 1999;90:6-13.
17- Kurokawa H, Zhang M, Matsumoto S, Yamashita Y, Tomoyose T, Tanaka T, et al. The high prognostic value of the histologic grade at the deep invasive front of tongue squamous cell carcinoma. J Oral Pathol Med. 2005;34:329-33.
18- Liu L, Kumar SK, Sedghizadeh PP, Jayakar AN, Shuler CF. Oral squamous cell carcinoma incidence by subsite among diverse racial and ethnic populations in California. Oral Surg Oral Med Oral Pathol Oral Radiol Endod. 2008;105:470-80.
19- Mohtasham N, Babakoohi S, Shiva A, Shadman A, Kamyab-Hesari K, Shakeri MT, et al. Immunohistochemical study of p53, Ki-67, MMP-2 and MMP-9 expression atinvasive front of squamous cell and verrucous carcinoma in oral cavity. Pathol Res Pract. 2013;209:110-4. 20- Oliveira ML, Wagner VP, Sant’ana Filho M, Carrard CV, Hugo FN, Martins MD. A 10-year analysis of the oral squamous cell carcinoma
2015;29. doi:10.1590/1807-3107BOR-2015.vol29.0075.
21- Pereira CH, Morais MO, Martins AF, Soares MQ, Alencar RC, Batista
and cell proliferation (Ki-67) at the invasive tumor front in conventional oral squamous cell and basaloid squamous cell carcinomas. Arch Oral Biol. 2016;61:8-15.
22- Piffkò J, Bànkfalvi A, Ofner D, Bryne M, Rasch D, Joos U, et al. Prognostic value of histobiological factors (malignancy grading and AgNOR content) assessed at the invasive tumour front of oral squamous cell carcinomas. Br J Cancer. 1997;75:1543-6.
23- Piffkó J, Bánkfalvi A, Ofner D, Kusch F, Böcker W, Joos U, et al. In situ assessment of cell proliferation at the invasive front of oral squamous cell carcinomas. Virchows Arch. 1996;429:229-34. 24- Ploton D, Menager M, Jeannesson P, Himber G, Pigeon F, Adnet JJ. Improvement in the staining and in the visualization of the argyrophilic proteins of the nucleolar organizer region at the optical level. Histochem J. 1986;18:5-14.
25- Teixeira G, Antonangelo L, Kowalski L, Saldiva P, Ferraz A, Silva Filho G. Argyrophilic nucleolar organizer regions staining is useful in
squamous cell carcinoma. Am J Surg. 1996;172:684-8.
26- Tumuluri V, Thomas GA, Fraser IS. The relationship of proliferating cell density at the invasive tumour front with prognostic and risk factors in human oral squamous cell carcinoma. J Oral Pathol Med. 2004;33:204-8.
27- Vega S, Morales AV, Ocaña OH, Valdes F, Fabregat I, Nieto MA. Snail blocks the cell cycle and confers resistance to cell death. Genes Dev. 2004;18:1131-43.
28- Verma R, Singh A, Jaiswal R, Chandra A, Verma R, Tak J. Association of Ki-67 antigen and p53 protein at invasive tumor front of oral squamous cell carcinoma. Indian J Pathol Microbiol. 2014;57(4):553-7. 29- Watanabe S, Watanabe R, Oton-Leite AF, Alencar RC, Oliveira JC, Leles CR, et al. Analysis of cell proliferation and pattern of invasion in oral squamous cell carcinoma. J Oral Sci. 2010;52:417-24.