Authors
Maria Eugênia Lopes Navarro 1
Klinsmann Carolo dos Santos 1
André Ferreira do Nascimento 2 Fabiane Valentini Francisqueti 1 Igor Otávio Minatel 1 Damiana Tortolero Pierine 1
Renata Azevedo de Melo Luvizotto 2
Ana Lúcia A. Ferreira 1 Dijon Henrique Salomé de Campos 1
Camila Renata Corrêa 1
1 Universidade Estadual Paulista. 2 Universidade Federal de Mato Grosso.
Submitted on: 12/01/2014. Approved on: 10/27/2015.
Correspondence to: Camila Renata Corrêa. Universidade Estadual Paulista. Av. Prof. Montenegro, s/nº, Botu-catu, SP, Brazil. CEP: 18618-970. E-mail: [email protected]
I
NTRODUCTIONObesity is a condition associated with inflammation and oxidative stress, which occurs when a high intake of fat and sugars are oxidized, producing toxic substances such as advanced glycation end products (AGEs).1-3 When
Renal inflammatory and oxidative and metabolic changes
after 6 weeks of cafeteria diet in rats
Inflamação renal, alterações metabólicas e oxidativas após 6
semanas de dieta de cafeteria em ratos
Introdução: A obesidade é uma doença em que a inflamação está inteiramente envolvida e pode causar insuficiência renal. Objetivo: Avaliar a influência da exposição a curto prazo de uma dieta de cafeteria sobre a in-flamação no tecido renal e a formação de produtos de glicação avançada (AGEs) no plasma de rato. Métodos: Ratos Wistar ma-chos (10 semanas de idade, pesando 350 g) foram designados para receber dieta de ra-ção comercial (C; n = 8 animais/grupo, 5% de energia a partir de gordura) ou dieta de cafeteria (CAF-D, n = 8 animais/grupo: 29% de energia de gordura) e de sacarose em água (300 g/L) de beber durante 6 semanas. Resul-tados: Índice de adiposidade em seis semanas foi maior no grupo CAF-D em comparação com C. O mesmo comportamento foi obser-vado para os níveis plasmáticos de glicose, triglicerídeos, leptina, insulina e AGEs. A ex-pressão do gene de IL-6 e TNF-α em tecido renal foi maior no grupo D-CAF e nenhuma diferença significativa no tecido adiposo. Não houve aumento destas citocinas no plasma ou rim. Houve uma diminuição sig-nificativa de adiponectina no grupo CAF-D. Conclusão: A exposição a curto prazo da CAF-D reflete alterações no metabolismo, aumento dos níveis plasmáticos de AGEs, o que pode refletir o aumento expressão de citocinas inflamatórias no rim.
R
ESUMOPalavras-chave: estresse oxidativo; infla-mação; obesidade.
Introduction: Obesity is a disease in
which inflammation is directly involved and can lead to impaired renal function.
Objective: To evaluate the influence of
short term exposure to cafeteria diet on kidney tissue inflammation and advanced glycation end products (AGEs) in the rat plasma. Methods: Male Wistar rats
(10 weeks of age, weighing 350 g) were assigned to receive commercial chow diet (C; n = 8 animals/group, 5% of energy from fat) or cafeteria diet (CAF-D, n = 8 animals/group: 29% energy fat) and sucrose in drinking water (300 g/L) for 6 weeks. Results: adiposity index at
six weeks was higher in CAF-D group compared to C. The same behavior was observed for plasma levels of glucose, triglycerides, leptin, insulin and AGEs. The gene expression of IL-6 and TNF-α
in renal tissue was higher in CAF-D group and no significant difference in adipose tissue. There was no increase of these cytokines in plasma and kidney or histologically. There was a significant decrease of adiponectin in the CAF-D group. Conclusion: The short exposure
CAF-D reflects changes in metabolism, increased plasma levels of AGEs, which may reflect the increased expression of inflammatory cytokines in the kidney.
A
BSTRACTKeywords: inflammation; obesity;
oxida-tive stress.
DOI: 10.5935/0101-2800.20160003
consumption becomes chronic, there is an imbalance in the redox system, leading to the generation of these species, which are associated with metabolic disorders and inflammatory damage in several organs.4,5
products), starting a cascade of events involving signal transduction kinases. This association culminates in the activation of factors Ikkβ/NFkB- nuclear transcriptional elements involved in the production of pro- inflammatory cytokines.6 As these receptors
are present in various organs, including the kidneys, this can be a way of obese individuals develop kidney failure.7
Studies in diabetics and obese animals show that AGEs is a compound which can cause kidney disease.7-9 However, the literature does not show if
a short period of intake of sugar and fat would be able to enhance the formation of AGEs, which leads to metabolic changes and inflammation in the kidney tissue. So, the aim of this study was to evaluate the influence of the short period of exposure cafeteria diet in inflammation of the kidney tissue as well as AGEs in plasma of rats.
M
ATERIALS ANDM
ETHODSANIMALS AND EXPERIMENTAL PROTOCOL
Male Wistar rats (10 weeks old, weighing nearly 350 g), from the Animal Center of Botucatu Medical School, Sao Paulo State University, UNESP (Botucatu, SP, Brazil), were initially divided to receive either a standard control diet (5% energy from fat and water (C, n = 8 animals/group) or cafeteria diet (29% energy from fat) and sugar in the drinking water (300 g/l) (CAF-D, n = 8 animals/group) during 6 weeks. The cafeteria diet was designed in our laboratory to contain a powdered commercial chow diet - NUVILAB CR-1 (Nuvital Q5), plus processed foods how wafer biscuit, condensed milk and palm oil, vitamins and minerals. The nutritional composition of the diets is presented in Table 1.
Rats were housed in individual cages in an animal facility at the Internal Medicine Experimental Laboratory, Botucatu Medical School, UNESP, under a controlled ambient temperature (22-26 °C) and lighting (12 h light-12 h dark cycle) condition. The animals were killed by decapitation after fasting 12 hours and anesthesia with sodium pentobarbital Q4 (50mg/kg, intraperitoneal injection). The experiment was conducted in accordance with the Guidelines for the Care and Use of Experimental. Animals and the diets followed the specifications from Nutrient Requirements of the Laboratory Rats. The protocol was approved by the local Ethical Committee for Animal Research (protocol nº PE-47/2011).
TABLE 1 NUTRITIONALCOMPOSITIONSOFTHECONTROL
ANDCAFETERIADIET
Diet Cafeteria
Components Control Diet
Protein (%) 25.0 21.0
Carbohydrate (%) 58.0 45.0
Fat (%) 5.0 29.0
% Energy from protein 26.5 16.0
% Energy from carbohydrate 61.5 34.3*
% Energy from fat 12.0 49.7
% Energy from saturated fat 2.1 24.7
% Energy from unsaturated fat 9.9 25.0
Energy (kcal/g) 3.8 5.3
Energy (KJ/g) 15.8 22.0
Others 6.8 5.4
Vitamin/mineral mixture† - Add
* Energy from sugar in the drinking water (300 g/l) was not included.
†Based on the vitamin/mineral amounts of the chow diet, for each kg
of the HFD, the following nutrients were added: Fe, 25.2 mg; K, 104.8 mg; Se, 73.1 μg; molybdenum sulphate, 150.0 μg; vitamin B12, 34.5 μg; vitamin B6, 6 mg; biotin, 0.12 mg; vitamin E, 48.9 UI; vitamin D, 2447.0 UI; Vitamin A, 15921.2 UI.
ADIPOSITYINDEX
The adiposity index (AI) was used as an indicator of obesity because it enables the precise evaluation of body fat percentages. Epididymal, retroperitoneal, and visceral fat deposits were dissected from the rats. The sum of the fat deposits, normalized by body weight [(epididymal + retroperitoneal + visceral)/body weight] x 100, was calculated to obtain the adiposity index.10
PLASMA MEASUREMENTS
An enzymatic colorimetric kit was used to measure glucose (Bioclin®, Belo Horizonte, Minas Gerais,
Brazil), triglycerides and cholesterol (Bioclin®, Belo
Horizonte, Minas Gerais, Brazil). Spectrophotometry was performed with the Chemistry Analyser BS 200 automatic spectrophotometer (Mindray Medical International Limited, China).
Insulin, leptin, adiponectin and AGEs were purchased from Millipore Corporation, USA. TNF-α
and IL-6 from R&D System, USA. Plasmatic levels were measured using ELISA methods according to manufacturer’s instructions using a microplate spectrophotometer reader (SpectraMax 190, Molecular Devices, Sunnyvale, CA, USA).
INSULINRESISTANCE
following formula:11 HOMA-IR = fasting insulin (µU/
ml) x fasting glucose (mmol/l)/22.5.
PLASMA INSULINAND AGESMEASUREMENTS
Insulin (Millipore Corporation, Billerica, MA, USA), AGEs (Cell Biolabs, INC, San Diego, CA) plasma concentrations were measured by the ELISA method. A microplate spectrophotometer reader (SpectraMax 190, Molecular Devices, Sunnyvale, CA, USA) was used, according to manufacturer’s instructions.
QUANTIFICATION OF KIDNEY GENE EXPRESSION USING REAL-TIME PCR FOR INTERLEUKIN-6 (IL-6) AND TUMORAL NECROSIS FACTOR- ALFA (TNF-α)
Total RNA was extracted from epididymal adipose and renal tissues using the reagent TRIzol (Invitrogen). The SuperScript II First-Strand Synthesis System for RT-PCR (Invitrogen) kit was utilised for the synthesis of 20ml of complementary DNA from 1000 ng of total RNA. The mRNA levels of TNF-a (assay Rn 00562055_m1; Applied Biosystems) and IL-6 (assay Rn 01410330_m1; Applied Biosystems) were determined by real-time PCR. Quantitative measurements were made with a commercial kit (TaqMan qPCR; Applied Biosystems) in a detection system (StepOne Plus; Applied Biosystems). Cycling conditions were as follows: enzyme activation at 50°C for 2min, denaturation at 958C for 10 min, complementary DNA products were amplified for forty cycles of denaturation at 95 °C for 15s and annealing/extension at 60 °C for 1 min. Gene expression was quantified in relation to the values of the C group after normalisation by an internal control (cyclophilin: assay Rn 00690933_m1; Applied Biosystems) by the method 22DDCT, as described previously.12
HISTOLOGICALANALYSIS
Renal tissue was fixed with 4% formaldehyde and embedded in paraffin. Two consecutive sections from each sample were cut (4 µm) and stained with hematoxylin-eosin. The whole-slides were scanned by 3DHISTECH Pannoramic MIDI System attached to HITACHI HV-F22 color camera and analyzed under 40X magnification in a blinded manner.
STATISTICALANALYSES
The Kolmogorov-Smirnov test was used to verify the normality of the data. Results are expressed as
mean ± standard deviation (SD), and significance was calculated by t-test for independent variables. The software used was SigmaStat version 3.5 for Windows (Systat Software, Inc.). Differences were considered significant at p < 0.05.
R
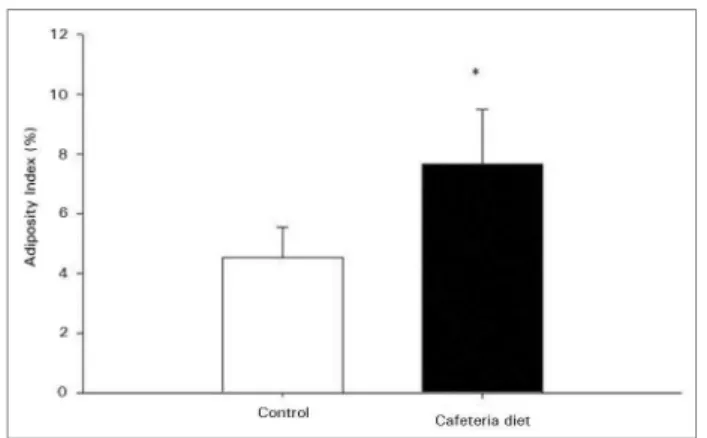
ESULTSAdiposity index of CAF-D animals in the sixth week was significantly higher compared to C animals (Figure 1). About the metabolic parameters, we observed that glucose, triglycerides, leptin and insulin were higher in CAF-D group compared to C group. We also observed that within six weeks the CAF-D animals developed insulin resistance (increased HOMA-IR) and significant decrease in plasma adiponectin.
Figure 1. Adiposity Index in Control and Cafeteria diet animals over 6
weeks. Data are expressed as mean ± SE. Diferent letters indicate statistical diference between groups (t-test for independent variables p < 0.05)
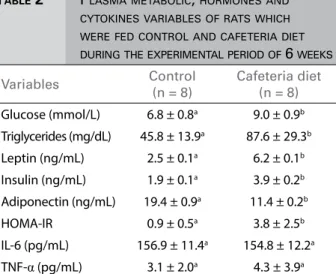
There was no difference in the levels of TNF-α
and IL-6 between the groups (Table 2). The plasma concentration of AGE is presented in Figure 2. We observed increase in CAF-D animals compared to C animals. Besides, animals fed cafeteria diet showed a significant increase in gene expression of IL-6 and TNF-α in renal tissue (Table 3). This behavior was not observed in gene expression in adipose tissue (Table 3).
include increased levels of circulating cytokines, as well as glycemia, triglycerides, leptin and decreased of adiponectin.14 Our study observed the
manifestation of obesity in 6 weeks, with animals showing higher adiposity index, increased fasting glucose, triglycerides, leptin, insulin resistance, and reduced adiponectin reflecting the context of obesity and metabolic disorders. These changes in body composition and metabolism are already established in the literature, but with longer periods of exposure to high fat diet as the work of Vincent et al.,15 which
conducted a study observing metabolic changes weekly for 20 weeks in animals fed high-fat diet (45%) and only at 12th week changes in lipid profile,
plasma glucose and hormonal were founded. The difference in the metabolic events may be explained by the composition of the diet. High-fat diet consist in a diet in which most of the calories derived from fat, while cafeteria diet is made up of a combination of palatable foods, high energy density, which currently reflects the Western dietary pattern. In a study of Sampey et al.,16 which compared the effect of cafeteria
diet and high-fat diet in inducing metabolic syndrome in rats, showed that cafeteria diet induced an increase in body weight and epididymal fat compared to high fat diet group and was also able to induce insulin resistance as early as seven weeks of consumption, what did no happen with the high fat diet. These data corroborate the cafeteria diet as a trigger of metabolic changes.
The literature has focused that the increased body mass index (BMI) increases the risk of progression kidney disease.17-19 Obese people with
chronic kidney disease have higher rate of decline in glomerular filtration rate and progress faster to the renal disease.20 However, the mechanisms by which
obesity predisposes people to kidney damages are unknown.8 It is known that obesity causes increase in
inflammation in the kidney tissue and renal injury21
and one of the causes of this inflammation is oxidative stress.22 AGEs are generated in vivo as a normal
consequence of metabolism, but their formation is accelerated under conditions of hyperglycemia, hyperlipidemia and increased oxidative stress.7,23
These AGEs are highly reactive and can trigger inflammation by generating particularly TNF-α and IL-6,8 which could damages the kidney via the tubular
cell apoptosis, and can also promote the proliferation of mesangial cells generating mesangial proliferative glomerulonephritis, and nephritis.24
TABLE 2 PLASMAMETABOLIC, HORMONESAND
CYTOKINESVARIABLESOFRATSWHICH WEREFEDCONTROLANDCAFETERIADIET DURINGTHEEXPERIMENTALPERIODOF 6 WEEKS
Variables Control
(n = 8)
Cafeteria diet (n = 8)
Glucose (mmol/L) 6.8 ± 0.8a 9.0 ± 0.9b Triglycerides (mg/dL) 45.8 ± 13.9a 87.6 ± 29.3b
Leptin (ng/mL) 2.5 ± 0.1a 6.2 ± 0.1b
Insulin (ng/mL) 1.9 ± 0.1a 3.9 ± 0.2b
Adiponectin (ng/mL) 19.4 ± 0.9a 11.4 ± 0.2b HOMA-IR 0.9 ± 0.5a 3.8 ± 2.5b
IL-6 (pg/mL) 156.9 ± 11.4a 154.8 ± 12.2a TNF-α (pg/mL) 3.1 ± 2.0a 4.3 ± 3.9a
Data presented as mean ± standard deviation. Diferent letters indicate statistical diference between groups (t-test for independent variables p < 0.05). HOMA-IR = index of homeostasis model assessment, IL-6 = interleukin -6, TNF-α = tumoral necrosis factor-alfa.
Figure 2. Plasma advanced glycation end products (AGEs) in Control
and Cafeteria diet animals over 6 weeks. Data are expressed as mean ± SE. Diferent letters indicate statistical diference between groups (t-test for independent variables p < 0.05)
TABLE 3 CYTOKINESMRNALEVELSINKIDNEYAND
ADIPOSEOFRATSWHICHWEREFED CONTROLANDCAFETERIADIETDURINGTHE EXPERIMENTALPERIODOF 6 WEEKS
Variables Control (n = 8) Cafeteria diet (n = 8) Kidney tissue
IL-6 1.0 ± 0.1a 1.6 ± 0.5b TNF-α 1.0 ± 0.1a 1.5 ± 0.6b Adipose tissue
IL-6 1.0 ± 1.5a 0.4 ± 0.2a TNF-α 1.0 ± 0.3a 1.3 ± 1.2a
Data presented as mean ± standard deviation. Diferent letters indicate statistical diference between groups. (t-test for independent variables p < 0.05). IL-6 = interleukin -6, TNF-α = tumoral necrosis factor-alfa.
D
ISCUSSIONIn the present study did not observe morphological changes of the kidney between the groups, but was observed increased gene expression of these cytokines in the renal tissue of CAF-D animals. This may have been triggered by the high presence of AGEs in plasma, which present in the bloodstream come into contact with the kidney binds to RAGE receptors, triggering inflammation in the organ. Although some studies in the literature indicate inflammation in adipose tissue as the beginning of the inflammatory process in obesity, and subsequently by the circulation affects the other organs, we do not observe it in this work, since we did not found increased IL-6 and TNF-α in adipose tissue or in plasma of the animals fed CAF-D. This leads us to emphasize that in an early period of obesity, inflammation manifests independently and by different mechanisms in different organs. Thus, we note that the oxidative stress caused by metabolic changes in obesity and hyperglycemia leads to inflammation. Obese animals showed an accumulation of AGEs in the plasma and it is clear that if this obesity persisted beyond the proposed period (6 weeks), kidney inflammation that can become a factor for progression of renal complications. TNF-α is a key mediator of inflammation and a major participant in the pathogenesis of kidney injury by promoting inflammation apoptosis and the accumulation of extracellular matrix by reducing rate flow glomerular (GFR) and increasing albumin permeability.25
Together, the AGEs in plasma could be an biomarker for kidney disease, since studies have reported that when there is a reduction in the rate of glucose, or even decreased intake of sugars and processed food which contains large amount of AGEs,26 improves the renal function.27
C
ONCLUSIONThese data allow us to conclude that a short exposure period and the cafeteria diet reflects on metabolic changes, elevated plasma levels of toxic products how AGEs, which can increased expression of inflammatory cytokines.
A
CKNOWLEDGMENTSWe thank Mario B. Bruno, José Carlos Georgette, and Renata Capela for their technical support and FAPESP (2011/14132-0; 2011/2011/20950-8) for providing financial support.
I
NTEREST CONFLICTThe authors declare no conflict interest
R
EFERENCES1. Tuohy KM, Hinton DJ, Davies SJ, Crabbe MJ, Gibson GR, Ames JM. Metabolism of Maillard reaction products by the human gut microbiota-implications for health. Mol Nutr Food Res 2006;50:847-57. DOI: http://dx.doi.org/10.1002/ mnfr.200500126
2. Uribarri J, Peppa M, Cai W, Goldberg T, Lu M, Baliga S, et al. Dietary glycotoxins correlate with circulating advanced gly-cation end product levels in renal failure patients. Am J Kid-ney Dis 2003;42:532-8. PMID: 12955681 DOI: http://dx.doi. org/10.1016/S0272-6386(03)00779-0
3. Vlassara H, Cai W, Crandall J, Goldberg T, Oberstein R, Dar-daine V, et al. Inflammatory mediators are induced by dietary glycotoxins, a major risk factor for diabetic angiopathy. Proc Natl Acad Sci U S A 2002;99:15596-601. DOI: http://dx.doi. org/10.1073/pnas.242407999
4. Pitocco D, Tesauro M, Alessandro R, Ghirlanda G, Cardillo C. Oxidative stress in diabetes: implications for vascular and other complications. Int J Mol Sci 2013;14:21525-50. DOI: http:// dx.doi.org/10.3390/ijms141121525
5. Iantorno M, Campia U, Di Daniele N, Nistico S, Forleo GB, Cardillo C, et al. Obesity, inflammation and endothelial dys-function. J Biol Regul Homeost Agents 2014;28:169-76. 6. Bierhaus A, Schiekofer S, Schwaninger M, Andrassy M,
Hum-pert PM, Chen J, et al. Diabetes-associated sustained activa-tion of the transcripactiva-tion factor nuclear factor-kappaB. Diabetes 2001;50:2792-808. DOI: http://dx.doi.org/10.2337/diabe-tes.50.12.2792
7. Thallas-Bonke V, Coughlan MT, Tan AL, Harcourt BE, Mor-gan PE, Davies MJ, et al. Targeting the AGE-RAGE axis im-proves renal function in the context of a healthy diet low in advanced glycation end-product content. Nephrology (Carl-ton) 2013;18:47-56. DOI: http://dx.doi.org/10.1111/j.1440-1797.2012.01665.x
8. Tomino Y, Hagiwara S, Gohda T. AGE-RAGE interaction and oxidative stress in obesity-related renal dysfunction. Kid-ney Int 2011;80:133-5. PMID: 21720304 DOI: http://dx.doi. org/10.1038/ki.2011.86
9. Harcourt BE, Sourris KC, Coughlan MT, Walker KZ, Dou-gherty SL, Andrikopoulos S, et al. Targeted reduction of ad-vanced glycation improves renal function in obesity. Kidney Int 2011;80:190-8. PMID: 21412218 DOI: http://dx.doi. org/10.1038/ki.2011.57
10. Luvizotto Rde A, Nascimento AF, Imaizumi E, Pierine DT, Conde SJ, Correa CR, et al. Lycopene supplementation mo-dulates plasma concentrations and epididymal adipose tissue mRNA of leptin, resistin and IL-6 in diet-induced obese rats. Br J Nutr 2013;110:1803-9. PMID: 23632237 DOI: http://dx.doi. org/10.1017/S0007114513001256
11. Matthews DR, Hosker JP, Rudenski AS, Naylor BA, Treacher DF, Turner RC. Homeostasis model assessment: insulin resis-tance and beta-cell function from fasting plasma glucose and insulin concentrations in man. Diabetologia 1985;28:412-9. DOI: http://dx.doi.org/10.1007/BF00280883
12. Livak KJ, Schmittgen TD. Analysis of relative gene expression data using real-time quantitative PCR and the 2(-Delta Delta C(T)) Method. Methods 2001;25:402-8. DOI: http://dx.doi. org/10.1006/meth.2001.1262
13. Gregor MF, Hotamisligil GS. Inflammatory mechanisms in obe-sity. Annu Rev Immunol 2011;29:415-45. DOI: http://dx.doi. org/10.1146/annurev-immunol-031210-101322
15. Vincent M, Philippe E, Everard A, Kassis N, Rouch C, Denom J, et al. Dietary supplementation with Agaricus blazei murill extract prevents diet-induced obesity and insulin resistance in rats. Obesity (Silver Spring) 2013;21:553-61. DOI: http:// dx.doi.org/10.1002/oby.20276
16. Sampey BP, Vanhoose AM, Winfield HM, Freemerman AJ, Muehlbauer MJ, Fueger PT, et al. Cafeteria diet is a robust model of human metabolic syndrome with liver and adipose in-flammation: comparison to high-fat diet. Obesity (Silver Spring) 2011;19:1109-17. DOI: http://dx.doi.org/10.1038/oby.2011.18 17. Hsu CY, McCulloch CE, Iribarren C, Darbinian J, Go AS.
Body mass index and risk for end-stage renal disease. Ann In-tern Med 2006;144:21-8. PMID: 16389251 DOI: http://dx.doi. org/10.7326/0003-4819-144-1-200601030-00006
18. Kopple JD, Feroze U. The effect of obesity on chronic kid-ney disease. J Ren Nutr 2011;21:66-71. DOI: http://dx.doi. org/10.1053/j.jrn.2010.10.009
19. Abrass CK. Overview: obesity: what does it have to do with kidney disease? J Am Soc Nephrol 2004;15:2768-72.
20. Iseki K, Ikemiya Y, Kinjo K, Inoue T, Iseki C, Takishita S. Body mass index and the risk of development of end-stage renal di-sease in a screened cohort. Kidney Int 2004;65:1870-6. DOI: http://dx.doi.org/10.1111/j.1523-1755.2004.00582.x
21. Kim JE, Lee MH, Nam DH, Song HK, Kang YS, Lee JE, et al. Celastrol, an NF-κB inhibitor, improves insulin resistance and attenuates renal injury in db/db mice. PLoS One 2013;8:e62068. DOI: http://dx.doi.org/10.1371/journal.pone.0062068
22. Maric-Bilkan C. Obesity and diabetic kidney disease. Med Clin North Am 2013;97:59-74. PMID: 23290730 DOI: http://dx.doi.org/10.1016/j.mcna.2012.10.010
23. Kellow NJ, Savige GS. Dietary advanced glycation end--product restriction for the attenuation of insulin resistan-ce, oxidative stress and endothelial dysfunction: a systema-tic review. Eur J Clin Nutr 2013;67:239-48. DOI: http:// dx.doi.org/10.1038/ejcn.2012.220
24. Takase O, Marumo T, Imai N, Hirahashi J, Takayanagi A, Hishikawa K, et al. NF-kappaB-dependent increase in intrarenal angiotensin II induced by proteinuria. Kidney Int 2005;68:464-73. PMID: 16014023
25. Lee SY, Choi ME. Urinary biomarkers for early diabe-tic nephropathy: beyond albuminuria. Pediatr Nephrol 2015;30:1063-75. DOI: http://dx.doi.org/10.1007/s00467-014-2888-2
26. Vlassara H, Cai W, Goodman S, Pyzik R, Yong A, Chen X, et al. Protection against loss of innate defenses in adulthood by low advanced glycation end products (AGE) intake: role of the antiinflammatory AGE receptor-1. J Clin Endocrinol Metab 2009;94:4483-91. PMID: 19820033 DOI: http:// dx.doi.org/10.1210/jc.2009-0089