Authors
Manuel Carlos Martins Castro 1
1 Universidade de São Paulo.
Submitted on: 01/26/2015. Approved on: 09/29/2015.
Correspondence to:
Manuel Carlos Martins Castro. Hospital das Clínicas da Faculdade de Medicina da Universidade de São Paulo.
Av. Dr. Enéas de Carvalho Aguiar, nº 255, São Paulo, SP, Brazil. CEP: 05403-000.
E-mail: [email protected]
Variability in quality of care among dialysis units in the state
of São Paulo and the ordinance number 389/2014 of the
Health Ministry of Brazil
A variabilidade na qualidade do atendimento entre unidades de
diálise do estado de São Paulo e a Portaria n
º
389/2014 do Ministério
da Saúde do Brasil
Introdução: Alguns índices são utilizados para avaliar a qualidade da terapia dialítica oferecida aos pacientes com doença renal crônica (DRC). Em 2014, o Ministério da Saúde do Brasil publicou a Portaria nº 389/2014, que estabelece metas no cuidado desses pacientes. Objetivo: Avaliar o desempenho de diferentes clínicas de hemodiálise (HD) em relação às metas estabelecidas nessa Portaria. Métodos: Estudo transversal, prospectivo, observacional, envolvendo 1.633 pacientes em HD em oito clínicas. As características demográficas, Kt/V, hemoglobina, fósforo, paratormônio (PTH) e a taxa de mortalidade foram registradas. Os resultados foram comparados com as metas estabelecidas na Portaria: Kt/V > 1,2 em mais de 70% dos pacientes, hemoglobina entre 10 e 12g/dl em mais de 80%, fósforo entre 3,5 e 5,5mg/dl em mais de 50% e o PTH < 600pg/ml em mais de 80% dos pacientes. Resultados: A idade foi de 56,4 ± 15,2 anos, a mediana do tempo em diálise foi de 28,4 meses. A duração da HD foi de 3,74 ± 0,31 horas. Para o Kt/V, seis clínicas atingiram a meta. Para a hemoglobina, nenhuma clínica atingiu a meta. Para o fósforo, duas clínicas atingiram a meta e para o PTH quatro clínicas. Seis clínicas atingiram duas metas e duas clínicas não atingiram nenhuma meta. A mortalidade foi menor nas clínicas que atingiram metas (10,2 vs. 21,6% ao ano; p = 0,0546). Conclusão: Para o Kt/V a maioria das clínicas atingiu a meta estabelecida. Para a hemoglobina e fósforo, as metas não foram atingidas na maioria das clínicas. Para o PTH, a resposta foi variável e dependente de características da clínica.
R
ESUMOPalavras-chave: diálise renal; falência renal crônica; guias como assunto; mortalidade.
Introduction: Medical organizations have proposed indices to assess the quality of dialytic therapy offered to patients with chronic kidney disease (CKD). Recently, the Ministry of Health of Brazil published the ordinance nº 389/2014, which establishes targets in the care of patients with CKD. Objective: We evaluate the performance of hemodialysis (HD) clinics in relation to the goals established in this ordinance. Methods: Cross-sectional study, prospective, observational, involving 1,633 patients with CKD on HD in eight clinics. Demographic characteristics, Kt/V, hemoglobin, phosphorus, parathormone (PTH) and the mortality rate were recorded. The results were compared to the goals established in the ordinance No. 389/2014: Kt/V > 1.2 in more than 70% of patients, hemoglobin between 10 and 12 g/dl in more than 80%, phosphorus between 3.5 and 5.5 mg/dl in more than 50%, and PTH < 600pg/ml in more than 80% of patients. Results: The age was 56.4 ± 15.2 years, the median time on dialysis was 28.4 months. The HD session time was 3.74 ± 0.31 hours. For Kt/V, six clinics reached the goal. For hemoglobin, none of the clinics reached the goal. For phosphorus, only two clinics meet the goal and for PTH four clinics. Six clinics hit two goals and two clinics did not achieve any goal. Mortality was lower in clinics that reached targets (10.2 vs. 21.6% per year; p = 0.0546). Conclusion: For Kt/V most clinics reached the goal established by the ordinance. For hemoglobin and phosphorus, the objectives were not achieved in many clinics. For PTH, the response was variable and dependent on clinical features.
A
BSTRACTKeywords: guidelines as topic; kidney failure, chronic; mortality; renal dialysis.
I
NTRODUCTIONSeveral guidelines have proposed indices to be achieved in patients on hemodialysis to improve treatment quality and, consequently, reduce mortality, which remains unacceptably high despite technological advances introduced in the last decades.1-5
These guidelines have based their recommendations on values to be achieved in individual patients, not setting goals when the population of patients is assessed together.
Recently, some authors have described the behavior of certain indices when establishing goals in specific patient cohorts.6,7 Similarly, the impact of this
type of quality control on morbidity and mortality rates of dialysis treatment has been evaluated.8-10
On July 25, 2014, the Ministry of Health published Ordinance nº 389/2014, which sets indices to be achieved by dialysis clinics on the treatment of patients with stage 5D of chronic kidney disease (5D CKD).11 So it seems important to assess the behavior
of these indices in Brazilian dialysis clinics in order to establish the diagnosis of where we are, which way we should we go and whether the targets set by the Ministry of Health are feasible.
In this study, we evaluated the behavior of the quality indicators proposed by the Ministry of Health in eight dialysis clinics in the state of São Paulo, comparing the results with the targets set out in Ordinance nº 389/2014.
M
ATERIAL ANDM
ETHODSEight dialysis clinics in the state of São Paulo allowed the demographic and laboratory data of their patients on chronic hemodialysis to be studied. We did not differentiate between prevalent and incident patients on dialysis, because Ordinance nº 389/2014 does not consider such difference.
The analyzed demographic data were: age, gender, time in dialysis, dialysis session duration, number of deaths and total number of patients seen in the month. Biochemical analysis involved blood hemoglobin and phosphorus concentration, were carried out by standard laboratory techniques and intact parathyroid hormone (PTH) by electrochemoluminometric assay technique. The fractional clearance of urea (Kt/V) was calculated by using the 2nd Generation Daugirdas Equation.12 The
study was carried out in April of 2013. Regarding PTH, the data was collected from November 2012 to April 2013, since the Brazilian law requires this dosing to be carried out only every six months.
The results from each clinic and that of the entire set of patients were analyzed in relation to the targets set by Ordinance nº 389/2014: Kt/V > 1.2 in more than 70% of patients, hemoglobin levels between 10 and 12 g/dl in over 80% of patients, phosphorus between 3.5 and 5.5 mg/dl in over 50% of patients and PTH less than 600 pg/ml in over 80% of patients.11
The monthly mortality rate was calculated by dividing the number of deaths and the total number of patients undergoing hemodialysis in the month. The annualized mortality rate was estimated by the ratio of the expected number of deaths in the year (number of deaths in the month multiplied by 12) and the sum of the total number of dialysis patients in the month plus the expected number of deaths in the year. Since Ordinance nº 389/2014 does not establish clearly the goal for the death rate, we chose to use as target, the average rate of the Brazilian dialysis census from the Brazilian Society of Nephrology in the years of 2011, 2012 and 2013, equivalent to 18.9% per year.13
The results are expressed as percentages for categorical variables, mean and standard deviations for the variables with Gaussian distribution and median and percentiles 25 and 75 for variables with non-Gaussian distribution. Finally, the analyses were performed only in a descriptive way, because the objective was not to compare clinics with each other, but to assess individual performance against targets set out in Ordinance nº 389/2014.
R
ESULTSOf the eight participating clinics, six were administered by the private sector, working as satellite centers. Two functioned in the hospital and were linked to the state government, one in the form of direct administration and another through a foundation. Six were for-profit clinics and two were nonprofit, and, of these, one was involved in teaching and clinical research.
Two clinics had fewer than 100 patients, one had100 to 200 patients, and five had more than 200 patients. In total, we analyzed data from 1,633 patients.
Table 2 shows Kt/V, hemoglobin, phosphorus and PTH behaviors in relation to the targets set by Ordinance nº 389/2014. For Kt/V, six (75%) clinics reached the goal. Insofar as hemoglobin is concerned, none of the clinics hit the target. For phosphorus, only two (25%) clinics reached the goal. And, as far as PTH is concerned, four (50%) clinics reached the target. However, in most clinics, the average value of the variables was within or very close to the targets set by most international guidelines when evaluating individual patients.
When the results of the eight clinics were analyzed together, we found that it was only for Kt/V that the goal set by the Ordinance was reached. For the other variables, this result was below target, and this is particularly relevant for hemoglobin (Table 2).
Finally, with respect to mortality, we decided to compare the results from the eight clinics with the average mortality rate for the years 2011-2013, according to data from the Brazilian dialysis census, carried out by the Brazilian Society of Nephrology.13
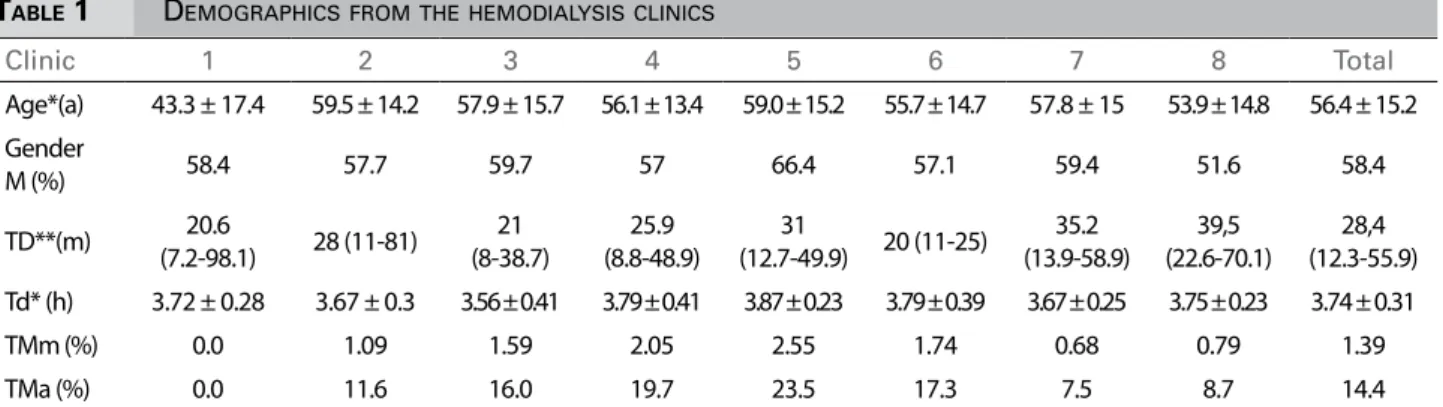
TABLE 1 DEMOGRAPHICSFROMTHEHEMODIALYSISCLINICS
Clinic 1 2 3 4 5 6 7 8 Total
Age*(a) 43.3 ± 17.4 59.5 ± 14.2 57.9 ± 15.7 56.1 ± 13.4 59.0 ± 15.2 55.7 ± 14.7 57.8 ± 15 53.9 ± 14.8 56.4 ± 15.2
Gender
M (%) 58.4 57.7 59.7 57 66.4 57.1 59.4 51.6 58.4
TD**(m) 20.6
(7.2-98.1) 28 (11-81)
21 (8-38.7)
25.9 (8.8-48.9)
31
(12.7-49.9) 20 (11-25)
35.2 (13.9-58.9)
39,5 (22.6-70.1)
28,4 (12.3-55.9)
Td* (h) 3.72 ± 0.28 3.67 ± 0.3 3.56 ± 0.41 3.79 ± 0.41 3.87 ± 0.23 3.79 ± 0.39 3.67 ± 0.25 3.75 ± 0.23 3.74 ± 0.31
TMm (%) 0.0 1.09 1.59 2.05 2.55 1.74 0.68 0.79 1.39
TMa (%) 0.0 11.6 16.0 19.7 23.5 17.3 7.5 8.7 14.4
** median (25th percentile-75th percentile). M: Male; TD: Time on dialysis; Td: Hemodialysis session length; TMm: Monthly death rate; TMa:
Annualized mortality rate; *mean ± standard deviation.
TABLE 2 DISTRIBUTIONOFUREA, HEMOGLOBIN, PHOSPHORUSANDPTHKT/VVALUESFROMTHEHEMODIALYSISCLINICSIN
RELATIONTOTHEGOALSSETBYORDINANCENº 389/2014
Clinic 1 2 3 4 5 6 7 8 Total Goal
Kt/V
M ± SD 1.57±0.32 1.55±0.29 1.38±0.31 1.27±0.23 1.31±0.28 1.55±0.4 1.47±0.36 1.38±0.33 1.42±0.3
< 1,2(%) 11.3 6.7 23.6 31 32.8 14.4 17.4 23.5 21.1 < 30
≥ 1,2(%) 88.7 93.3 76.4 69 67.2 85.6 82.6 76.5 78.9 > 70
Hemoglobin (g/dl)
M±SD 11.2±1.5 11.3±1.7 11.35±1.72 11.29±1.6 11.48±1.72 11.68±1.8 11.3±1.78 11.09±1.91 11.32±1.74
< 10(%) 15.6 18.4 19 19.5 18.1 14.7 19.2 12 19.4
10-12(%) 58.4 47.1 48.3 47.9 49.4 46.8 47.7 56.8 47.7 > 80
> 12(%) 26 34.5 32.7 32.6 32.5 38.5 33.1 31.2 32.9
Phosphorus (mg/dl)
M±SD 5.06±1.9 5.6±1.76 5.69±1.51 5.71±1.47 5.64±1.45 5.33±1.71 4.8±1.59 4.98±1.59 5.33±1.64
< 3,5(%) 23.4 12.1 1.7 5.5 3.6 12.8 16.3 12 10.6
3,5-5,5(%) 41.6 39 48.3 44.7 47.4 46.8 55.9 56.8 48.4 > 50
> 5,5(%) 35 48.9 50 49.8 49 40.4 27.8 31.2 41
PTH(pg/ml)
Median (P25-P75)
280 (132-503)
179 (95-376)
222 (97-397)
391 (225-631)
421 (250-648)
292 (128-532)
295 (158-576)
335 (115-519)
310 (150-554)
< 600 (%) 80.8 86.3 90 72.5 70.1 80.2 76.4 70.3 76.7 > 80
≥ 600 (%) 19.2 13.7 10 27.5 29.9 19.8 23.6 29.7 23.3 < 20
Thus, with the mortality rate cutoff of less than 18.9%, we noticed that six clinics (75%) reached the target, and two (25%) did not (Table 1).
D
ISCUSSIONOrdinance No. 389/2014 establishes the line of care for patients with chronic kidney disease in its various stages of evolution. For patients on dialysis, the Ordinance provides that at the end of two years after joining the program, the clinics should achieve the following indices: Kt/V > 1.2 in more than 70% of patients, hemoglobin levels between 10 and 12 g/dl in over 80% of patients, phosphorus between 3.5 and 5.5 mg/dl for over 50% of patients and PTH less than 600 pg/ml for over 80% of patients.11 Our results
show that meeting these indexes will be an extremely difficult task, particularly in regards to the control of anemia and phosphorus metabolism.
Within the guidelines proposed by many nephrological societies, there are recommendations for achieving certain goals in individual patients. Undoubtedly, it is utopian to imagine that 100% of the patients will achieve the established goals. A substantial proportion of patients will be out of the proposed range. In this sense, the nephrology community has safe parameters to establish the acceptable range of patients who may be outside the ranges proposed without compromising morbidity and mortality rates.
When analyzing a cohort, the highest likelihood is that patients would achieve a few goals. Accordingly, studies have shown that the greater the number of indexes achieved by the patient, the lower their rates of morbimortality.8-10
However, when evaluating quality management programs, it is impossible to carry out such analysis by individual patient. This view, though fundamental to the physician involved in the care of patients, is not suitable for quality analysis. This has prompted initiatives to establish goals to be achieved in dialysis clinics.
In 2007, the Spanish Society of Nephrology, through the Dialysis Quality Management Group, proposed the following goals to be achieved by dialysis clinics: Kt/V > 1.3 in more than 80% of patients; hemoglobin > 11.0 g/dl in 95% of patients; phosphorus ≤ 5,5 mg/dl in more than 75% of patients and PTH between 150 and 300 pg/ml in over 30% of patients.14
In 2008, Alcázar et al.6 published the results of 28
dialysis units in Spain, encompassing 2,516 patients. In that study, the objectives were similar to the goals established by the Quality Assurance Group within the Spanish Society of Nephrology.14 The authors
reported Kt/V > 1.3 in 88.1% of patients; hemoglobin > 11 g/dl in 79%; phosphorus ≤ 5.5 g/dl in 79.1% and PTH between 150 and 300 pg/ml in 37.6% of patients. On average, these results are very good; however, in 9% of centers the Kt/V target was not achieved; the hemoglobin target was not achieved in any of the clinics; in 30.5% of the clinics the phosphorus target was not met and only 57% of the clinics reached the PTH < 800 pg/ml target in 95% of the patients.6
In 2013, the Ministry of Health of Portugal published a dialysis Ordinance setting the following indices: Equilibrated Kt/V ≥ 1.2 in more than 75% of patients; hemoglobin between 10 and 13 g/dl over 70% of patients and phosphorus between 3.5 and 5.5 mg/dl in more than 50% of the patients.15 Unlike
the Spanish Society of Nephrology,14 the Portuguese
Ministry of Health did not fix PHT targets, but they set a minimum phosphorus concentration of 3.5mg/ dl, probably with the purpose of improving patient nutritional control, knowing that hypophosphatemia may be associated with malnutrition.16
In a cohort of 13,792 patients on hemodialysis in the Dialysis Clinic Inc - a North American nonprofit dialysis provider group - Tentori et al.,8 reported Kt/V
≥ 1.2 in 56.7% of patients; hematocrit between 33 and 36% in 19.2% of patients; phosphorus between 3.5 and 5.5 mg/dl for 53.2%, and PTH between 150 and 300 pg/ml in 25.7% of patients.
In a cohort of 617 patients from 19 dialysis centers in western Switzerland, Saudan et al.,17 set as
goals: Kt/V > 1.2 in more than 80% of patients and hemoglobin > 11 g/dl in more than 85% of patients. For Kt/V, the mean result was that 76% of patients reached the target, ranging between 36-100% in different clinics. For hemoglobin, a mean of 77% of patients reached the target, ranging from 35 to 100% among the clinics.
In 2012, the French record of dialysis reported from a cohort of 17,455 patients, Kt/V > 1.2 in 77.9% of cases, ranging from 40 to 92% among the participating clinics. On the other hand, among 34,556 patients, hemoglobin was between 10 and 13 g/dl in 74.5% of patients, below 10 g/dL in 16.2% and above 13 g/dL in 9.3% of patients.19
The 2013 Brazilian census of Nephrology, carried out by the Brazilian Society of Nephrology, analyzed data from 50,961 patients in 334 dialysis centers and reported: Kt/V > 1.2 in 81% of patients; hemoglobin > 11 g/dl in 67%; phosphorus < 5.5 mg/dl in 64% and PTH higher than 600 pg/ml in only 17% of patients.20
Parra et al.,21 also using the indices proposed by
the Spanish Society of Nephrology,14 followed 313
patients in hemodialysis in four centers before and after the implementation of a quality program. After three years of follow up, Kt/V > 1.2 increased from 70 to 89.5% of patients; hemoglobin > 11 g/dl from 70.8% to 88.6% and phosphorus ≤ 5.5 mg/dl went from 59.9 to 78.4%.
Del Pozo et al.,7 in 2009, reported the results
obtained from 154 patients dialyzed in a single center, after the introduction of a quality improvement program. For Kt/V, the goal was to achieve a value ≥ 1.3 for more than 85% of patients and the result was achieved in 82.7%. For hemoglobin, the goal was a value ≥ 11 g/dL in 85% of patients, and they had it for 80.7% of the patients. For phosphorus, the goal was a value ≤ 5,5 mg/dl in 85% of patients, and the result achieved was 85.8%. For PTH, the target was more than 85% of patients with a value between 150 and 300 pg/ml, but only 38.8% reached the desired result.
Analyzing the various studies, it appears that the goals vary greatly in interval and percentage of patients within the target. It is easy to see that the narrower the target, the smaller the number of patients within the target range. On the other hand, for some variables the factors involved in achieving the goal are under the physician’s influence, making it easier to achieve the desired result.
In our study, the variables evaluated and the results found did not vary much from those reported in the literature. Considering the provisions of Ordinance nº 389/2014 for Kt/V, the goal was reached by most clinics, a fact confirmed in other studies.6,17,20,21
Accordingly, setting the appropriate treatment time, the blood and dialysate flow rate, and chosen dialysis
filter adequadely it is possible to achieve the target Kt/V with ease, especially in situations where the minimum value is 1.2.
For hemoglobin and phosphorus, it is more challenging to reach the goals, whatever the set range. In our study, hemoglobin values between 10 and 12 g/dl were observed in only 48% of patients, when the target is more than 80%.
Analyzing the clinics individually, we found that none of them reached the goal.
Several factors may have contributed to this disappointing result: narrow target range, irregular dispensing of erythropoiesis stimulating medication, inadequacies in the correction of iron metabolism, number of incident patients, prolonged time interval between sample collection, making it available and result analysis, prescription reformulation and the effective start of administration.
Therefore, for hemoglobin, the narrower the target range and the greater the percentage of patients within the required range, the shorter should be the interval between laboratorial control and more efficient should be the dispensing of medications to expedite prescription adjustments. Under the conditions found in our country, it will be hard for dialysis clinics to achieve the desired results.
With regards to phosphorus targets, the range proposed by the Ministry of Health is narrow, between 3.5 and 5.5 mg/dl; however, the target is to have only 50% of patients in it. This enabled the clinics to present results very close to the goal. However, assessing the numbers from another angle, we find that 41% of patients had phosphorus levels higher than 5.5 mg/dl. This result is much higher than the 20.9% reported by Alcázar et al.;6 the 14.2%
reported by Del Pozo et al.7 and the 21.6% reported
by Parra et al.21
Phosphorus control by dialysis is dependent on several variables. Dietary intake, prescription, use and access to phosphorus binders, as well as dialysis dose, are variables that influence the results. However, the most efficient way to control phosphorus is through a higher dialysis treatment time.22,23 Our results show
that among the clinics analyzed, the average treatment time was 3 hours and 45 minutes per session.
observations deserve attention. Since most clinics can achieve a proper Kt/V, there is a tendency to reduce the duration of dialysis. However, this reduction will favor an increase in the number of patients with phosphorous concentration above 5.5 mg/dL, regardless of prescription, use and access to suitable phosphate binders.
In this respect, it would be better for Ordinance nº 389/2014, rather than individualize the phosphorus level, associate the Kt/V target with a treatment duration greater than or equal to 12 hours a week for more than 80% of patients. But as far as our knowledge is concerned, no study has recommended or considered the impact of such action on phosphorus levels and mortality associated with dialysis. In this line of reasoning, the results observed in Australia and New Zealand bring about interesting reflections on dialysis duration and treatment-associated mortality.24,25
For PTH, the target set by the Ministry of Health is that less than 20% of dialysis patients having PTH greater than 600 pg/ml. In this study, the percentage of patients who achieved this rate varied between 10 and 29.9% in different clinics. When patients were analyzed together, 23.3% had PTH greater than or equal to 600 pg/ml. Our results also show that only half of the clinics reached the target set for the PTH. In clinics that reached the target, the average number of patients with PTH above 600 pg/mL was 15.7% and for those who had not reached the target, the mean value was 27.7%.
Several factors may influence the PTH level. In addition to the methodology used in dosing, renal disease etiology, time on dialysis, dialysis dose, dialysate electrolyte composition, access to phosphate binders, vitamin D and calcimimetics, and ease to perform parathyroidectomy are factors that influence PTH.26
In our study, these parameters were not analyzed individually but our findings led us to state that, in clinics that reached the PTH target, the median dialysis time was 20.6; 28; 21 and 20 months, while the clinics that did not reach the goal had 25.9; 31; 35.2 and 39.5 months (Table 1), respectively. The averages of these values were 22.4 ± 3.8 and 32.9 ± 5.8 months, respectively (p = 0.02; t-test).
Therefore, in dialysis clinics that had low mortality rates, the time of dialysis will be longer and hence PTH levels will also be higher, without
this representing a bad quality standard. Moreover, in a dialysis clinic where the time is longer, but the number of parathyroidectomy surgery is high, a smaller percentage of patients have PTH > 600 pg/ ml. In our study, this type of situation was found for clinic number 2.
Finally, in relation to mortality, Ordinance nº 389/2014 provides that such calculation should be carried out monthly and that after two years of the quality program implementation the rate should be no higher than 10%. Unfortunately, the wording is not conclusive whether or not it refers to a monthly or annual rate.
The mortality rate interpretation is impaired when the observation time is greatly reduced. Ideally, the rate should be calculated at annual intervals and monthly assessments are used only as a monitoring tool for establishing a level of action. In our study, when the clinics were evaluated individually, their monthly mortality rates varied between zero and 2.55%, while the annualized rate varied between zero and 23.5%.
It is worth mentioning that the annual mortality rate was estimated from the monthly rate. Therefore, our results should be interpreted with extreme caution because the observation time was only of one month. Thus, in clinic number 1, mortality in the month of assessment was zero, projecting an annual rate of zero, a situation that is not sustained in clinical practice. However, the monthly rate behavior tends to be relatively stable, suggesting that mortality in clinic nº 1 is low. In an attempt to reduce interference from the observation time, we calculated the rate of monthly and annual mortality for all patients, with the result of 1.39 and 14.37%, respectively.
Since Ordinance nº 389/2014 does not establish clearly the goal of the mortality rate, this discussion can be carried out in one of two ways: if the rate is up to 10% per month, it seems paradoxical to require strict quality parameters such as the ones established in the Ordinance; on the other hand, if the mortality rate is up to 10% per year, the Ministry of Health establishes a hard goal to be achieved, even for dialysis units with good quality standards, in which the mortality rate ranges between 10 and 25% per year.26-29
of up to 10% per month, the Ministry of Health discourages investment in quality and incurs a situations of fragility, because it lacks arguments to demand improvements when the mortality rate is below the maximum acceptable. On the other hand, assuming a mortality rate of up to 10% per year, there will be a need for large investments in quality improvement programs, since the Brazilian mortality rates, according to the Brazilian Dialysis Census from the Brazilian Society of Nephrology, in the years 2011, 2012 and 2013 were respectively 19.9, 18.8 and 17.9%, equivalent to an average rate of 18.9% per year.13
There seems no doubt that by establishing a target, the Ministry of Health aims to improve the quality of dialysis care in Brazil and, consequently, reduce the mortality rate of the treatment. Our study shows that in the six clinics that have reached two of the four indices, the mortality rate was lower than in the two clinics that did not meet any of the indices. This result confirms that the greater the number of indexes achieved by the patients, the lower the rates of hospitalization and mortality.8-10
However, it is noteworthy that the mortality rate for dialysis depends on several factors, such as population age, type of vascular access, hemodialysis session length and presence of comorbidities - diabetes mellitus, cardiovascular disease and malnutrition.29,30
Also, being a country of continental size, Brazil has different social and economic contrasts, which will be reflected in the regional mortality rate as reported in other studies.28 Therefore, it is up to the Ministry of
Health and their representatives to discuss with the Brazilian nephrology community goals to be achieved with regards to mortality rates.
Our study has several limitations. The data was analyzed only in a single cross sectional cohort. In this regard, it is noteworthy that, among the participating clinics, sequential analyses were performed at regular three-month intervals, and the results showed only small variations in the pattern of each clinic (data not shown).
Another limitation of our study is that the clinical analysis laboratory varied between dialysis centers. Five laboratories were used for biochemical measurements. Three laboratories provided services to two clinics and two laboratories to a clinic each. Although all of them were accredited and supervised by the competent agencies and participated on
quality control programs, this may represent a bias in interpreting the results.
Our study was carried out in different regions of the state of São Paulo. In some areas the administration, supervision and transfer of funds was done by municipal committees and in others by state committees. This allows the use of different assessment criteria and transfer of funds, which could influence the results. Also, the dispensation of high-cost medicines has different operational standards according to location.
Despite these limitations, our study points to the importance of establishing defined and strict targets in quality control processes. Such policies will not only analyze the results based on the individual behavior of each patient, but also the results achieved by the patient population being treated in the dialysis clinic.
Simultaneous analysis of these two parameters enable the development of strategies to improve the quality indices of dialysis units.
In conclusion, our study shows that in relation to the targets set by Ordinance nº 389/2014, for patients with 5D CKD, variables such as Kt/V and phosphorus concentration should be easily met by most dialysis clinics. As far as hemoglobin is concerned, the targets should not be achieved by most clinics. As for the PTH, the results will vary and depend on patient and facility characteristics to perform parathyroidectomy.
R
EFERENCES1. National Kidney Foundation. KDOQI. Clinical practice guide-line and clinical practice recommendations-2006 update-hemo-dialysis adequacy, peritoneal update-hemo-dialysis adequacy, vascular access. Am J Kidney Dis 2006;48:S1-322.
2. European best practice guidelines on haemodialysis. Nephrol Dial Transplant 2007;22:ii1-20.
3. Kidney Health Australia - CARI Guidelines - Dialysis Guide-lines. http://www.cari.org.au/Dialysis/dialysis_guideGuide-lines.html Acessado em: 16 de dezembro de 2014.
4. Guías Clínicas Centros de Hemodiálisis - Sociedad Española de Nefrología [Acesso 16 Dez 2014]. Disponível em: http:// www.minsa.gob.pe/dgiem/infraestructura/WEB_DI/NORMAS/ guia%20centro%20hemodialisis%20espa%C3%B1a.pdf 5. Haemodialysis guidelines - The Renal Association -
Uni-ted Kingdom [Acesso 16 Dez 2014]. Disponível em: http:// www.renal.org/guidelines/modules/haemodialysis#sthash. BB71rlr9.9iTwXM5Q.dpbs
6. Alcázar JM, Arenas MD, Alvarez-Ude F, Virto R, Rubio E, Maduell F, et al. Preliminary results of the Spanish Society of Nephrology multicenter study of quality performance mea-sures: hemodialysis outcomes can be improved. Nefrologia 2008;28:597-606.
8. Tentori F, Hunt WC, Rohrscheib M, Zhu M, Stidley CA, Ser-villa K, et al. Which targets in clinical practice guidelines are associated with improved survival in a large dialysis organiza-tion? J Am Soc Nephrol 2007;18:2377-84.
9. Plantinga LC, Fink NE, Jaar BG, Sadler JH, Levin NW, Co-resh J, et al Attainment of clinical performance targets and improvement in clinical outcomes and resource use in hemo-dialysis care: a prospective cohort study. BMC Health Serv Res 2007;7:5. DOI: http://dx.doi.org/10.1186/1472-6963-7-5 10. Rocco MV, Frankenfield DL, Hopson SD, McClellan WM.
Relationship between clinical performance measures and outcomes among patients receiving long-term hemodialysis. Ann Intern Med 2006;145:512-9. PMID: 17015869 DOI: http://dx.doi.org/10.7326/0003-4819-145-7-200610030-00009
11. Brasil. Ministério da Saúde. Portaria Nº 389, de 13 de março de 2014. Define os critérios para a organização da linha de cuidado da Pessoa com Doença Renal Crônica (DRC) e institui incentivo financeiro de custeio destinado ao cuidado ambulato-rial pré-dialítico. Brasília: Diário Oficial da União nº 141 de 25 de julho de 2014. p.39-44.
12. Daugirdas JT. Second generation logarithmic estimates of sin-gle-pool variable volume Kt/V: an analysis of error. J Am Soc Nephrol 1993;4:1205-13.
13. Sesso RC, Lopes AA, Thomé FS, Lugon JR, Dos Santos DR. Brazilian Chronic Dialysis Survey 2013 - trend analysis be-tween 2011 and 2013. J Bras Nefrol 2014;36:476-81. DOI: http://dx.doi.org/10.5935/0101-2800.20140068
14. Revuelta KL, Barril G, Caramelo C, Delgado R, López FG, Valdecasas JG, et al. Desarrollo de un sistema de monitori-zación clínica para hemodiálisis: propuesta de indicadores del Grupo de Gestión de Calidad de la S.E.N. Nefrología 2007;27:542-59.
15. Registro de informação na plataforma de gestão integrada da doença - insuficiência renal crônica - Circular normativa nº 12/2013/DPS - Ministério da Saúde - Governo de Portugal [Acesso 16 Dez 2014]. Disponível em: http://www.acss.min--saude.pt/Portals/0/CN%2012.pdf
16. de Castro MC, de Oliveira FC, da Silveira AC, Gonzaga Kde B, Xagoraris M, Centeno JR, et al. Importance of the monthly biochemical evaluation to identify patients on he-modialysis with malnutrition. J Bras Nefrol 2010;32:349-54.
17. Saudan P, Halabi G, Perneger T, Wasserfallen JB, Kossovsky M, Feldman H, et al. Variability in quality of care among dialysis units in western Switzerland. Nephrol Dial Trans-plant 2005;20:1854-63. DOI: http://dx.doi.org/10.1093/ ndt/gfh972
18. USRDS 2014 - End-stage Renal Disease (ESRD) in the United States volume 2 - Clinical Indicators and Preventive Care [Aces-so 16 Dez 2014]. Disponível em: http://www.usrds.org/2014/ view/Default.aspx
19. Réseau Epidémiologie et Information em Néphrologie (REIN): Rapport annuel 2012 [Acesso 16 Dez 2014]. Disponível em: http://www.soc-nephrologie.org/PDF/enephro/registres/rap-port_2012/rapport_2012.pdf
20. Censo de Diálise - SBN 2013 [Acesso 16 Dez 2014]. Disponível em: http://www.sbn.org.br/pdf/censo_2013-14-05.pdf
21. Parra E, Ramos R, Betriu A, Paniagua J, Belart M, Martínez T. Effect of a quality improvement strategy on several haemo-dialysis outcomes. Nephrol Dial Transplant 2008;23:2943-7. DOI: http://dx.doi.org/10.1093/ndt/gfn116
22. Spalding EM, Chamney PW, Farrington K. Phosphate kinetics during hemodialysis: Evidence for biphasic regulation. Kidney Int 2002;61:655-67. PMID: 11849409 DOI: http://dx.doi. org/10.1046/j.1523-1755.2002.00146.x
23. Musci I, Hercz G, Uldall R, Ouwendyk M, Francoeur R, Pier-ratos A. Control of serum phosphate without any phosphate binders in patients treated with nocturnal hemodialysis. Kidney Int 1998;53:1399-404. DOI: http://dx.doi.org/10.1046/j.1523-1755.1998.00875.x
24. Australia and New Zealand Dialysis and Transplant Registry - ANZDATA 2012 - Thirty Fifth Annual Report [Acesso 16 Dez 2014]. Disponível em: http://www.anzdata.org.au/anzda-ta/AnzdataReport/35thReport/2012_annual_report.pdf 25. Marshall MR, Byrne BG, Kerr PG, McDonald SP.
Associa-tions of hemodialysis dose and session length with morta-lity risk in Australian and New Zealand patients. Kidney Int 2006;69:1229-36. PMID: 16609687 DOI: http://dx.doi. org/10.1038/sj.ki.5000188
26. Kidney Disease: Improving Global Outcomes (KDIGO) CKD--MBD Work Group. KDIGO clinical practice guideline for the diagnosis, evaluation, prevention, and treatment of Chronic Kidney Disease-Mineral and Bone Disorder (CKD-MBD). Kid-ney Int 2009;76:S1-130. PMID: 19644521
27. U.S. Renal Data System. 2013 USRDS Annual Data Report. National Institutes of Health, National Institute of Diabetes and Digestive and Kidney Diseases. Bethesda: U.S. Renal Data System; 2013 [Acesso 16 Dez 2014]. Disponível em: http:// www.usrds.org/2013/pdf/v1_00_intro_13.pdf
28. van Dijk PC, Zwinderman AH, Dekker FW, Schön S, Stel VS, Finne P, et al. Effect of general population mortality on the nor-th-south mortality gradient in patients on replacement therapy in Europe. Kidney Int 2007;71:53-9. PMID: 17091125 DOI: http://dx.doi.org/10.1038/sj.ki.5002008
29. Goodkin DA, Young EW, Kurokawa K, Prütz KG, Levin NW. Mortality among hemodialysis patients in Europe, Ja-pan, and the United States: case-mix effects. Am J Kidney Dis 2004;44:16-21. PMID: 15486869 DOI: http://dx.doi. org/10.1016/S0272-6386(04)01100-X