www.earth-syst-dynam.net/7/371/2016/ doi:10.5194/esd-7-371-2016
© Author(s) 2016. CC Attribution 3.0 License.
Atmospheric rivers moisture sources from a Lagrangian
perspective
Alexandre M. Ramos1, Raquel Nieto2, Ricardo Tomé1, Luis Gimeno2, Ricardo M. Trigo1,
Margarida L. R. Liberato1,3, and David A. Lavers4
1Instituto Dom Luiz, Faculdade de Ciências, Universidade de Lisboa, Lisbon, Portugal
2EPhysLab (Environmental Physics Laboratory), Facultade de Ciencias, Universidade de Vigo, Ourense, Spain 3Escola de Ciências e Tecnologia, Universidade de Trás-os-Montes e Alto Douro, Vila Real, Portugal
4European Centre for Medium-Range Weather Forecasts, Shinfield Park, Reading, RG2 9AX, UK
Correspondence to:Alexandre M. Ramos ([email protected])
Received: 2 December 2015 – Published in Earth Syst. Dynam. Discuss.: 17 December 2015 Revised: 17 March 2016 – Accepted: 12 April 2016 – Published: 22 April 2016
Abstract. An automated atmospheric river (AR) detection algorithm is used for the North Atlantic Ocean basin, allowing the identification of the major ARs affecting western European coasts between 1979 and 2012 over the winter half-year (October to March). The entire western coast of Europe was divided into five domains, namely the Iberian Peninsula (9.75◦
W, 36–43.75◦
N), France (4.5◦
W, 43.75–50◦
N), UK (4.5◦
W, 50–59◦
N), southern Scandinavia and the Netherlands (5.25◦
E, 50–59◦
N), and northern Scandinavia (5.25◦
E, 59–70◦
N). Following the identification of the main ARs that made landfall in western Europe, a Lagrangian analysis was then applied in order to identify the main areas where the moisture uptake was anomalous and contributed to the ARs reaching each domain. The Lagrangian data set used was obtained from the FLEXPART (FLEXible PARTicle dispersion) model global simulation from 1979 to 2012 and was forced by ERA-Interim reanalysis on a 1◦
latitude–longitude grid.
The results show that, in general, for all regions considered, the major climatological areas for the anomalous moisture uptake extend along the subtropical North Atlantic, from the Florida Peninsula (northward of 20◦
N) to each sink region, with the nearest coast to each sink region always appearing as a local maximum. In addition, during AR events the Atlantic subtropical source is reinforced and displaced, with a slight northward movement of the sources found when the sink region is positioned at higher latitudes. In conclusion, the results confirm not only the anomalous advection of moisture linked to ARs from subtropical ocean areas but also the existence of a tropical source, together with midlatitude anomaly sources at some locations closer to AR landfalls.
1 Introduction
Atmospheric rivers (ARs) are relatively narrow (on average ∼500 km) pathways of water vapour (WV) transport that can extend for thousands of kilometres, contain large amounts of WV, and are often accompanied by strong winds (Zhu and Newell, 1998; Ralph et al., 2004). According to several au-thors (Ralph et al., 2004, 2005), their properties include a concentrated band of enhanced WV in the lower troposphere and a pre-cold frontal low-level jet (LLJ) due to the tem-perature gradient across the cold front (Neiman et al., 2008; Ralph et al., 2004, 2005).
uplift (upslope flow), accompanied by rainout over moun-tains earlier on its approach to the WCB. TMEs are zones of intense vapour transport out of the tropics, vapour that is frequently conducted by ARs towards cyclones and WCBs. TMEs can provide important vapour sources for ARs, but most ARs also incorporate midlatitude sources and conver-gences of vapour along their paths (Dettinger et al., 2015; Sodemann and Stohl, 2013). In addition, the role of ARs in explosive cyclogenesis over the North Atlantic Ocean has been shown for three extra-tropical cyclones (Klaus, Gong, and Stephanie), all of which had major socio-economic im-pacts in parts of Europe (Ferreira et al., 2016).
The importance of ARs in extreme precipitation events and floods has been analysed in detail for the west coast of the USA (particularly for California) over the last decade (e.g. Dettinger et al., 2011; Neiman et al., 2008; Ralph et al., 2004, 2013).
For Europe, Lavers and Villarini (2013) showed that ARs are responsible for many annual maximum precipitation days in western Europe, with the relationship being stronger along the western European seaboard, and with some areas having up to 8 of their top-10 annual maxima related to ARs. It was also shown that 40–80 % of winter floods in the UK are as-sociated with persistent ARs and that these ARs are critical in explaining the 10 largest winter flood events in a range of British rivers basins since 1970 (Lavers et al., 2011, 2012). For the Iberian Peninsula, Ramos et al. (2015) showed that ARs play an overwhelming role in most extreme precipita-tion days, decreasing in importance for less extreme precip-itation days. Moreover, over the North Atlantic Ocean and for the island of Madeira, in particular, the association be-tween extreme precipitation and ARs has also been estab-lished (Couto et al., 2012, 2015).
In addition, the importance of ARs in a few particular cases of extreme precipitation in Europe has also been anal-ysed in some detail. Liberato et al. (2012) discussed an ex-treme precipitation event associated with an AR occurring in the city of Lisbon, Portugal, in November 1983, which produced flash flooding, urban inundations, and landslides, causing considerable damage to infrastructure and human fa-talities. On the Norwegian southwest coast, an extreme pre-cipitation event occurred in September 2005 and was also shown to be directly linked with an AR (Stohl et al., 2008). More recently, Trigo et al. (2014) considered the record pre-cipitation and flood event in the Iberia Peninsula of Decem-ber 1876 and highlighted the importance of ARs in this his-torical event.
The association between ARs and modes of low-frequency variability has already been addressed, with the Scandinavian pattern having a negative correlation with the occurrence of ARs in Britain (Lavers et al., 2012), while it is the North Atlantic Oscillation that controls their occurrence to a certain extent in the rest of Europe (Lavers and Villarini, 2013). In addition, Ramos et al. (2015) showed that for the particular
case of the Iberian Peninsula the Eastern Atlantic pattern also plays a major role in explaining the annual variability of ARs. The increasing attention to the topic of ARs is confirmed by the publication of two recent reviews, with Ralph and Det-tinger (2011) emphasizing the multiple studies of ARs strik-ing the western coast of the USA, while Gimeno et al. (2014) focused on the structure, methods of detection, impacts, and dynamics of ARs.
Bao et al. (2006) suggested that the moisture present in ARs has two main origins, namely local moisture conver-gence along the front of extra-tropical cyclones and direct poleward transport of tropical moisture, suggesting that they play an important role in the water cycle, especially in trans-porting moisture from the tropics to the mid- and high lat-itudes. In this context Dacre et al. (2015) analysed selected cases of the transport of water vapour within a climatology of wintertime North Atlantic extra-tropical cyclone. In this particular study, the possibility was discussed that ARs are formed by the cold front that sweeps up water vapour in the warm sector as it catches up with the warm front. This causes a narrow band of high water vapour content to form ahead of the cold front at the base of the warm conveyor belt airflow. Thus, according to Dacre et al. (2015), water vapour in the warm sector of the cyclone, rather than long-distance trans-port of water vapour from the subtropics, is responsible for the generation of ARs. According to Dettinger et al. (2015) it seems that a combination of the two points of view are valid because TMEs can provide important vapour sources for ARs, but most ARs also incorporate midlatitude sources and convergences of vapour along their paths.
To the best of our knowledge studies dealing with mois-ture sources from a Lagrangian point of view along the paths of ARs are scarce and have only been developed for se-lected case studies. For instance, Moore et al. (2012) used Lagrangian trajectories associated with heavy flooding rain-fall in Nashville (USA) to analyse whether these were con-nected with AR events, while Ryoo et at. (2015) analysed the transport pathways of water vapour associated with AR events that made landfall along the west coast of the USA between 1997 and 2010. In addition, Rutz et al. (2015) anal-ysed the evolution of ARs over western North America using trajectories released at 950 and 700 hPa within ARs along the Pacific coast. In this case a forward mode was used to study the inland penetration of ARs.
in December 2006. Finally, Knippertz and Wernli (2010) presented a Lagrangian climatology of tropical moisture ex-ports to the northern hemispheric extra-tropics by analysing forward trajectories leaving a box between 0 and 20◦
N for 1979–2001.
These researchers based their results on the use of La-grangian models, which allow studying the evolution of moisture in the atmosphere along a number of trajectories. The use of Lagrangian models such as FLEXPART (FLEX-ible PARTicle dispersion model; Stohl et al., 1998) can help us to assess the main sources of moisture and its transport within ARs. This Lagrangian model allows us to follow the moisture that reaches a specific region, more specifically making it possible to track changes in the specific humidity along the trajectories over time. By knowing the specific hu-midity (q) at every time step, it is possible to identify those particles that lose moisture through precipitation (p) or re-ceive it through evaporation (e). FLEXPART can “transport” these particles backwards or forwards in time using a 3-D wind field. The record of evaporation minus precipitation (e−p) provides information on the sources (when evapo-ration exceeds precipitation) and sinks (when precipitation exceeds evaporation) of moisture.
The Lagrangian methodology of identifying moisture sources based on FLEXPART has been extensively used over the past decade both for regional (e.g. Nieto et al., 2007) and global studies (Gimeno et al., 2010a). The comprehensive re-view by Gimeno et al. (2012) provides details of the uncer-tainty and significance of this Lagrangian approach, as well as a comparison with other methods of estimating moisture sources, and the original paper by Stohl and James (2004) provides further information on the FLEXPART model. Here we are mainly interested in analysing the backward trajecto-ries that arrive in the various regions along the Atlantic coast of Europe where ARs make landfall. The objectives of this work are (1) to identify the ARs affecting the western Euro-pean coast between 1979 and 2012 during the winter half-year (ONDJFM) and (2) to provide a comprehensive anal-ysis of the areas where the AR moisture uptake is anoma-lous over the same period for the ARs that reach the differ-ent European domains. The added value of the manuscript is mainly twofold: (a) firstly the current study is the first to anal-yse those areas where the moisture uptake is anomalous for the ARs that reach the European coast from a climatological perspective; (b) secondly we have made refinements to the AR tracking method introduced by Lavers et al. (2012). In the present version, we use three reference meridians rather than a single fixed one for the whole of western Europe to have a higher accuracy on landfall times and locations (see Sect. 2.1). This is of the utmost importance for analysing the anomaly for the moisture uptake for the ARs based on the use of (E−P), because just a few degrees of difference in the reference meridian longitude may translate into an erro-neous detection for any anomalous moisture sources.
The work is organized as follows: we present the data sets and the different methodologies in Sect. 2, while in Sect. 3 we analyse ARs that reach landfall in Europe. The detection of those areas where the moisture uptake is anomalous for ARs that reach Europe is analysed in Sect. 4. Finally, our conclusions are presented in Sect. 5.
2 Methods and data sets
2.1 Atmospheric river detection
The detection of ARs can be achieved by adopting two very different approaches, namely (a) using integrated column water vapour (IWV) (e.g. Ralph et al., 2004; Ralph and Det-tinger, 2011) and (b) based on vertically integrated horizon-tal water vapour transport (IVT) (e.g. Zhu and Newell, 1998; Lavers et al., 2012; Ramos et al., 2015). The choice of either of these two approaches is perfectly valid and will depend on the purpose and location of the study.
In this case we have used the ERA-Interim reanalysis (Dee et al., 2011) with a 0.75◦latitude–longitude grid resolution,
spanning from 1979 to 2012 for the winter half-year (October to March, ONDJFM) for the detection of ARs. The variables used at 6 h time steps were the specific humidity, as well as zonal and meridional winds at the 1000, 925, 850, 700, 600, 500, 400, and 300 hPa levels, given that most of the moisture transport is accounted for in these levels.
The AR detection scheme employed (Lavers et al., 2012; Ramos et al., 2015) depends entirely on the IVT and was computed between the 1000 and the 300 hPa levels (Eq. 1):
IVT= v u u u u t 1 g 300 hPa Z 1000 hPa qudp 2 + 1 g 300 hPa Z 1000 hPa qvdp 2 , (1)
whereq is the specific humidity,uandvare the zonal and meridional layer averaged wind respectively, anddpis the pressure difference between two adjacent levels.gdenotes the acceleration due to gravity.
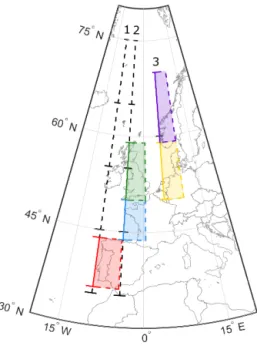
The identification of ARs is similar to that performed by Lavers and Villarini (2013) for Europe and Ramos et al. (2015) for the Iberian Peninsula, and it considers only one reference meridian for the computation of the ARs. In this case we have used three distinct reference meridians (Fig. 1) located at 9.75◦
W (meridian 1, just west of both the Iberian Peninsula and Ireland), 4.50◦
W (meridian 2, located west of the UK and France), and 5.25◦E (meridian 3, west of
Scandi-navia). Each different reference meridian (Fig. 1) was further divided into 10◦ latitudinal sections between 35 and 75◦N
for the 9.75 and 4.50◦W reference meridians, and between
50 and 70◦
N for the 5.25◦
Figure 1.(a)Location of the three different reference meridians and sectors in Europe used for the computation of the atmospheric rivers. (b)The newly defined atmospheric river landfall domains: Iberian Peninsula (red), France (blue), UK (green), southern Scan-dinavia and the Netherlands (yellow), and northern ScanScan-dinavia (purple).
The value for the highest IVT and its respective latitude (IVT threshold) for each meridian was computed as fol-lows: we extracted the maximum IVT at 12:00 UTC each day for the entire period between 35 and 75◦
N (for the 9.75 and 4.50◦
W meridians) and between 50 and 70◦
N (for the 5.25◦
E meridian) and sorted these into 10◦
latitude bins. Following the approach adopted in Lavers et al. (2013), the threshold chosen for each bin corresponds to the 85th per-centile of the maximum IVT values included in that bin. The derived thresholds for the different reference meridians and sectors are summarized in Table 1.
After having computed the different thresholds for each reference meridian, the following detection scheme was ap-plied for each sector:
a. At each 6 h time step of the data set (each day has four time steps) between 1979 and 2012 over the winter half-year, we compared the IVT values at the grid points for each reference meridian and extracted the maximum IVT value and its location.
b. Where the maximum IVT exceeded the local IVT threshold (which depends on both longitude and lati-tude and was computed for each meridian reference bin; Table 1), this particular grid point was highlighted. We then performed a west/east search to identify the max-imum IVT at each longitude and tracked the location for the grid points where the local IVT threshold was exceeded. However, ARs have to extend for at least
Table 1.The vertically integrated horizontal water vapour trans-port (IVT) threshold and the number of persistent atmospheric rivers detected for each different reference meridian.
Sector IVT Number
threshold of ARs (kg m−1s−1)
Reference meridian 1 35–45◦N 621.7048 79
(9.75◦W) 45–55◦N 691.5456 87
55–65◦N 614.4121 70
65–75◦N 453.4208 35
Reference meridian 2 35–45◦N 527.9475 113
(4.50◦W) 45–55◦N 637.2342 94
55–65◦N 544.0915 98
65–75◦N 439.4734 46
Reference meridian 3 50–60◦N 524.1678 100
(5.25◦E) 60–70◦N 468.0643 80
1500 km; therefore a minimum length threshold was also imposed. In this case, it corresponded to 30 con-tiguous longitude points (30×0.75◦
=22.25–1600 km, considering that at 50◦
N the length of a degree of lon-gitude is∼71 km). Provided that this condition was ful-filled for a particular time step, we considered it to be an AR time step.
c. Because we applied the same procedure to all time steps, we obtained all the AR time steps identified for the different reference meridians, but only persistent AR events were retained. For a persistent AR event to oc-cur (Lavers and Villarini, 2013; Ramos et al., 2015), a temporal criterion was applied in that (1) it required a persistence of at least 18h (three continuous time steps), and (2) to be independent, two persistent ARs were con-sidered distinct only when they were separated by more than 1 day (four time steps). A spatial criterion was also applied: a movement of not more than 4.5◦
latitude to the north or south of the initial IVT maximum in a 18 h period.
The number of persistent ARs identified for each reference meridian is summarized in Table 1 (last column) and will be discussed in Sect. 3. Given that we are particularly interested in those ARs that have impacts over land, we reorganized the previously computed ARs (Fig. 1 and Table 1) into the following five new domains shown in Fig. 1 using different-coloured solid lines and identified as (1) Iberian Penin-sula(red; 9.75◦
W, 36–43.75◦
N); (2)France(blue; 4.5◦
W, 43.75–50◦
N); (3)UK(green; 4.5◦
W, 50–59◦
N); (4) south-ern Scandinavia and the Netherlands(yellow; 5.25◦
E, 50– 59◦
N) and (5)northern Scandinavia(purple; 5.25◦
E, 59– 70◦
N). This allows us to use contiguous domains from 36 to 70◦
division. This new division will be very helpful in Sect. 4, where the study of the anomalous moisture uptake for ARs will be analysed in greater detail, given that the specific loca-tion at which the ARs make landfall is of the utmost impor-tance.
2.2 Lagrangian moisture quantification
The method developed by Stohl and James (2004) allows us to track the atmospheric moisture along Lagrangian tra-jectories of air parcels in the atmosphere using the FLEX-PART v9.0 Lagrangian model. This model simulates the movement of approximately 2.0 million atmospheric parcels every 3 h. Our global simulation was forced using ERA-Interim reanalysis data (Dee et al., 2011) from 1979 to 2012. At each initial time this Lagrangian model distributes the air parcels (also namely particles) homogeneously to cover the largest possible volume, always taking the distribution of mass in the atmosphere into account. The FLEXPART model imposes a condition on the mass, which must be constant. The mass takes into account the volume and the density of the air. We use 61 levels in the atmosphere, from 1000 to 0.1 hPa, so the volume of the air parcel varies in accordance with the level concerned: a volume is thus smaller near the surface and larger higher up because the air density is greater near the surface and lower at high altitudes. These particles are then moved using the reanalysis wind field, and in ad-dition turbulence and convection parametrizations are taken in account, always maintaining the consistency of the atmo-spheric mass distribution (Stohl et al., 1998, 2005). The me-teorological properties of the air parcels, such as specific hu-midity or temperature among many others, are retained in the outputs of the FLEXPART model, taking into account the ERA-Interim reanalysis input.
The changes in specific humidity (dq) of a particle (with massm) over time (dt) during its trajectory can be expressed as (Eq. 2)
e−p=mdq
dt, (2)
where (e−p) can be inferred as the freshwater flux in the parcel (the difference between evaporation and precipita-tion).
The moisture changes (e−p) of all the particles in the at-mospheric column over a specified area (A) yield the surface freshwater flux (E−P), whereEis the evaporation rate per unit area andP is the precipitation rate per unit area (Eq. 3):
E−P ≈
K
P
k=1
(e−p)
A , (3)
whereKis the total number of particles in the atmospheric column. Each particle is tracked backwards for a transport time of 10 days, this being the average residence time of wa-ter vapour in the atmosphere (Numaguti, 1999).
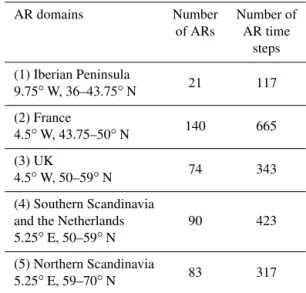
Table 2.The newly defined atmospheric river landfall domains and the corresponding number of atmospheric rivers and the respective number of time steps.
AR domains Number Number of
of ARs AR time steps
(1) Iberian Peninsula
21 117
9.75◦W, 36–43.75◦N
(2) France
140 665
4.5◦W, 43.75–50◦N
(3) UK
74 343
4.5◦W, 50–59◦N
(4) Southern Scandinavia
90 423
and the Netherlands 5.25◦E, 50–59◦N
(5) Northern Scandinavia
83 317
5.25◦E, 59–70◦N
The different areas where the ARs make landfall are dis-cussed in Sect. 3, while the selection of each European do-main where the particles are selected for the backward tra-jectory (E−P) analyses will be discussed in Sect. 4.
3 Landfall of atmospheric rivers in Europe
The number of ARs for each domain is summarized in Ta-ble 1. There were 271 ARs for reference meridian 1, with a maximum of 87 ARs in the 45–55◦N sector; for
refer-ence meridian 2 the total number is 351, with a maximum of 98 ARs observed at latitudes between 55 and 65◦
N. In the case of reference meridian 3 and given that the ARs come from the Atlantic region, we divided the reference meridian into two sectors (50 to 60◦
N and 60 to 70◦
N), with the max-imum number of ARs being recorded in the 50–60◦
N sec-tors (100 ARs). The IVT threshold has a maximum around 45 and 55◦
N for the reference meridians, in good agreement with the results obtained by Lavers and Villarini (2013) near 10◦
W. In addition, this maximum is also confirmed by the analysis of the seasonal IVT mean fields, where a maximum is present between 45 and 55◦
N (not shown).
The number of ARs and the corresponding AR time steps for each new domain are shown in Table 2 and will be anal-ysed in detail in Sect. 4. This varies from 21 ARs (117 time steps) in the Iberian Peninsula domain up to 140 ARs (665 time steps) in the France domain.
This assessment of ARs for the different reference merid-ians confirms the findings of Lavers and Villarini (2013) that the ARs also strike regions of Europe other than the Iberian Peninsula (Ramos et al., 2015) or the UK (Lavers et al., 2011). In this regard, we are confident that the use of three different meridians of control (9.75 and 4.5◦
W, 5.25◦
pro-Figure 2.The median position (coloured line) and the respective 90th and 10th percentiles (dashed lines) of the atmospheric river path along the North Atlantic Ocean before arriving in each studied domain:(a)Iberian Peninsula (red),(b)France (blue) and the UK (green), and (c)southern Scandinavia and the Netherlands (yellow) and northern Scandinavia (purple).
vides a more precise and robust assessment of all the ARs that make landfall in Europe.
While it can be argued that the overall frequency of ARs is rather low, in fact we are particularly interested in analysing tracking and the anomalous moisture sources for the most intense ARs, i.e. those ARs that are often associated with extreme precipitation events. It has been shown that a large proportion of the most intense precipitation events (and of course their associated floods) in western Europe are objec-tively associated with the occurrence of ARs, both in the UK (Lavers et al., 2013) and in the Iberian Peninsula (Ramos et al., 2015). In particular, Lavers and Villarini (2013) showed in their Fig. 3 the number of top-10 annual maximum events related to ARs. It is immediately striking that some areas of the Iberian Peninsula, France, the UK, and Norway have up to 6 out of 10 top annual maxima associated with ARs. In ad-dition, Ramos et al. (2015) for the Iberian Peninsula showed that ARs play an overwhelming role in the most extreme pre-cipitation days, but these decrease in importance for less ex-treme precipitation days.
The refinements made to the detection scheme for ARs (in the use of three reference meridians regrouped into five sub-domains in terms of their geographical relevance), as intro-duced by Lavers et al. (2012), were intended to improve AR detection and allow us to obtain more precise locations for AR landfalls. To analyse whether these refinements actually
improve AR detection, the number of top-10 annual max-ima precipitation events (for the extended winter months, i.e. ONDJFM) related to ARs was computed. To this end, the annual maxima were computed for each calendar year (only for the extended winter months) from 1979 to 2012 at each grid point (E-OBS, at 0.25◦
resolution; Haylock et al., 2008). The results obtained (Fig. S1 in the Supplement) show that there is an improvement in the relationship between ARs and annual maxima for France, Belgium, Germany, and the Scandinavian countries compared to the results of Lavers and Villarini (2013) in their Fig. 3.
In order to track the path of the ARs, we computed the maximum longitudinal IVT for each AR, in order to obtain a preliminary estimate of the position of the ARs in the North Atlantic Ocean. For each new domain, we computed the me-dian, 90th percentile, and 10th percentile of the maximum IVT positions of the different ARs along their first-guess tra-jectories, and the results are presented in Fig. 2. The use of the 90th and 10th percentiles allows us to visualize the spread of the positions of the vast majority of the ARs throughout the North Atlantic basin associated with each domain.
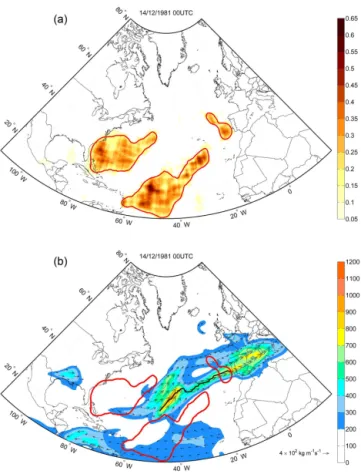
Figure 3. (a) The moisture sources (E−P >0) computed for 10 days for an AR making landfall in the Iberian Peninsula on 14 December 1981 at 00:00 UTC.(b)The vertically integrated hor-izontal water vapour transport (IVT) field for 14 December 1981 at 00:00 UTC and the location of the IVT maxima (black line). The moisture sources detected in(a)are also plotted using red contours.
al. (2015), where a positive anomaly of sea level pressure is found to the south of Portugal when the ARs make landfall in the Iberian Peninsula.
In the cases of France and the UK (Fig. 2b), the paths and dispersions are similar with respect to the median path of the ARs, especially on the eastern North Atlantic. The main dif-ferences are closer to the two domains, namely (1) a more zonal path associated with the France domain, while for the UK its path near the reference meridian is clearly more SW– NE oriented, and (2) the dispersion of the AR paths is higher for the UK domain than for the France domain, particularly to the west of 40◦W. The results for the UK confirm those
obtained by Lavers et al. (2011), although here we have used the full climatology, whereas Lavers et al. (2011) only anal-ysed the AR paths for selected cases. Concerning the last two domains (Fig. 2c), the results are very similar to those ob-tained for the France and UK domains; i.e. most ARs show a strong SW–NE orientation, particularly to the east of 40◦
W for those ARs that arrive in the northern Scandinavian do-main. In addition, the dispersion of the paths in these two
domains is relatively high compared with the other three do-mains.
These five new domains (Fig. 1) are those that will be used in the computation of the moisture transport for the ARs that make landfall over the western coasts of the European do-mains analysed.
4 Atmospheric rivers and anomalous moisture uptake
The use of the IVT is an effective Eulerian approach for studying the temporal variability of moisture flows for spe-cific locations around the globe and is therefore widely used in the identification of ARs. However, this Eulerian perspec-tive is not suitable for finding sources of moisture, and of course it is impossible to use it to compute where the up-take of moisture to the AR is, given that the method is not able to follow any specific “particle” transported by the ARs. To illustrate the difference between the use of the IVT and the information that can be extracted from FLEXPART, we provide in Fig. 3 an example of a particular AR that oc-curred on 14 December 1981 at 00:00 UTC, which reached the Iberian Peninsula. Figure 3a shows the sources of mois-ture (E−P)>0 computed for 10 days back in time (reddish colours). Three areas clearly emerge as sources: one located to the west of the Iberian Peninsula near the coast, and two larger ones located in the central and western Atlantic. In Fig. 3b we show the IVT field for the same day and the max-imum edge of the IVT denoted by a black line and used in this study to detect ARs, together with a red contour delimit-ing the sources of moisture in Fig. 3a. It can clearly be seen that the moisture sources and the IVT maximum are not coin-cident. When we analyse either the IVT maximum or the IVT field, we only reveal a snapshot of the integrated horizontal flux transport for that specific time step, not the path of the air masses. This indicates neither where the moisture comes from nor where the moisture uptake is anomalous during the previous days of the AR, which is one of the objectives of this analysis.
Table 3.(E−P) backward trajectories regions where the compu-tation is made for all the air parcels inside it.
ARs domains Longitude and latitude limits
(1) Iberian Peninsula 9.75–4.75◦W, 36–43.75◦N
(2) France 4.5◦W–0.5◦E, 43.75–50◦N
(3) UK 4.5◦W–0.5◦E, 50–59◦N (4) Southern Scandinavia
5.25–10.25◦E, 50–59◦N
and the Netherlands
(5) Northern Scandinavia 5.25–10.25◦E, 59–70◦N
the Atlantic European coast for all the systems detected and from a climatological point of view. It is important to note that an AR transports a large amount of moisture that often reaches a continental area. This moisture must necessarily be available for transport in the atmosphere. Therefore, it must be evaporated and accumulated in certain areas during the days prior to the intense track of the AR. The existence of an intense flux is important but not sufficient, in that an intense anomalous quantity of moisture must be available for the AR to occur. Therefore, in this research we detect (for the 10 days prior to the AR reaching landfall) where the moisture uptake to the atmosphere is anomalous.
The backward trajectory analyses were performed for air particles residing over the area 5◦
to the west of the AR detection meridian reference (Table 3): e.g. for the Iberian Peninsula region it included particles located inside a rect-angle (covering an area between 9.75 and 4.75◦W and from
36 to 43.75◦N) and tracked backwards for 10 days at 6 h
in-tervals (a total of 40 time steps).
We computed the uptake of moisture for all individual ARs at all time steps, retaining only positive values of (E−P) every 6 h during the 10-day back trajectories (40 time steps). For instance, there are 117 cases for the Iberian Peninsula, so we computed 117 fields of (E−P)>0, and the same for the other domains. To check whether these areas (where the ARs take on moisture) differ from the climatology, we computed for each AR the anomaly between (E−P)>0 of the ARs and the “climatology” for the corresponding AR dates. The climatology at this point corresponded to the same (Julian) time step but for all 33 years of the study (retain-ing again only the positive values of (E−P) for each 6 h time step). For the example given in Fig. 3, if an AR ex-isted on 14 December 1981 at 00:00 UTC, we computed the anomaly between (a) (E−P >0) on 14 December 1981 at 00:00 UTC and (b) (E−P)>0 for all time steps of 14 De-cember 00:00 UTC, in other words, (E−P)>0 for the cor-responding day for the 33 years of the entire period. We then computed the anomaly for this particular case (14 De-cember 1981 00:00 UTC) using the difference between (b) and (a). The climatology and the anomaly for each domain, denoted by (E−P)Cli>0 and (E−P)An>0 in Fig. 4,
cor-respond to the mean values for all the respective ARs. A
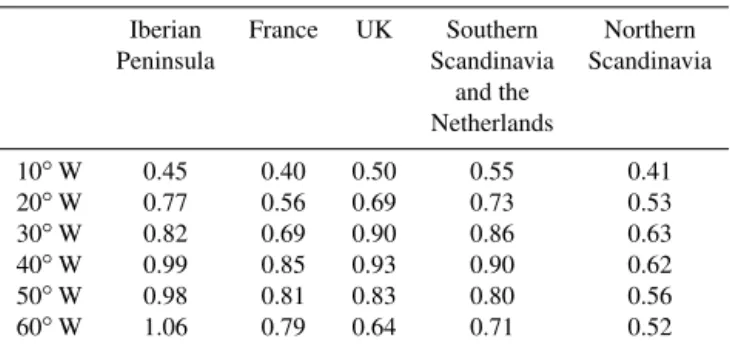
rep-Table 4.90th percentile for the anomaly values of the (E−P)>0 field [(E−P)An] for each studied domain and longitude (in
mm day−1).
Iberian France UK Southern Northern Peninsula Scandinavia Scandinavia
and the Netherlands
10◦W 0.45 0.40 0.50 0.55 0.41 20◦W 0.77 0.56 0.69 0.73 0.53 30◦W 0.82 0.69 0.90 0.86 0.63 40◦W 0.99 0.85 0.93 0.90 0.62 50◦W 0.98 0.81 0.83 0.80 0.56 60◦W 1.06 0.79 0.64 0.71 0.52
resentation of the fields of (E−P)Cli>0 and (E−P)An>0
for all the five regions studied is provided in Fig. 4 (left panel and right panel, respectively). Moreover, the anoma-lous moisture of the sources is only shown for the areas that are statistically significant at the 90 % level, applying a Stu-dentttest to the (E−P)>0 for all the ARs and the climatol-ogy (Table 4). In general, for all regions the major anomalous uptake of moisture (hereafter AUM) extends along the sub-tropical north Atlantic (from the Tropic of Cancer to 35◦
N according to the definition of the American Meteorological Society), from the Gulf Stream Current, just off the Florida Peninsula (to the north of 20◦
N), to each sink region, being further to the south (clearly subtropical) in the western basin of the North Atlantic Ocean and reaching extra-tropical lati-tudes on the eastern basin coast. Moreover, the nearest coast to each sink region always appears as a local maximum of AUM (e.g. see the southern Iberian Peninsula coast or the Bay of Biscay in France). The Norwegian Sea acts as a more important AUM because the region analysed is located at higher latitudes and is a maximum for the northern Scandi-navia region.
The distribution of the particle density used to compute the AUM (using a 5◦
by 5◦
grid cell) for each domain was also computed. Figure S2 shows how many times a parcel (in percentage terms) contributes to the (E−P)An>0 field.
In addition, one must be aware that the areas of maximum density of the parcels may (or may not) correspond to areas of maximum anomalies and vice versa, because a grid cell can contribute many times, but its AUM contribution could be less than that of others with a lower AUM density.
Figure 4.For each studied sink domain (Iberian Peninsula, France, UK, southern Scandinavia and the Netherlands, and northern Scandinavia) for wintertime from 1979 to 2012. Left panels: mean value of the (E−P)>0 field [(E−P)Cli], backward integrated over a 10-day period.
Right panels: (E−P)>0 anomaly field for AR days [(E−P)An]. Units in mm day−1. Regarding the anomaly fields, only the results that
Figure 5.Longitudinal cross section of the anomaly values of (E−P)>0 field [(E−P)An] for each studied domain: Iberian Peninsula
(red line), France (blue), UK (green), southern Scandinavia and the Netherlands (yellow), and northern Scandinavia (purple). The bold line shows those values over the 90th percentile of each series (values shown in Table 4). Units in mm day−1. The Tropic of Cancer parallel (23.43◦N) and the 35◦N parallel are also shown.
regions also found similar results, for instance Gimeno et al. (2010b) and Drumond et al. (2011) for the Iberian Penin-sula, or studies of European regions at higher latitudes (Nieto et al., 2007; Sodemann et al., 2008) revealed the importance of the Atlantic source. Interestingly, in almost all these stud-ies the authors pointed to the effects of ARs as the major moisture transport mechanism from the subtropical Atlantic. In this work, the key novelty is that we show those regions where the moisture uptake is anomalous and significant when an AR occurs.
We are particularly interested in understanding which gions with higher AUM (depicted in Fig. 4, left panel) are re-inforced during ARs associated with each of the five different domains. These reinforced sectors are identified in yellow-ish and reddyellow-ish colours in maps of (E−P)An (Fig. 4, right
panel). Overall, the largest anomalies are detected in the mid-dle of the North Atlantic, between 20 and 40◦
N, with a slight northward movement when the sink region is positioned at higher latitudes. These results confirm that part of the ex-cess of moisture transported by ARs vs. the climatology comes from tropical latitudes (south of the Tropic of Cancer, 23.43◦
N), but the bulk of the additional amount provided by the ARs is obtained from subtropical ocean areas (i.e. those between the Tropic of Cancer and 35◦
N). The most notable anomaly is detected for the Iberian Peninsula, followed by
the southern Scandinavia and the Netherlands domain, and the lowest is for the northern Scandinavia domain. Each do-main shows differences in values of (E−P)An>0 in both
latitude and longitude. To understand these patterns better, we quantified the anomaly values every 10◦
between 70 and 5◦
N and between 10 and 60◦
W.
Figure 5 shows the different latitudinal sections for all the studied regions in which values over the 90th percentile of the anomaly (Table 4) are highlighted using a bold line. We refer to these values to compare the five domains of study. In general, there is a longitudinal southern shift of the anomaly, which is a common feature for all the regions. So for in-stance, for northern Scandinavia (purple line) the anomalous uptake of moisture at 10◦
W occurs mostly between 60 and 48◦
N, while at 60◦
W it occurs predominantly between 40 and 30◦
N; whereas for the Iberian Peninsula (IP, red line) at 10◦
W the anomalous uptake occurs mainly in a band be-tween 43 and 33◦
N, and at 60◦
W it is particularly intense be-tween 36 and 21◦
in-cluded to complement the information given in Fig. 5, albeit showing the same results for each individual domain.
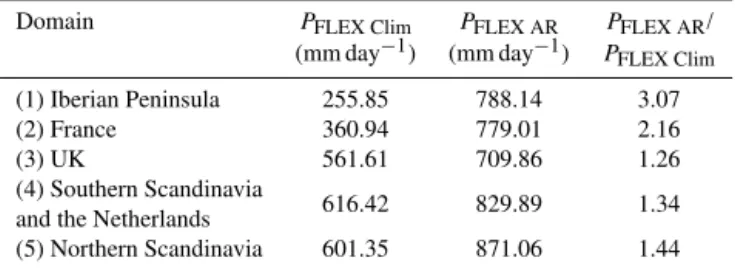
To understand more about the effect of ARs over the Eu-ropean domains, we checked whether those areas with sig-nificant AUM contribute to a sigsig-nificant increase in precipi-tation. Because FLEXPART can be run in forward mode, we looked for the sinks for those air parcels (particles) that leave a particular area, using the AUM regions (those in Fig. 3, right panel) to compute the precipitation (asE−P <0) over each target domain. We computed (E−P)<0 values for the climatological period ((E−P <0)Clim) and only for the AR
days ((E−P <0)AR). The results show that the AUM areas
associated with ARs support sufficient moisture to increase the precipitation (Table 5). The ratio between the climatology and the AR values provides evidence of an increase ranging from 1.26 times as much precipitation in the UK to 3 times more in the Iberian Peninsula.
It is important to place these results in the light of recent works dealing with the origin of moisture in ARs. Sodemann and Stohl (2013) showed that in December 2006 several ARs reached from the subtropics to high latitudes, inducing pre-cipitation over western Scandinavia. The sources and trans-port of water vapour in the North Atlantic storm track dur-ing that month were examined, and they reveal that the ARs were composed of a sequence of meridional excursions of water vapour. Different moisture sources were found: (1) in cyclone cores, the rapid turnover of water vapour by evap-oration and condensation was identified, leading to a rapid assimilation of water from the underlying ocean surface; (2) in the regions of long-range transport, water vapour trac-ers from the southern edges of the midlatitudes and subtrop-ics dominated over local contributions. Our results generalize for all the domains previous findings of Liberato et al. (2012) obtained for a case study for Portugal, confirming the pres-ence of extended source areas that support anomalous mois-ture uptake (tropical and subtropical) for all the domains, with the highest anomalies being found for the Iberian Penin-sula and the UK. Because ARs are always dynamically cou-pled to cyclones, Sodemann and Stohl (2013) also analyse in their study the change in moisture composition in the vicinity of the cyclone responsible for the intense events over western Scandinavia. This fact may be better corroborated in future work by using the long database of ARs for all European coastal domains. In any case, our results also suggest con-tributions from nearby sources of anomalous moisture up-take associated with the ARs. According to Sodemann and Stohl (2013), this may be due to the rapid turnover of water vapour by evaporation and condensation, leading to the rapid assimilation of water from the underlying ocean surface near the cyclone cores.
We acknowledge the scepticism of some authors regarding the far-reaching origin of moisture considered to contribute to the ARs. Dacre et al. (2015) considered a selected number of cases of water vapour transport associated with North At-lantic extra-tropical cyclones in winter. The authors inferred
Table 5.The contribution of the different moisture sources to the precipitation derived from FLEXPART, computed as E−P <0 (PFLEX), over the five analysed domains for the climatological
pe-riod (PFLEX Clim) and for the AR days (PFLEX AR). The ratio
be-tween the two is also shown.
Domain PFLEX Clim PFLEX AR PFLEX AR/
(mm day−1) (mm day−1) P FLEX Clim
(1) Iberian Peninsula 255.85 788.14 3.07
(2) France 360.94 779.01 2.16
(3) UK 561.61 709.86 1.26
(4) Southern Scandinavia
616.42 829.89 1.34
and the Netherlands
(5) Northern Scandinavia 601.35 871.06 1.44
that AR moisture originates mostly from the water vapour in the cyclone’s warm sector, and not that much from the long-distance transport of water vapour from the subtropics. Our long-term (E−P)>0 analysis shows that for the ARs that make landfall on the western European coast the anomalous moisture linked with the ARs comes mainly from subtropical areas and, to a lesser extent, from midlatitudes. In addition, a small anomalous moisture uptake has also been found in the tropical zone. Garaboa-Paz et al. (2015), using Lagrangian coherent structures (LCSs), showed for two AR case studies that the passive advection of water vapour in the AR from tropical latitudes is possible.
5 Conclusions
We have described our innovative study related to the anoma-lous uptake of moisture for ARs that reach different west-ern European domains in the winter half-year (ONDJFM). To achieve this goal, we used an objective AR detection scheme (Lavers et al., 2012; Ramos et al., 2015) that de-pends entirely on the IVT. In order to ensure that the AR detection is performed as close to the coast as possible, this analysis was applied to three different reference meridians (9.75 and 4.50◦
W, 5.25◦
E) divided into 10◦
sectors between 35 and 75◦
N. The use of three different reference meridi-ans represents a refinement to the approach of Lavers and Villarini (2013), who only used the 10◦
W meridian refer-ence. Because we are mostly interested in those ARs that make landfall in western Europe and over land, we regrouped the previously computed ARs (Fig. 1 and Table 1) into the following 5 new domains (Fig. 1): (1) Iberian Peninsula (9.75◦W, 36–43.75◦N); (2) France (4.5◦W, 43.75–50◦N);
(3) the UK (4.5◦
W, 50–59◦
N); (4) southern Scandinavia and the Netherlands (5.25◦
E, 50–59◦
N) and (5) northern Scan-dinavia (5.25◦
E, 59–70◦
N).
The number of ARs found shows a latitudinal dependence, with the highest values being recorded for the three merid-ional references 9.75◦
W, 4.50◦
W, and 5.25◦
E are 45–55◦
N, 35–45◦
N, and 50–60◦
land into the new domains, where the French (140 ARs) and southern Scandinavia and the Netherlands (90 ARs) domains showed the highest values, while the Iberian Peninsula (21) domain recorded the lowest value.
The Lagrangian perspective of this work can help provide additional input regarding the effective moisture sources as-sociated with most of the ARs that reach Europe. To achieve this objective, we detected those areas where the moisture uptake to the atmosphere occurs in an anomalous way. The computation of positive values of (E−P) every 6 h for each AR for 10 days of transport was undertaken, taking into ac-count the air particles residing over the area 5◦
W of the AR detection meridian reference mentioned above and shown in Table 3. This amount was computed for all the ARs that reached a continental domain and was compared with the cli-matology. We have therefore shown in this paper the anoma-lous uptake of moisture areas for the ARs.
The near-surface wind speed and the near-surface atmo-spheric specific humidity, together with the SST, are bound to play a major role in the process of moisture uptake over the oceans (Gimeno et al., 2012). Therefore, despite not analysing the role of sea surface temperature (SST) in the present study, we can nevertheless speculate on the possibil-ity of positive anomalies of SST influencing the interannual variably of the ARs. Future studies of the SST variability and its influence over the ARs should be considered in order to understand this relationship better.
The most important results obtained can be summarized as follows:
– In general, for all the regions, the major AUM areas extend along the subtropical North Atlantic, from the Florida Peninsula (north of 20◦N) to each sink region.
However, the midlatitude also plays an important role, with the coastal area nearest to each sink region always appearing as a local maximum of AUM.
– The Atlantic subtropical AUM source is reinforced dur-ing ARs where the major uptake anomalies are detected in the middle of the North Atlantic, between 20 and 40◦
N, with a slight northward movement when the sink region is positioned at higher latitudes.
– The most notable anomaly of moisture uptake is de-tected for the Iberian Peninsula, followed by the south-ern Scandinavia and the Netherlands domains, with the lowest being for the northern Scandinavia domain.
To conclude, we have shown that the main anomalous up-take of moisture areas associated with the ARs that strike western European coast are located over subtropical lati-tudes. For the southern domains one must be also be aware of the presence of a tropical AUM area. Near the continen-tal sink areas, extra-tropical areas with anomalous uptake of moisture are also apparent, confirming the local transport produced by the nearby ocean.
The Supplement related to this article is available online at doi:10.5194/esd-7-371-2016-supplement.
Acknowledgements. Alexandre M. Ramos was supported through a postdoctoral grant (SFRH/BPD/84328/2012) from the Fundação para a Ciência e a Tecnologia (FCT, Portuguese Science Foundation). This work also was partially supported by FEDER funds through the COMPETE (Programa Operacional Factores de Competitividade) programme and by national funds through the FCT project STORMEx FCOMP-01-0124-FEDER-019524 (PTDC/AAC-CLI/121339/2010). Raquel Nieto acknowledges funding by the Spanish MINECO within project TRAMO and the Galician Regional Government (Xunta) within project THIS, both co-funded by FEDER.
Edited by: K. Thonicke
References
Bao, J-W., Michelson, S. A., Neiman, P. J., Ralph, F. M., and Wilczak, J. M.: Interpretation of enhanced integrated water va-por bands associated with extratropical cyclones: Their forma-tion and connecforma-tion to tropical moisture, Mon. Weather Rev., 134, 1063–1080, 2006.
Castillo, R., Nieto R., Drumond, A., and Gimeno, L.: Estimating the temporal domain when the discount of the net evaporation term affects the resulting net precipitation pattern in the moisture budget using a 3-D Lagrangian approach, PLoS ONE, 9, e99046, doi:10.1371/journal.pone.0099046, 2014.
Couto, F. T., Salgado, R., and Costa, M. J.: Analysis of intense rain-fall events on Madeira Island during the 2009/2010 winter, Nat. Hazards Earth Syst. Sci., 12, 2225–2240, doi:10.5194/nhess-12-2225-2012, 2012.
Couto, F. T., Salgado, R., Costa, M. J., and Prior, V.: Precipitation in the Madeira Is- land over a 10-year period and the meridional water vapour transport during the winter seasons, Int. J. Clima-tol., 35, 3748–3759, doi:10.1002/joc.4243, 2015.
Dacre, H., Clark, P., Martinez-Alvarado, O., Stringer, M., and Lavers, D.: How do atmospheric rivers form?, B. Am. Meteorol. Soc., 96, 1243–1255, doi:10.1175/BAMS-D-14-00031.1, 2015. Dee, D. P., Uppala, S. M., Simmons, A. J., et al.: The ERA-Interim
reanalysis: configuration and performance of the data assimila-tion system, Q. J. Roy. Meteorol. Soc., 137, 553–597, 2011. Dettinger, M., Ralph, F. M., Das, T., Neiman, P. J., and Cayan, D.
R.: Atmospheric Rivers, Floods and the Water Resources of Cal-ifornia, Water, 3, 445–478, 2011.
Dettinger, M., Ralph, F. M., and Lavers, D.: Setting the stage for a global science of atmospheric rivers, Eos, 96, doi:10.1029/2015EO038675, 2015.
Drumond, A., Gimeno, L., and Nieto, R.: On the contribu-tion of the Tropical Western Hemisphere Warm Pool source of moisture to the northern hemisphere precipitation through a lagrangian approach, J. Geophys. Res., 116, D00Q04, doi:10.1029/2010JD015397, 2011.
Garaboa-Paz, D., Eiras-Barca, J., Huhn, F., and Pérez-Muñuzuri, V.: Lagrangian coherent structures along atmospheric rivers, Chaos, 25, 063105, doi:10.1063/1.4919768, 2015.
Gimeno, L., Drumond, A., Nieto, R., Trigo, R. M., and Stohl, A.: On the origin of continental precipitation, Geophys. Res. Lett., 37, L13804, doi:10.1029/2010GL043712, 2010a.
Gimeno, L., Nieto, R., Trigo, R. M., Vicente, S., and Lopez-Moreno, J. I.: Where does the Iberian Peninsula moisture come from? An answer based on a Largrangian approach, J. Hydrom-eteorol., 11, 421–436, doi:10.1175/2009JHM1182.1, 2010b. Gimeno, L., Stohl, A., Trigo, R. M., Domínguez, F., Yoshimura,
K., Yu, L., Drumond, A., Durán-Quesada, A. M., and Nieto, R.: Oceanic and Terrestrial Sources of Continental Precipitation, Rev. Geophys., 50, RG4003, doi:10.1029/2012RG000389, 2012. Gimeno, L., Nieto, R., Vázquez, M., and Lavers, D. A.: Atmospheric rivers: a mini-review, Front. Earth Sci., 2, doi:10.3389/feart.2014.00002, 2014.
Haylock, M. R., Hofstra, N., Klein Tank, A. M. G., Klok, E. J., Jones, P. D., and New, M.: A European daily high-resolution gridded data set of surface temperature and pre-cipitation for 1950–2006, J. Geophys. Res., 113, D20119, doi:10.1029/2008JD010201, 2008.
Knippertz, P. and Wernli, H.: A Lagrangian Climatology of Tropical Moisture Exports to the Northern Hemispheric Extratropics, J. Climate, 23, 987–1003, 2010.
Lavers, D. A. and Villarini, G.: The nexus between atmospheric rivers and extreme precipitation across Europe, Geophys. Res. Lett., 40, 3259–3264, 2013.
Lavers, D. A., Allan, R. P., Wood, E. F., Villarini, G., Brayshaw, D. J., and Wade, A. J.: Winter floods in Britain are con-nected to atmospheric rivers, Geophys. Res. Lett., 38, L23803, doi:10.1029/2011GL049783, 2011.
Lavers, D. A., Villarini, G., Allan, R. P., Wood, E. F., and Wade, A. J.: The detection of atmospheric rivers in atmospheric re-analyses and their links to British winter floods and the large-scale climatic circulation, J. Geophys. Res., 117, D20106, doi:10.1029/2012JD018027, 2012.
Liberato, M. L. R., Ramos, A. M., Trigo, R. M., Trigo, I. F., Durán-Quesada, A. M., Nieto, R., and Gimeno, L.: Moisture Sources and Large-Scale Dynamics Associated With a Flash Flood Event, in: Lagrangian Modeling of the Atmosphere, edited by: Lin, J., Brunner, D., Gerbig, C., Stohl, A., Luhar, A., and Webley, P., American Geophysical Union, Washington, D.C., doi:10.1029/2012GM001244, 2012.
Moore, B. J., Neiman, P. J., Ralph, F. M., and Barthold, F. E.: Physical processes associated with heavy flooding rainfall in Nashville, Tennessee, and vicinity during 1–2 May 2010: The role of an atmospheric river and mesoscale convective systems, Mon. Weather Rev., 140, 358–378, 2012.
Neiman, P. J., Ralph, F. M., Wick, G. A., Lundquist, J. D., and Det-tinger, M. D.: Meteorological characteristics and overland pre-cipitation impacts of atmospheric rivers affecting the West Coast of North America based on eight years of SSM/I satellite obser-vations, J. Hydrometeorol., 9, 22–47, 2008.
Nieto, R., Gimeno, L., Gallego, D., and Trigo, R. M.: Identifica-tion of major sources of moisture and precipitaIdentifica-tion over Iceland, Meteorol. Zeit., 16, 37–44, 2007.
Numaguti, A.: Origin and recycling processes of precipitating water over the Eurasian continent: Experiments using an atmospheric general circulation model, J. Geophys. Res., 104, 1957–1972, 1999.
Ralph, F. M. and Dettinger, M. D.: Storms, floods, and the science of atmospheric rivers, Eos Trans. AGU, 92, 265, 2011.
Ralph, F. M., Neiman, P. J., and Wick, G. A.: Satellite and CALJET aircraft observations of atmospheric rivers over the eastern North Pacific Ocean during the winter of 1997/98, Mon. Weather Rev., 132, 1721–1745, 2004.
Ralph, F. M., Neiman, P. J., and Rotunno, R.: Dropsonde Obser-vations in Low-Level Jets Over the Northeastern Pacific Ocean from CALJET-1998 and PACJET-2001: Mean Vertical-Profile and Atmospheric-River Characteristics, Mon. Weather Rev., 133, 889–910, doi:10.1175/MWR2896.1, 2005.
Ralph, F. M., Coleman, T., Neiman, P. J., Zamora, R. J., Det-tinger, M. D.: Observed Impacts of Duration and Seasonality of Atmospheric-River Landfalls on Soil Moisture and Runoff in Coastal Northern California, J. Hydrometeorol., 14, 443–459, 2013.
Ramos, A. M., Trigo, R. M., Liberato, M. L. R., and Tome, R.: Daily precipitation extreme events in the Iberian Peninsula and its association with Atmospheric Rivers, J. Hydrometeorol., 16, 579–597, doi:10.1175/JHM-D-14-0103.1, 2015.
Rutz, J. J., Steenburgh, W. J., and Ralph, F. M.: The Inland Penetra-tion of Atmospheric Rivers over Western North America: A La-grangian Analysis, Mon. Weather Rev., 143, 1924–1944, 2015. Ryoo, J.-M., Waliser, D. E., Waugh, D. W., Wong, S., Fetzer, E.
J., and Fung, I.: Classification of atmospheric river events on the U.S. West Coast using a trajectory model, J. Geophys. Res.-Atmos., 120, 3007–3028, doi:10.1002/2014JD022023, 2015. Sodemann, H. and Stohl, A.: Moisture Origin and Meridional
Transport in Atmospheric Rivers and Their Association with Multiple Cyclones, Mon. Weather Rev., 141, 2850–2868, 2013. Sodemann, H., Schwierz, C., and Wernli, H.: Interannual variability
of Greenland winter precipitation sources: Lagrangian moisture diagnostic and North Atlantic Oscillation influence, J. Geophys. Res., 113, D03107, doi:10.1029/2007JD008503, 2008.
Stohl, A. and James, P. A.: Lagrangian Analysis of the atmospheric branch of the global water cycle. Part I: Method description, val-idation, and demonstration for the August 2002 flooding in Cen-tral Europe, J. Hydrometeorol., 5, 656–678, 2004.
Stohl, A., Hittenberger, M., and Wotawa, G.: Validation of the La-grangian particle dispersion model FLEXPART against large-scale tracer experiment data, Atmos. Environ., 32, 4245–4264, 1998.
Stohl, A., Forster, C., Frank, A., Seibert, P., and Wotawa, G.: Technical note: The Lagrangian particle dispersion model FLEXPART version 6.2, Atmos. Chem. Phys., 5, 2461–2474, doi:10.5194/acp-5-2461-2005, 2005.
Stohl, A., Forster, C., and Sodemann, C.: Remote sources of wa-ter vapor forming precipitation on the Norwegian west coast at 60◦N: A tale of hurricanes and an atmospheric river, J. Geophys.
Trigo, R. M., Varino, F., Ramos, A. M., Valente, M. A., Zêzere, J. L., Vaquero, J. M., Gouveia, C. M., and Russo, A.: The record precipitation and flood event in Iberia in Decem-ber 1876: description and synoptic analysis, Front. Earth Sci., 2, doi:10.3389/feart.2014.00003, 2014.


![Figure 5. Longitudinal cross section of the anomaly values of (E − P ) > 0 field [(E − P ) An ] for each studied domain: Iberian Peninsula (red line), France (blue), UK (green), southern Scandinavia and the Netherlands (yellow), and northern Scandinavia](https://thumb-eu.123doks.com/thumbv2/123dok_br/18279726.345463/10.918.148.764.115.528/longitudinal-iberian-peninsula-southern-scandinavia-netherlands-northern-scandinavia.webp)