A New Pharmacogenetic Algorithm to Predict
the Most Appropriate Dosage of
Acenocoumarol for Stable Anticoagulation in
a Mixed Spanish Population
Hoi Y. Tong1☯, Cristina Lucía Dávila-Fajardo2☯, Alberto M. Borobia1,4☯ *, Luis Javier Martínez-González3☯, Rubin Lubomirov4☯, Laura María Perea León2☯, María J. Blanco Bañares5☯, Xando Díaz-Villamarín2☯, Carmen Fernández-Capitán6☯,
José Cabeza Barrera2☯, Antonio J. Carcas1,4☯*, PGX-ACE Investigators Group¶
1Department of Clinical Pharmacology, La Paz University Hospital, IdiPAZ, Madrid, Spain,2Department of Clinical Pharmacy, San Cecilio University Hospital, Institute for Biomedical Research, Ibs, Granada, Spain, 3Genomics Unit, Centre for Genomics and Oncological Research (GENYO), Pfizer-University of Granada-Andalusian Regional Government, Health Sciences Technology Park, PTS, Granada, Spain,4Department of Pharmacology, School of Medicine, Autonomous University of Madrid, IdiPAZ, Madrid, Spain,
5Department of Hematology, La Paz University Hospital, Madrid, Spain,6Department of Internal Medicine, La Paz University Hospital, IdiPAZ, Madrid, Spain
☯These authors contributed equally to this work.
¶ Membership of the PGX-ACE Investigators Group is listed inS1 Appendix.
*[email protected](AJC);[email protected](AMB)
Abstract
There is a strong association between genetic polymorphisms and the acenocoumarol dos-age requirements. Genotyping the polymorphisms involved in the pharmacokinetics and pharmacodynamics of acenocoumarol before starting anticoagulant therapy would result in a better quality of life and a more efficient use of healthcare resources. The objective of this study is to develop a new algorithm that includes clinical and genetic variables to predict the most appropriate acenocoumarol dosage for stable anticoagulation in a wide range of patients. We recruited 685 patients from 2 Spanish hospitals and 1 primary healthcare cen-ter. We randomly chose 80% of the patients (n = 556), considering an equitable distribution of genotypes to form the generation cohort. The remaining 20% (n = 129) formed the valida-tion cohort. Multiple linear regression was used to generate the algorithm using the aceno-coumarol stable dosage as the dependent variable and the clinical and genotypic variables as the independent variables. The variables included in the algorithm were age, weight, amiodarone use, enzyme inducer status, international normalized ratio target range and the presence ofCYP2C9*2(rs1799853),CYP2C9*3(rs1057910),VKORC1(rs9923231) and CYP4F2(rs2108622). The coefficient of determination (R2) explained by the algorithm was
52.8% in the generation cohort and 64% in the validation cohort. The following R2values were evaluated by pathology: atrial fibrillation, 57.4%; valve replacement, 56.3%; and venous thromboembolic disease, 51.5%. When the patients were classified into 3 dosage groups according to the stable dosage (<11 mg/week, 11–21 mg/week,>21 mg/week), the
percentage of correctly classified patients was higher in the intermediate group, whereas
OPEN ACCESS
Citation:Tong HY, Dávila-Fajardo CL, Borobia AM, Martínez-González LJ, Lubomirov R, Perea León LM, et al. (2016) A New Pharmacogenetic Algorithm to Predict the Most Appropriate Dosage of
Acenocoumarol for Stable Anticoagulation in a Mixed Spanish Population. PLoS ONE 11(3): e0150456. doi:10.1371/journal.pone.0150456
Editor:Masaru Katoh, National Cancer Center, JAPAN
Received:September 10, 2015
Accepted:February 15, 2016
Published:March 15, 2016
Copyright:© 2016 Tong et al. This is an open access article distributed under the terms of the
Creative Commons Attribution License, which permits unrestricted use, distribution, and reproduction in any medium, provided the original author and source are credited.
Data Availability Statement:All relevant data are within the paper and its Supporting Information files.
differences between pharmacogenetic and clinical algorithms increased in the extreme dos-age groups. Our algorithm could improve acenocoumarol dosdos-age selection for patients who will begin treatment with this drug, especially in extreme-dosage patients. The predictability of the pharmacogenetic algorithm did not vary significantly between diseases.
Introduction
Despite the development of new oral anticoagulants, coumarins are still the most widely used anticoagulants for treating and preventing thromboembolism. Warfarin is the most frequently prescribed coumarin worldwide, although acenocoumarol and phenprocoumon are preferen-tially used in some countries. Although these vitamin K antagonists are effective for preventing cardioembolic stroke, myocardial infarction and venous thrombosis, they double the incidence of hemorrhage, and this risk is particularly high during the first month of therapy [1]. Accurate dosing of coumarin anticoagulants is challenging due to the wide interindividual and intraindi-vidual variability in the dosage necessary to achieve stable anticoagulation.
In the last decade, the identification of genetic variants influencing the metabolism of cou-marins led to the publication of numerous articles focused on the potential of pharmacogenetic information to personalize therapy and to anticipate the best therapeutic dosage for patients starting coumarin treatment. Thus, the use of dosing algorithms that include genetic and non-genetic factors has been the most common strategy for predicting the most appropriate dosage of antivitamin-K oral anticoagulants [2–7].
A wide variety of studies, including several genome-wide association studies (GWAS), have identified the primary genetic variants that influence warfarin and acenocoumarol dosing [8–
14]. Patients with variant alleles ofCYP2C9, the primary enzyme that metabolizes S-warfarin and S-acenocoumarol, require reduced dosages compared with those having wild-type alleles. Warfarin and acenocoumarol dosing variability is also attributable to genetic polymorphisms in vitamin K 2,3 epoxide reductase complex 1 (VKORC1). In addition, a subsequent finding revealed thatCYP4F2genetic variants were associated with a clinically relevant effect on warfa-rin requirements in the Caucasian population [13].
To obtain personalized warfarin dosages, several models have been developed that include these genetic variants and demographic and clinical factors for various patient populations. These algorithms explain approximately 51–59% of the variation in warfarin doses [4,15–17]. Although warfarin and acenocoumarol are very similar, they differ in their pharmacokinetic and pharmacodynamic characteristics and their genetic influence. Warfarin algorithms cannot therefore be applied to acenocoumarol [18].
To date, a number of algorithms have also been published for acenocoumarol in diverse populations. Verde et al. constructed an‘‘acenocoumarol-dose genotype score”based on the number of alleles associated with a higher acenocoumarol dosage taken by each participant for each polymorphism [19]. Two algorithms have been published for Indian populations, which include demographic, clinical and genetic variants, and have obtained coefficients of determi-nations of 41% and 61.5%, respectively [20,21]. In addition, 3 other algorithms have been developed for European populations. The first algorithm, designed for a mixed population, was published by the European Pharmacogenetics of Anticoagulant Therapy (EU-PACT) study group and includesCYP2C9andVKORC1polymorphisms and clinical variables (age, sex, weight, height and amiodarone use). When applied to the EU-PACT cohort, this algorithm explained 52.6% of the dosage variance, whereas the nongenotype algorithm explained 23.7% [22]. Another algorithm was developed by our group (La Paz University Hospital, LPUH) for a cohort of patients with Thromboembolic Venous Disease (TVD) and considers the influence
of clinical variables (age, body mass index [BMI], amiodarone use and enzyme-inducer use) and genetic variations ofCYP2C9,VKORC1,CYP4F2andAPOE. For our entire cohort, this algorithm predicted 56.8% of the dose variance, whereas the clinical factors explained only 19% of the variability [23]. The last algorithm was developed by Cerezo-Manchado et al. in a large cohort of patients undergoing anticoagulation therapy (n = 973) and includes clinical fac-tors (age and BMI) and genetic variants (VKORC1,CYP2C9andCYP4F2polymorphisms). The algorithm explained 50% of the variance in the acenocoumarol dosage, whereas the clinical algorithm explained 16% [24].
The published algorithms differ in the variables included and the variables’weight and show differences in the population and methods used to develop the predictive models. The clinical variables included in the algorithms differ essentially in terms of the inclusion or not of sex or in terms of using weight and height instead of BMI. In addition, a number of algorithms take into account the use of amiodarone and enzyme-inducer drugs while others do not. In terms of the genetic variants, all algorithms includedCYP2C9andVKORC1polymorphisms. CYP4F2is taken into account in a number of algorithms, andAPOEis used only by the LPUH
group.
LPUH algorithm [23] was developed for a well-defined prospective cohort of patients with TVD [Deep Vein Thrombosis (DVT) and Pulmonary Embolism (PE)], whereas the other algo-rithms [22,24] have typically included patient cohorts with various anticoagulation indications (valve replacement [VR], atrial fibrillation [AF] and TVD). The objective of this study is to develop a new algorithm in a larger prospective cohort of patients that would be useful for a wider range of patients.
Materials and Methods
Study design and patients
Written informed consent was obtained from all patients prior to their participation in the study. Ethics approval for this study was obtained from both clinical research ethics commit-tees: LPUH of Madrid and San Cecilio University Hospital (SCUH) of Granada, Spain. This was an observational, cross-sectional study. Patients were recruited from the various clinical departments of LPUH of Madrid and SCUH of Granada and a primary health care center (PHCC) belonging to LPUH. Participants included 685 patients who were treated according to the disease in the various departments of the 2 hospitals and the PHCC. Inclusion criteria included acenocoumarol anticoagulation for AF or TVD with a target INR of 2–3, and VR or other diseases (OD) requiring anticoagulation, with a target INR of 2.5–3.5. The participants were taking a stable dosage of acenocoumarol, defined as a weekly dose variation of<20% in
the last 3 consecutive months and an INR within 2–3 (AF and TVD) and 2.5–3.5 (VR and OD) for at least the last 3 consecutive months. Exclusion criteria included renal (estimated creati-nine clearance30 mL/min) and hepatic (Child-Plough stage) impairment, thyroid dysfunc-tion and cancer.
The INR was measured according to the technique used in each recruiting center; all centers have quality certifications with external controls. In LPUH the analysis was performed using a semiautomated Thrombotrack1CoaguLometer (Baxter) with Thrombotest reagents. SCUH used the microINR from iLine microsystems, and PHCC used a portable INRatio (Grifols) coagulometer.
Data collection and genotyping
range. Blood samples were collected in tubes containing ethylenediaminetetraacetic acid (LPUH) and samples of buccal mucosa cells (SCUH) and stored at -20°C. For DNA extraction, the QuickGene DNA blood kit S (Fujifilm, Düsseldorf, Germany) was used in LPUH; the DNA extraction procedure in SCUH was performed according to the method previously published by Freeman et al. [25], with a number of modifications described by Gómez-Martín A. et al. [26]. KASPar1(KBiosciences, Hoddesdon, UK), and TaqMan1(Applied Biosystems, Foster City, USA) technologies were used for genotyping. The genotype frequencies were calculated and the distributions tested for Hardy-Weinberg equilibrium.
We randomly chose 80% of the patients (n = 556), considering an equitable genotype distri-bution (CYP2C9,VKORC1andCYP4F2) to form the generation cohort. The remaining 20% (n = 129) formed the validation cohort of the new algorithm.
Statistical analysis
The results for the categorical data were expressed in absolute terms; such as percentages and the comparison between groups were performed using the chi-squared test. The continuous variables were expressed as means and standard deviation (SD) and were compared using Stu-dent´s t-test and ANOVA.
Univariate analyses were performed for each variable (statistically significant P.05); how-ever, those reaching p-values less than 0.1 were included in a multivariate analysis. We ulti-mately chose multiple linear regression by the enter method to generate the algorithm, given the method would be more easily transformable into a useful equation in routine clinical prac-tice. After this process, we selected those variables with p-values consistently below .05 to be included in the pharmacogenetic algorithm. In the case of variables near significant with bio-logical plausibility and previous evidence of association with acenocoumarol dosing, were also included in the algorithm. The dependent variable was the acenocoumarol dosage required (ln-transformed) to obtain a stable target INR range. As independent variables, we included the selected demographic, clinical and genetic variables. To elucidate the contribution of the patients´ demographic and clinical characteristics as currently used in clinical practice, a clini-cal algorithm was designed including only those variables used in the pharmacogenetic algorithm.
The performance of pharmacogenetic and clinical algorithms was evaluated by calculating the coefficient of determination (R2) that represents the variability explained by each model. The accuracy and precision of the model were assessed using the mean error (ME; mean of the differences between the predicted and observed acenocoumarol dosages) and the mean abso-lute error (MAE; mean absoabso-lute difference between the predicted and observed acenocoumarol dosages). The ME and MAE were also calculated as the percentages of the observed acenocou-marol dosage (%ME and %MAE). The ME reflects the accuracy of the prediction, and MAE is an estimate of the model´s precision.
Clinical relevance
To evaluate the clinical relevance of the model, we classified the patients into 3 groups accord-ing to the actual dosage administered: a low-dosage group (<11 mg/week), an
intermediate-dosage group (11–21 mg/week) and a high-dosage group (>21 mg/week). We calculated the
proportion of patients for whom the predicted dosage was within 20% of the actual dosage (considered correctly dosed). We evaluated the predicted dosage by applying the pharmacoge-netic and clinical algorithms.
Results
Demographics
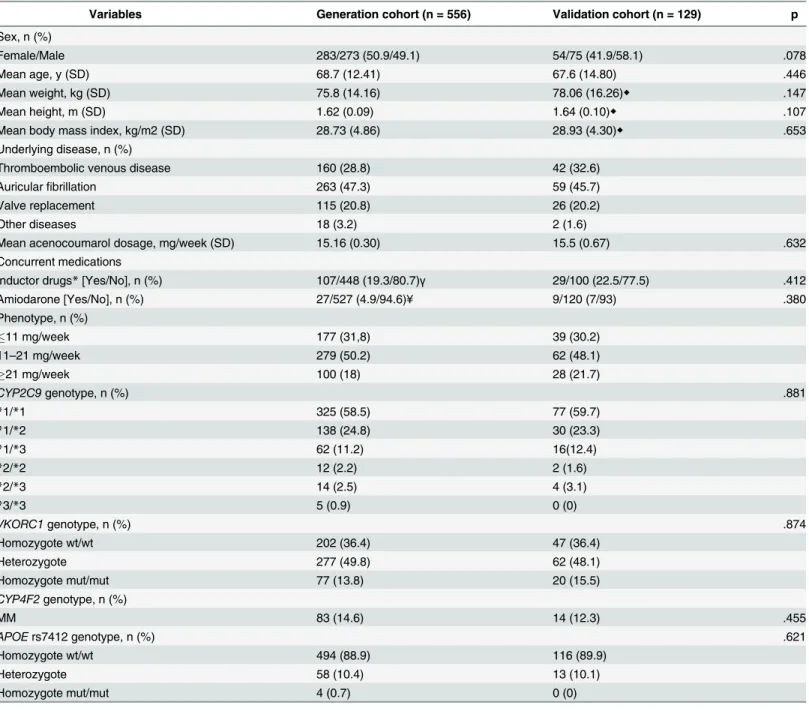
The generation cohort consisted of 556 patients; 283 of whom were women (50.9%); the mean (SD) age was 68.7 (0.53) years. The validation cohort consisted of 129 patients, with a mean age of 67.6 (1.3) years, 54 of whom were women (41.9%). There were missing data in both groups: amiodarone use for 2 patients in the generation cohort and the weight and height in 1 patient in the validation cohort. Excluding the patients with missing data, 554 patients com-prised the generation cohort, and 128 patients comcom-prised the validation cohort. The clinical and demographic features and genotype frequency of both groups are shown inTable 1. The most common disease in our complete cohort was AF (47%) followed by TVD (29.5%). When comparing the patients’features between the various diseases (Table 2), we found that patients with AF were older (72.44 ± 0.5 years) and had higher BMI (29.55 ± 0.27) (p<.001), and the
acenocoumarol dosage (13.49 ± 0.33 mg/week) was significantly lower than that of the other groups (p<.001). Regarding the concomitant medication, this group included more patients
treated with amiodarone (9%) compared with the groups with other diseases (p<.001). There
were no differences in the genotype distribution between the various diseases.
Acenocoumarol dose algorithm
The clinical variables that were ultimately included in the algorithm were age (y), weight (kg), amiodarone use, enzyme inducer status and INR target range (2–3 or 2.5–3.5). The genetic var-iables that remained significant in the algorithm wereCYP2C91/2
,CYP2C91/3
,CYP2C9 homozygous variants,VKORC1heterozygous,VKORC1homozygous variant and theCYP4F2 homozygous variant. The outcome was the natural logarithm of the mean weekly doses of ace-nocoumarol(Table 3). We grouped the polymorphisms of theCYP2C9homozygous variants because their function appears to be similar. TheAPOEgenotype was not included in the final model because it did not reach statistical significance (p = .521, R2= 0.1%).
Variability of the pharmacogenetic algorithm
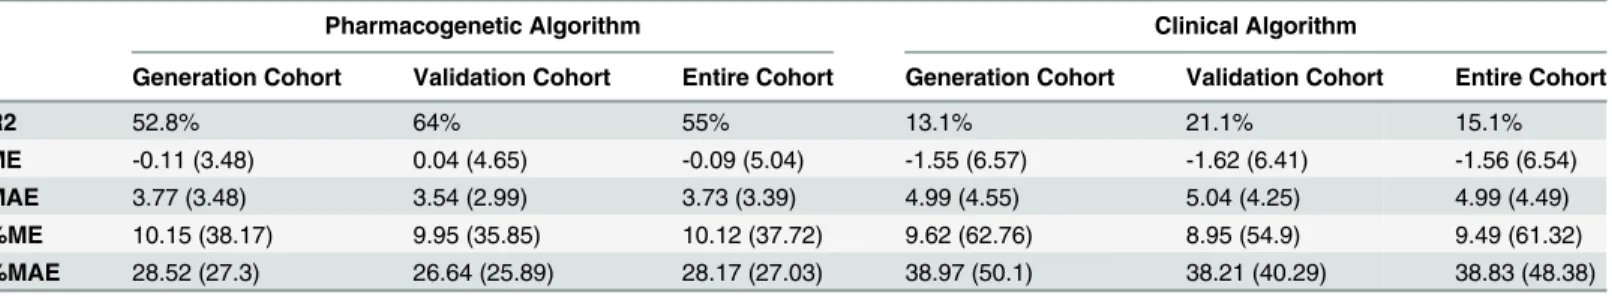
The variability explained by the pharmacogenetic algorithm was 52.8% in the generation cohort and increased to 64%, in the validation cohort, whereas the clinical algorithm explained 13.1% and 21.1% respectively. The accuracy of the pharmacogenetic algorithm in both cohorts was good, with a low calculated ME (-0.11 mg for the generation cohort and 0.04 mg for the validation cohort), whereas the accuracy for the clinical algorithm was higher: -1.55 (6.57) and -1.62 (6.41), respectively. The precision calculated as MAE was good in the pharmacogenetic algorithm: the MAE was 3.77 mg (3.48) in the generation cohort and 3.54 mg (2.99) in the vali-dation cohort. For the clinical algorithm, the MAE was higher 4.99 (4.55) and 5.04 (4.25), respectively. We also calculated the predicted dosage by both algorithms in the entire cohort. For this cohort, the R2was 15.1% for the clinical algorithm and 55% for the pharmacogenetic algorithm. The ME and MAE were lower in the pharmacogenetic algorithm, which means that the bias and precision were clearly better in this algorithm(Table 4).
The predictive performance of the pharmacogenetic algorithm was evaluated by disease. As shown inTable 5, the patient group with the best prediction was the AF group, with an R2of 57.4%, followed by the VR group, with an R2of 56.3%.
Clinical Relevance
pharmacogenetic algorithm was 46%, whereas 34% were classified properly with the clinical algorithm(Table 6).
If we classify the patients into the 3 dosage groups (<11 mg/week, 11–21 mg/week,>21
mg/week), we can see that the percentage of patients correctly classified is higher in the inter-mediate group (11–21 mg/week) for both algorithms, whereas the difference between the 2 Table 1. Patients characteristics in the generation (n = 556) and validation (n = 129) cohorts.
Variables Generation cohort (n = 556) Validation cohort (n = 129) p
Sex, n (%)
Female/Male 283/273 (50.9/49.1) 54/75 (41.9/58.1) .078
Mean age, y (SD) 68.7 (12.41) 67.6 (14.80) .446
Mean weight, kg (SD) 75.8 (14.16) 78.06 (16.26)◆ .147
Mean height, m (SD) 1.62 (0.09) 1.64 (0.10)◆ .107
Mean body mass index, kg/m2 (SD) 28.73 (4.86) 28.93 (4.30)◆ .653
Underlying disease, n (%)
Thromboembolic venous disease 160 (28.8) 42 (32.6)
Auricularfibrillation 263 (47.3) 59 (45.7)
Valve replacement 115 (20.8) 26 (20.2)
Other diseases 18 (3.2) 2 (1.6)
Mean acenocoumarol dosage, mg/week (SD) 15.16 (0.30) 15.5 (0.67) .632
Concurrent medications
Inductor drugs*[Yes/No], n (%) 107/448 (19.3/80.7)γ 29/100 (22.5/77.5) .412
Amiodarone [Yes/No], n (%) 27/527 (4.9/94.6)¥ 9/120 (7/93) .380
Phenotype, n (%)
11 mg/week 177 (31,8) 39 (30.2)
11–21 mg/week 279 (50.2) 62 (48.1)
21 mg/week 100 (18) 28 (21.7)
CYP2C9genotype, n (%) .881
*1/*1 325 (58.5) 77 (59.7)
*1/*2 138 (24.8) 30 (23.3)
*1/*3 62 (11.2) 16(12.4)
*2/*2 12 (2.2) 2 (1.6)
*2/*3 14 (2.5) 4 (3.1)
*3/*3 5 (0.9) 0 (0)
VKORC1genotype, n (%) .874
Homozygote wt/wt 202 (36.4) 47 (36.4)
Heterozygote 277 (49.8) 62 (48.1)
Homozygote mut/mut 77 (13.8) 20 (15.5)
CYP4F2genotype, n (%)
MM 83 (14.6) 14 (12.3) .455
APOErs7412 genotype, n (%) .621
Homozygote wt/wt 494 (88.9) 116 (89.9)
Heterozygote 58 (10.4) 13 (10.1)
Homozygote mut/mut 4 (0.7) 0 (0)
Abbreviations: SD, standard deviation; mut, mutated; wt, wild type.
*CYP inducers that were considered in this analysis included phenytoin, carbamazepine and rifampin
γMissing data, n = 555 ¥ Missing data, n = 554
◆Missing data, n = 128
algorithms increases in the extreme-dosage groups. Thus, the pharmacogenetic algorithm cor-rectly classified 32.4% of the low-dosage group, compared with 19.9% using the clinical algo-rithm. Similarly, the pharmacogenetic algorithm correctly classified 41.4% of the high-dosage group compared with only 6.3% with the clinical algorithm. Differences in the MAE were also significant in the extreme-dosage groups between the 2 algorithms(Table 7).
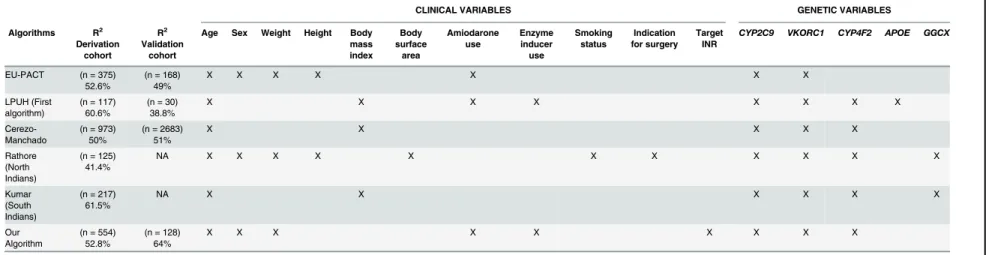
Published pharmacogenetic algorithms for acenocoumarol show differences in the included clinical/demographic and genetic variables. All account for over 40% of the variability in the dosage of this drug.Table 8shows the comparisons regarding the performance and included variables between this new algorithm and others.
Discussion
Expensive new oral anticoagulants with a short history of clinical use are being marketed; how-ever, coumarins such as warfarin, acenocoumarol and phenprocoumon are still the most Table 2. Patients characteristics according to disease in the entire cohort.
Variables TVD (n = 202) AF (n = 322) VR (n = 141) OD (n = 20) p
Sex, n (%)
Men 100 (49.5) 176 (54.7) 63 (44.7) 9 (45) .218
Women 102 (50.5) 146 (45.3) 78 (55.3) 11 (55)
Mean age, y (SD) 66.12 (16.91) 72.44 (8.90)* 64.37 (10.32) 57.65 (15.83) <.001
Mean weight, kg (SD) 76.51 (16.20) 78.43 (13.44) ¥ 70.93 (13.84) 76.15 (10.84) <.001
Mean height, m (SD) 1.63 (0.091) 1.63 (0.091) ¥ 1.61 (0.10) 1.63 (0.083) .302
Mean body mass index, kg/m2 (SD) 28.67 (5.08) 29.55 (4.77) ¥ 27.15 (3.77) 28.81 (4.46) <.001 Median acenocoumarol dosage, mg/week (range) 15 (2.5–47) 13.49 (3.0–37)* 16.48 (2.0–38.5) 21 (10.0–61.5) <.001 Concurrent medications, n (%)
Enzyme inducers† 25 (12.5) 80 (24.8) 26 (18.4) 5 (25) .006
Amiodarone 2 (1) 29 (9)*¥ 5 (3.5) 0 <.001
Phenotype, n (%) <.001
<11 mg/week 66 (32.7) 117 (36.3) 31 (22) 2 (10)
11–21 mg/week 86 (42.6) 169 (52.5) 75 (53.2) 11 (55)
>21 mg/week 50 (24.8) 36 (11.2) 35 (24.8) 7 (35)
CYP2C9 genotype, n (%) .084
Homozygote wt/wt 109 (54) 187 (58.1) 93 (66) 13 (65)
Heterozygote 84 (41.58) 112 (34.8) 45 (31.9) 5 (25)
Homozygote mut/mut 33 (16.3) 43 (13.4) 19 (13.5) 2 (10)
CYP4F2 genotype, n (%)
MM 26 (12.9) 53 (16.5) 16 (11.3) 2 (10) .411
APOE rs7412 genotype, n (%) .311
Homozygote wt/wt 176 (87.13) 292 (90.7) 127 (90.1) 15 (75)
Heterozygote 24 (11.9) 29 (9) 13 (9.2) 5 (25)
Homozygote mut/mut 2 (1) 1 (0.3) 1 (0.7) 0
Abbreviations: AF, atrialfibrillation; OD, other diseases; SD; standard deviation; VR, valve replacement; TVD, thromboembolism venous disease; mut, mutated; wt, wild type.
†CYP inducers that were considered in this analysis included phenytoin, carbamazepine and rifampin
*Group with significant differences compared with other groups ¶ Missing data, n = 201
¥ Missing data, n = 321
frequently prescribed drugs for the management of TVD, AF and VR. The high interindividual variability in the dosage requirements of coumarins has been attributed to several clinical and demographic factors and genetic variations. This high variability markedly affects the time Table 3. Pharmacogenetic and clinical algorithms.
Pharmacogenetic algorithm
Beta Variable P-value Adj R2(%) Cumulative R2(%)
3.181 Intercept
-0.010 Age <.001
0.005 Weight <.001
0.070 Enzyme inducer status .053
-0.337 Amiodarone status <.001
0.086 INR target range .014
Clinical variables 13.1 13.1
-0.111 CYP2C9*1/*2 <.001
-0.323 CYP2C9*1/*3 <.0001
-0.691 CYP2C9*2/*2or*2/*3or*3/*3 <.0001
CYP2C9 14.3 27.4
-0.302 VKORC1 A/G <.001
-0.727 VKORC1 A/A <.001
VKORC1 22.9 50.3
0.214 CYP4F2 MM <.001
CYP4F2 2.5 52.8
Clinical Algorithm
2.951 Intercept
-0.011 Age <.001
0.004 Weight .013
0.045 Enzyme inducer status .357
-0.290 Amiodarone status <.001
0.086 INR target range .014
Clinical variables 13.1 13.1
Beta: standardized regression coefficient
The pharmacogenetic algorithm: natural logarithm of the mean weekly doses of acenocoumarol = 3.181–0.010*age (y) + 0.005*weight (kg) + 0.070 (if enzyme inducer is used)–0.337 (if amiodarone is used)–0.111 (ifCYP2C9*1/*2)–0.323 (ifCYP2C9*1/*3)–0.691 (ifCYP2C9homozygote mutated)–
0.302 (ifVKORC1 A/G)–0.727 (ifVKORC1 A/A) + 0.214 (ifCYP4F2 MM) + 0.086 (if INR target is 2.5–3.5). The outcome is the natural logarithm of the mean acenocoumarol dosage in mg/week.
doi:10.1371/journal.pone.0150456.t003
Table 4. Predictive performance of the pharmacogenetic and clinical algorithms in the generation, validation and entire cohorts.
Pharmacogenetic Algorithm Clinical Algorithm
Generation Cohort Validation Cohort Entire Cohort Generation Cohort Validation Cohort Entire Cohort
R2 52.8% 64% 55% 13.1% 21.1% 15.1%
ME -0.11 (3.48) 0.04 (4.65) -0.09 (5.04) -1.55 (6.57) -1.62 (6.41) -1.56 (6.54)
MAE 3.77 (3.48) 3.54 (2.99) 3.73 (3.39) 4.99 (4.55) 5.04 (4.25) 4.99 (4.49)
%ME 10.15 (38.17) 9.95 (35.85) 10.12 (37.72) 9.62 (62.76) 8.95 (54.9) 9.49 (61.32)
%MAE 28.52 (27.3) 26.64 (25.89) 28.17 (27.03) 38.97 (50.1) 38.21 (40.29) 38.83 (48.38)
Abbreviations: ME: mean error (predicted–observed); %ME: mean error expressed as a percentage (%ME = ME/Observed*100); MAE: mean absolute
error (= SQR[(Predicted-Observed)2]); %MAE: mean absolute error expressed as a percentage (%MAE = MAE/Observed *100).
within the target INR and the clinical outcomes. Jones et al. showed that a 10% increase in the time out of range was associated with a 29% higher risk of mortality, a 10% increase in the risk of ischemic stroke and a 12% increase in all thromboembolic events [27].
For patients with TVD, the risk of progression, recurrence and death due to PE is greatest in the first weeks after the diagnosis. Despite modern diagnostic and treatment methods, PE con-tinues to have a high mortality rate during the first 3 months, which is probably due to the recurrence of embolism. The frequency of PE could be lowered if more intensive anticoagula-tion were used [28].
For patients with AF, preventing stroke and thromboembolism are the primary therapeutic goals. For these patients, the expected embolic event rate increases from 2.5% to over 12% per year if they are not properly anticoagulated [29]. Rates of major hemorrhage reported for patients with AF undergoing warfarin treatment range from 1.3 to 7.2 per 100 person-years. Patients with AF tend to be older, have associated comorbidities and take more concomitant medications [29]. The first 90 days are associated with a 3-fold increased risk of major hemor-rhage, which is associated with the advanced age of these patients [30]. These data correspond with those of our study; in which patients with AF had the lowest average dose of acenocou-marol, which could increase the likelihood that some patients receive a higher dose of aceno-coumarol at the beginning of the treatment. In clinical practice, the estimation of both bleeding and stroke risks are recommended to guide decisions on thromboprophylaxis therapy [31,32].
This study confirms that acenocoumarol algorithms can explain more than 50% of the interindividual variability in the most appropriate dosage of acenocoumarol for stable anticoa-gulation. The algorithm previously designed and validated by our group was developed for a patient cohort with TVD [23]. Given the fact that these patients are typically younger, have less comorbidity and take fewer concomitant medications, we believe this algorithm might not be useful for other diseases that require anticoagulation with acenocoumarol due to the differ-ences (mainly demographic and clinical) between patients with TVD and those with other Table 5. Predictive performance of the pharmacogenetic algorithm by disease in the entire cohort (n = 682).
TVD (n = 202) AF (n = 322) VR (n = 141) OD (n = 20)
R2 51.5% 57.4% 56.3% 45.2%
ME -1.12 (5.53) 0.59 (4.07) 0.22 (5.16) -2.59 (9.43)
MAE 4.12 (3.85) 3.28 (2.47) 3.91 (3.36) 5.81 (7.78)
%ME 2.11 (37.19) 15.23 (38.07) 11.47 (36.52) -1.19 (31.80)
%MAE 26.55 (26.06) 29.68 (28.26) 27.32 (26.73) 26.13 (17.15)
Abbreviations: AF, atrialfibrillation; OD, other diseases; VR, valve replacement; TVD, thromboembolism venous; ME: mean error (predicted–observed); % ME: mean error expressed as a percentage (%ME = ME/Observed*100); MAE: mean absolute error (= SQR[(Predicted-Observed)2]); %MAE: mean
absolute error expressed as a percentage (%MAE = MAE/Observed*100).
doi:10.1371/journal.pone.0150456.t005
Table 6. Patients correctly classified (predicted dose within±20% of the actual dosage) by genetic and clinical algorithms in the generation, vali-dation and entire cohorts (n = 682).
% Correctly classified
Pharmacogenetic algorithm Clinical algorithm p-value
Generation cohort (n = 554) 46.9% 34.7% <.001
Validation cohort (n = 128) 46.5% 34.1% <.001
Entire cohort (n = 685) 46.9% 34.5% <.001
diagnoses. Nevertheless, Jimenez-Varo et al., in a recently published study, reported that imple-mentation of the algorithm previously designed by our group led to the highest percentage of correctly classified patients (40.7%) compared with the other algorithms published to date for acenocoumarol [33].
The algorithm described here leads to similar results as those from other algorithms [22,24] per-formed for the European population regarding the factors influencing stable dosages of coumarins. The most important factors for dosage prediction are theVKORC1andCYP2C9genotypes, whereasCYP4F2has less influence. Regarding clinical variables, age and weight were the most important clinical factors for dosage prediction. Other variables we found significant, such as con-comitant medications and target INR, are not consistently included in published algorithms.
When considering the entire cohort, this algorithm explained 55% of the interindividual variability of the most appropriate acenocoumarol dosage; clinical variables explained only 15.1% of this variability. The results show that the inclusion of genetic variables greatly increases the predictability of the dosage required for each patient. Algorithms published for other populations would not be comparable with the results of this algorithm. There are varia-tions in the frequency of polymorphisms among various ethnic groups; some genes have more impact on one ethnic group than another. Thus, in the study performed on the Northern Indian population [20],VKORC1andCYP4F2polymorphisms were the principal genetic vari-ables, whereas in the algorithm developed for Southern Indians and those for the European population,VKORC1andCYP2C9are the genetic factors that contribute most to the perfor-mance of these algorithms. Furthermore, our algorithm differs from those published for the Indian population [20,21]; the authors of that algorithms includedGGCXgene polymorphisms (rs11676382), which we do not.
When the predictive performance of the pharmacogenetic algorithm was evaluated by dis-ease, the best prediction was for the AF group (R2of 57.4%), which was similar to the R2found for the VR group. For the patients with TVD, the variability explained for the algorithm was somewhat lower (R2= 51.5%). However, the MAE and %MAE were similar in all groups, con-firming that the algorithm worked similarly for all groups.
Not surprisingly, when using standard starting dosages or dosages based on clinical vari-ables, most of the incorrectly dosed patients were those who needed low or high
Table 7. Patients correctly classified (predicted dose within±20% of actual dosage) and MAE from the entire cohort (n = 682) by genetic and clini-cal algorithms according to dosage groups.
Dosage Group Pharmacogenetic algorithm Clinical Algorithm Difference p-value*
Low (11 mg/week)
% correctly classified 32.4% 19.9% 12.5% <.001
Mean MAE (SD) 3.12 (2.32) 4.37 (2.78) 1.25 (3.01) <.001
95% CI 0.85 to 1.66
Median (11–21 mg/week)
% correctly classified 58.1% 54.5% 3.6% .118
Mean MAE (SD) 3.01 (2.32) 3.15 (2.36) 0.14 (2.97) .403
95% CI 0.18 to 0.45
High (21 mg/week)
% correctly classified 41.4% 6.3% 34.8% <.001
Mean MAE (SD) 6.64 (5.26) 10.92 (5.93) 4.28 (3.76) <.001
95% CI 3.62 to 4.93
Abbreviations: CI, confidence interval; MAE, mean absolute error (= SQR[(predicted-observed)2]); SD, standard deviation.
Table 8. Comparison of performance and variables included in the various acenocoumarol algorithms.
CLINICAL VARIABLES GENETIC VARIABLES
Algorithms R2 Derivation
cohort
R2 Validation
cohort
Age Sex Weight Height Body mass index Body surface area Amiodarone use Enzyme inducer use Smoking status Indication for surgery Target INR
CYP2C9 VKORC1 CYP4F2 APOE GGCX
EU-PACT (n = 375) 52.6%
(n = 168) 49%
X X X X X X X
LPUH (First algorithm)
(n = 117) 60.6%
(n = 30) 38.8%
X X X X X X X X
Cerezo-Manchado
(n = 973) 50%
(n = 2683) 51%
X X X X X
Rathore (North Indians)
(n = 125) 41.4%
NA X X X X X X X X X X X
Kumar (South Indians)
(n = 217) 61.5%
NA X X X X X X
Our Algorithm
(n = 554) 52.8%
(n = 128) 64%
X X X X X X X X X
Abbreviations: CI, confidence interval; EU-PACT, European Pharmacogenetics of Anticoagulant Therapy; LPUH, La Paz University Hospital; MAE, mean absolute error (= SQR [(predicted-observed)2]); NA, not applicable; SD, standard deviation
acenocoumarol dosages. These are the patients we can expect to benefit most from the pharma-cogenetic algorithm. In this study, the percentage of patients for whom the pharmapharma-cogenetic algorithm would have improved acenocoumarol dosing when compared with a clinical algo-rithm would have been approximately 12.7% (87 patients out a total of 685). Most were patients needing low dosages (27 patients) and notably higher dosages (45 patients). The for-mer would have been overdosed for a number of weeks (until clinical dose adjustments reached a stable INR) and could have been at risk of bleeding, whereas the latter could have been under-dosed and would have been at risk of thromboembolic events.
There were differences between the 2 algorithms published by our group regarding the variables included. On one hand, we included the target INR variable in this new algorithm, as justified by the different target INRs for the various diagnoses. We found that the target INR had a modest but significant influence (seeTable 3). On the other hand, the contribution ofAPOEto the total vari-ability was not confirmed in this study because it was not significant (p = 0.521, R2= 0.1%), and was therefore not included in the algorithm. The inclusion in the algorithm of the taking of certain drugs such as enzyme inducers and amiodarone, is also justified by data in the literature on their influence on the coumarin dose and, as we have seen in the model, their influence is significant (beta of 0.070 and -0.337 respectively). Amiodarone intake was one of the variables included in the algorithm published by the EU-PACT group, with a similar result (beta of -0.377).
The usefulness of pharmacogenetic algorithms in a clinical setting has been tested in 3 pub-lished clinical trials, 2 of which were performed with warfarin and 1 with acenocumarol and phenprocoumon. In 2013, a randomized trial of genotype-guided acenocoumarol dosing showed that the pharmacogenetic algorithm, which included clinical and genetic variables, did not improve the percentage of time in the therapeutic INR range during the 12 weeks after the start of therapy compared with the clinical algorithm [34]. The EU-PACT group, however, reported that pharmacogenetics-based warfarin dosing was better than standard dosing, with a higher percentage of time in the therapeutic INR range than traditional clinical dosages during the start of warfarin therapy [35]. The results of these studies are controversial in terms of the applicability of pharmacogenetic algorithms, and certainly there are variables that are not included in these algorithms, which in the context of clinical trials cannot be controlled.
Pharmacogenetic algorithms have typically been developed by collecting information from individuals with various demographic, clinical and genetic characteristics. Both clinical and phar-macogenetic algorithms show similar accuracy in predicting the dose of wild-type genotype patients; however, algorithms that integrate genetic information are more accurate and useful for patients with allelic variants because these patients often have extreme dosages of acenocoumarol, for whom INR stabilization becomes more difficult and time-consuming to achieve.
There are a number of limitations in this study. A number of parameters that have also been linked to changes in the required stable coumarins dosages were not included, such as smoking status, other concomitant medications and the dietary vitamin K intake. All are important fac-tors to keep in mind when establishing a stabilized dosage of acenocoumarol.
In conclusion, our new algorithm can provide better prediction, when compared with the clinical algorithm, of the ideal acenocoumarol dosage for a broad spectrum of patients who are starting treatment with this drug, particularly those who need extreme dosages. The perfor-mance of the pharmacogenetic algorithm is similar for patients with different diseases despite the demographic and clinical variations among the patients.
Supporting Information
S1 Appendix. PGx-ACE Investigation Group.
Author Contributions
Conceived and designed the experiments: HYT CDF AMB LMG AJC. Performed the experi-ments: HYT CDF AMB LMG RL LPL MBB XDV CFC JCB AJC and the PGX-ACE Investiga-tors Group. Analyzed the data: HYT CDF AMB RL AJC. Contributed reagents/materials/ analysis tools: HYT CDF AMB LPL MBB XDV JCB AJC. Wrote the paper: HYT CDF AMB LMG RL LPL MBB XDV CFC JCB AJC.
References
1. Landefeld CS, Beyth RJ. Anticoagulant-related bleeding: clinical epidemiology, prediction, and preven-tion. Am J Med. 1993 Sep; 95(3):315–28. PMID:8368229
2. Anderson JL, Horne BD, Stevens SM, Grove AS, Barton S, Nicholas ZP, et al. Randomized trial of genotype-guided versus standard warfarin dosing in patients initiating oral anticoagulation. Circulation 2007; 116(22):2563–70. PMID:17989110
3. Millican EA, Lenzini PA, Milligan PE, Grosso L, Eby C, Deych E, et al. Genetic-based dosing in orthope-dic patients beginning warfarin therapy. Blood2007; 110(5):1511–5. PMID:17387222
4. Sconce EA, Khan TI, Wynne HA, Avery P, Monkhouse L, King BP, et al. The impact of CYP2C9 and VKORC1 genetic polymorphism and patient characteristics upon warfarin dose requirements: proposal for a new dosing regimen. Blood 2005; 106(7):2329–33. PMID:15947090
5. Zambon CF, Pengo V, Padrini R, Basso D, Schiavon S, Fogar P, et al. VKORC1, CYP2C9 and CYP4F2 genetic-based algorithm for warfarin dosing: an Italian retrospective study. Pharmacogeno-mics 2011; 12(1):15–25. doi:10.2217/pgs.10.162PMID:21174619
6. Moreau C, Pautas E, Gouin-Thibault I, Golmard JL, Mahé I, Mulot C, et al. Predicting the warfarin main-tenance dose in elderly inpatients at treatment initiation: accuracy of dosing algorithms incorporating or not VKORC1/CYP2C9 genotypes. J Thromb Haemost 2011; 9(4):711–18. doi:10.1111/j.1538-7836. 2011.04213.xPMID:21255252
7. Lenzini P, Wadelius M, Kimmel S, Anderson JL, Jorgensen AL, Pirmohamed M, et al. Integration of genetic, clinical, and INR data to refine warfarin dosing. Clin Pharmacol Ther 2010; 87(5):572–8. doi: 10.1038/clpt.2010.13PMID:20375999
8. Takeuchi F, McGinnis R, Bourgeois S, Barnes C, Eriksson N, Soranzo N, et al. A genome-wide associ-ation study confirms VKORC1, CYP2C9, and CYP4F2 as principal genetic determinants of warfarin dose. PLoS Genet. 2009 Mar; 5(3):e1000433. doi:10.1371/journal.pgen.1000433PMID:19300499 9. Teichert M, Eijgelsheim M, Rivadeneira F, Uitterlinden AG, van Schaik RH, Hofman A, et al. A
genome-wide association study of acenocoumarol maintenance dosage. Hum Mol Genet. 2009 Oct 1; 18 (19):3758–68. doi:10.1093/hmg/ddp309PMID:19578179
10. Aithal GP, Day CP, Kesteven PJ, Daly AK. Association of polymorphisms in the cytochrome P450 CYP2C9 with warfarin dose requirement and risk of bleeding complications. Lancet. 1999 Feb 27; 353 (9154):717–9. PMID:10073515
11. Thijssen HH, Flinois JP, Beaune PH. Cytochrome P4502C9 is the principal catalyst of racemic aceno-coumarol hydroxylation reactions in human liver microsomes. Drug Metab Dispos. 2000 Nov; 28 (11):1284–90. PMID:11038154
12. Rieder MJ, Reiner AP, Gage BF, Nickerson DA, Eby CS, McLeod HL, et al. Effect of VKORC1 haplo-types on transcriptional regulation and warfarin dose. N Engl J Med. 2005 Jun 2; 352(22):2285–93. PMID:15930419
13. Caldwell MD, Awad T, Johnson JA, Gage BF, Falkowski M, Gardina P, et al. CYP4F2 genetic variant alters required warfarin dose. Blood. 2008 Apr 15; 111(8):4106–12. doi: 10.1182/blood-2007-11-122010PMID:18250228
14. Pérez-Andreu V, Roldán V, Antón AI, García-Barberá N, Corral J, Vicente V, et al. Pharmacogenetic relevance of CYP4F2 V433M polymorphism on acenocoumarol therapy. Blood. 2009 May 14; 113 (20):4977–9. doi:10.1182/blood-2008-09-176222PMID:19270263
15. Gage BF, Eby C, Johnson JA, Deych E, Rieder MJ, Ridker PM, et al. Use of pharmacogenetic and clini-cal factors to predict the therapeutic dose of warfarin. Clin Pharmacol Ther. 2008 Sep; 84(3):326–31. doi:10.1038/clpt.2008.10PMID:18305455
16. Johnson JA, Gong L, Whirl-Carrillo M, Gage BF, Scott SA, Stein CM, et al. Clinical Pharmacogenetics Implementation Consortium. Clinical Pharmacogenetics Implementation Consortium Guidelines for CYP2C9 and VKORC1 genotypes and warfarin dosing. Clin Pharmacol Ther. 2011 Oct; 90(4):625–9.
17. Michaud V, Vanier MC, Brouillette D, Roy D, Verret L, Noel N, et al. Combination of phenotype assess-ments and CYP2C9-VKORC1 polymorphisms in the determination of warfarin dose requireassess-ments in heavily medicated patients. Clin Pharmacol Ther. 2008 May; 83(5):740–8. PMID:18030307
18. Hermans JJ, Thijssen HH. Human liver microsomal metabolism of the enantiomers of warfarin and ace-nocoumarol: P450 isozyme diversity determines the differences in their pharmacokinetics. Br J Phar-macol. 1993 Sep; 110(1):482–90. PMID:8220911
19. Verde Z, Ruiz JR, Santiago C, Valle B, Bandrés F, Calvo E, et al. A novel, single algorithm approach to predict acenocoumarol dose based on CYP2C9 and VKORC1 allele variants. PLoS One 2010; 5(6): e11210. doi:10.1371/journal.pone.0011210PMID:20585445
20. Rathore S, Agarwal S, Pande S, Singh S, Mittal T, Mittal B. Therapeutic dosing of acenocoumarol: Pro-posal of a Population Specific Pharmacogenetic Dosing Algorithm and Its Validation in North Indians. PLoS One 2012; 7(5):e37844. doi:10.1371/journal.pone.0037844PMID:22629463
21. Krishna Kumar D, Shewade DG, Loriot MA, Beaune P, Sai Chandran BV, Balachander J, et al. An ace-nocoumarol dosing algorithm exploiting clinical and genetic factors in South Indian (Dravidian) popula-tion. Eur J Clin Pharmacol. 2015 Feb; 71(2):173–81. doi:10.1007/s00228-014-1791-xPMID:
25519826
22. Rianne MF, van Schie RM, Wessels JA, le Cessie S, de Boer A, Schalekamp T, et al. Loading and maintenance dose algorithms for phenprocoumon and acenocoumarol using patient characteristics and pharmacogenetic data. Eur Heart J 2011; 32(15):1909–17. doi:10.1093/eurheartj/ehr116PMID: 21636598
23. Borobia AM, Lubomirov R, Ramírez E, Lorenzo A, Campos A, Muñoz-Romo R, et al. An acenocou-marol dosing algorithm using clinical and pharmacogenetic data in Spanish patients with thromboem-bolic disease. PLoS One. 2012; 7(7):e41360. doi:10.1371/journal.pone.0041360PMID:22911785 24. Cerezo-Manchado JJ, Rosafalco M, Antón AI, Pérez-Andreu V, Garcia-Barberá N, Martinez AB, et al.
Creating a genotype-based dosing algorithm for acenocoumarol steady dose. Thromb Haemost. 2013 Jan; 109(1):146–53. doi:10.1160/TH12-08-0631PMID:23196355
25. Freeman B, Smith N, Curtis C, Huckett L, Mill J, Craig IW. DNA from buccal swabs recruited by mail: evaluation of storage effects on long-term stability and suitability for multiplex polymerase chain reac-tion genotyping. Behavior genetics. 2003; 33(1), 67–72. PMID:12645823
26. Gómez-martín A, Hernández AF, Martínez-gonzález LJ, González-alzaga B, Rodríguez-barranco M, López-flores I. Polymorphisms of pesticide-metabolizing genes in children living in intensive farming communities. Chemosphere. 2015; 139, 534–540. doi:10.1016/j.chemosphere.2015.07.079PMID: 26318115
27. Jones M, McEwan P, Morgan C, Peters JR, Goodfellow J, Currie CJ. Evaluation of the pattern of treat-ment level of anticoagulation control and outcome of treattreat-ment with warfarin in patients with non-valvar atrial fibrillation: a record linkage study in a large British population. Heart 2005; 91:472–477 PMID:
15772203
28. Goldhaber SZ, Visani L, De Rosa M. Acute pulmonary embolism: clinical outcomes in the International Cooperative Pulmonary Embolism Registry (ICOPER). Lancet 1999; 353:1386–92 PMID:10227218 29. Go AS, Hylek EM, Phillips KA, Borowsky LH, Henault LE, Chang Y, et al. Implications of stroke risk
cri-teria on the anticoagulation decision in nonvalvular atrial fibrillation: The anticoagulation and risk factors in atrial fibrillation (ATRIA) study (2000) Circulation, 102 (1), pp. 11–13. PMID:10880408
30. Hylek EM, Evans-Molina C, Shea C, Henault LE, Regan S. Major hemorrhage and tolerability of warfa-rin in the first year of therapy among elderly patients with atrial fibrillation. Circulation. 2007 May 29; 115 (21):2689–96. PMID:17515465
31. Konstantinides SV, Torbicki A, Agnelli G, Danchin N, Fitzmaurice D, GalièN, et al. 2014 ESC guide-lines on the diagnosis and management of acute pulmonary embolism. Eur Heart J. 2014 Nov 14; 35 (43):3033–69, doi:10.1093/eurheartj/ehu283PMID:25173341
32. Kearon C, Kahn SR, Agnelli G, Goldhaber S, Raskob GE, Comerota AJ, et al. Antithrombotic therapy for venous thromboembolic disease: American College of Chest Physicians Evidence-Based Clinical Practice Guidelines (8th edition). Chest. 2008; 133:S454–545.
33. Jiménez-Varo E, Cañadas-Garre M, Garcés-Robles V, Gutiérrez-Pimentel MJ, Calleja-Hernández MÁ. Extrapolation of acenocoumarol pharmacogenetic algorithms. Vascul Pharmacol. 2015 Jun 27. pii: S1537–1891(15: )00141-X. doi:10.1016/j.vph.2015.06.010[Epub ahead of print]
34. Verhoef TI, Ragia G, de Boer A, Barallon R, Kolovou G, Kolovou V, et al. A randomized trial of geno-type-guided dosing of acenocoumarol and phenprocoumon. N Engl J Med. 2013 Dec12; 369 (24):2304–12. doi:10.1056/NEJMoa1311388PMID:24251360