Evaluation of a prediction model for sleep apnea
in patients submitted to polysomnography*
Avaliação de um modelo de predição para apneia do sono em pacientes submetidos a polissonografia
Silvio Musman, Valéria Maria de Azeredo Passos, Izabella Barreto Romualdo Silva, Sandhi Maria Barreto
Abstract
Objective: To test a prediction model for sleep apnea based on clinical and sociodemographic variables in a
population suspected of having sleep disorders and submitted to polysomnography. Methods: We included 323 consecutive patients submitted to polysomnography because of the clinical suspicion of having sleep disorders. We used a questionnaire with sociodemographic questions and the Epworth sleepiness scale. Blood pressure, weight, height, and SpO2 were measured. Multiple linear regression was used in order to create a prediction model for sleep apnea, the apnea-hypopnea index (AHI) being the dependent variable. Multinomial logistic regression was used in order to identify factors independently associated with the severity of apnea (mild, moderate, or severe) in comparison with the absence of apnea. Results: The prevalence of sleep apnea in the study population was 71.2%. Sleep apnea was more prevalent in men than in women (81.2% vs. 56.8%; p < 0.001). The multiple linear regression model, using log AHI as the dependent variable, was composed of the following independent variables: neck circumference, witnessed apnea, age, BMI, and allergic rhinitis. The best-fit linear regression model explained 39% of the AHI variation. In the multinomial logistic regression, mild apnea was associated with BMI and neck circumference, whereas severe apnea was associated with age, BMI, neck circumference, and witnessed apnea.
Conclusions: Although the use of clinical prediction models for sleep apnea does not replace polysomnography as a tool for its diagnosis, they can optimize the process of deciding when polysomnography is indicated and increase the chance of obtaining positive polysomnography findings.
Keywords: Sleep apnea syndromes; Polysomnography; Sleep apnea, obstructive; Body mass index.
Resumo
Objetivo: Testar um modelo de predição para apneia do sono a partir de variáveis sociodemográficas e clínicas em uma população com suspeita de distúrbio do sono e submetida à polissonografia. Métodos: Foram incluídos
no estudo 323 pacientes consecutivos submetidos à polissonografia por suspeita clínica de distúrbio do sono. Utilizou-se um questionário com questões sociodemográficas e a escala de sonolência de Epworth. Foram medidos pressão arterial, peso, altura e SpO2. A regressão linear múltipla, tendo o índice de apneia-hipopneia (IAH) como variável dependente, foi utilizada para construir um modelo de predição de apneia do sono. A regressão logística multinomial foi realizada para verificar fatores associados de forma independente à gravidade da apneia (leve, moderada ou grave) em comparação à ausência de apneia. Resultados: A prevalência de apneia do sono na
população de estudo foi de 71,2%, e foi mais prevalente nos homens que nas mulheres (81,2% vs. 56,8%; p < 0,001). O modelo de regressão linear múltipla, com o log IAH como variável dependente, foi composto pelas seguintes variáveis independentes: circunferência do pescoço, apneia testemunhada, idade, IMC e presença de rinite alérgica. O melhor modelo de regressão linear encontrado conseguiu explicar 39% da variabilidade do IAH. Na regressão logística multinomial, a apneia leve esteve associada com IMC e circunferência do pescoço, e a apneia grave associou-se com idade, IMC, circunferência do pescoço e apneia testemunhada. Conclusões: Modelos de
predição clínica para apneia do sono não substituem a polissonografia como ferramenta para o seu diagnóstico, mas podem otimizar sua indicação e aumentar a chance de positividade do exame.
Descritores: Síndromes da apneia do sono; Polissonografia; Apneia do sono tipo obstrutiva; Índice de massa
corporal.
* Study carried out at the Federal University of Minas Gerais School of Medicine, Belo Horizonte, Brazil.
Correspondence to: Silvio Musman. Rua Padre Rolim, 375, Santa Efigênia, CEP 30130-090, Belo Horizonte, MG, Brasil. Tel 55 31 3222-6004. E-mail: [email protected]
severe sleep apnea goes untreated have been shown to be at a higher risk for cardiovascular events in a 10-year follow-up period than are controls with similar degrees of obesity.(10)
Overnight polysomnography is indicated for the diagnosis of various sleep disorders, especially respiratory disorders.(1) Portable
systems for home sleep monitoring are quickly becoming widely available on the market and are principally being used for the diagnosis of obstructive sleep apnea-hypopnea. The American Sleep Disorders Association recommends that this monitoring be restricted to patients with acute clinical symptoms or to settings in which classic polysomnography is not available. Its use is also acceptable in the treatment of patients who have already been diagnosed through conventional polysomnography.(11) The
clinical impression alone has low accuracy for the diagnosis of sleep-disordered breathing, and polysomnography therefore remains indispensable.(12,13) A meta-analysis of clinical
studies for the diagnosis of obstructive sleep apnea revealed that clinical models have higher OR values for diagnosis and severity than do questionnaire-based models (10.49 and 17.24 vs. 5.02 and 10.12, respectively).(14) In that study,
the clinical elements associated with an OR > 2 were BMI, arterial hypertension, and a history of nocturnal choking. The Epworth sleepiness scale showed an OR of 0.43 for diagnosis (95% CI: 0.13-1.48). Therefore, there is still a need for testing models that can improve the prediction of these disorders, optimizing the process of deciding when polysomnography is indicated. The overall objective of the present study was to test a clinical model designed to predict AHI based on clinical and sociodemographic variables in a population clinically suspected of having sleep disorders and referred for polysomnography.
Methods
This was a cross-sectional observational study. The study population comprised 323 consecutive patients referred, by physicians working within the private health care system in Brazil, to a sleep laboratory for polysomnography between December of 2006 and March of 2007. In all cases, the reason for the referral was clinical suspicion of having sleep disorders (snoring, sleep apnea, insomnia, excessive
Introduction
Sleep-disordered breathing is defined as a syndrome in which the frequency and severity of events are pathophysiologically associated with adverse health symptoms or outcomes.
The frequency of apnea and hypopnea is expressed by the apnea-hypopnea index (AHI), which corresponds to the sum of the number of apneas and hypopneas divided by the total hours of sleep. Severity is classified, based on the AHI, as mild (5-15 events/h), moderate (15-30 events/h), or severe (> 30 events/h).(1)
A population-based study conducted in the city of São Paulo, Brazil, and using the second edition of the International Classification of Sleep Disorders, published by the American Academy of Sleep Medicine in 2005, showed the overall prevalence of obstructive sleep apnea to be 32.8% in the population studied.(2)
When an AHI ≥ 5 events/h was used as the
diagnostic criterion, the prevalence of sleep apnea in men tested in sleep laboratories was found to be 17-26%.(3)
A prospective study on sleep conducted in the state of Wisconsin, USA, showed that, in terms of body weight, being 10% heavier at baseline was predictive of a 32% increase in the AHI (95% CI: 20-45%).(4) Conversely, being 10%
lighter at baseline predicted a 26% decrease in the AHI (95% CI: 18-34%). Sleep apnea is also common in patients with craniofacial abnormalities.(5)
Sleep fragmentation with arousals at the end of an apneic episode causes excessive sleepiness in some patients. Apnea-related variations in sympathetic discharge produce a specific pattern of oxyhemoglobin desaturation followed by normalization of saturation, potentially damaging the neurons that promote wakefulness.(6,7) This injury contributes to
learning disorders and is a possible explanation for the residual sleepiness found in sleep apnea patients despite appropriate treatment.(5)
Heart rate and arterial pressure increase approximately five to seven seconds after the end of apnea, coinciding with arousal and oxyhemoglobin desaturation.(8,9)
Resting heart rate was measured with the electrocardiogram sensor of the polysomnography system, there being a rest period of at least 5 min.
Oxyhemoglobin saturation was measured with a digital oximeter (Healthdyne Technologies, Marietta, GA, USA).
The parameters for defining the events and syndromes, for establishing the degrees of severity, and for standardizing the measurement methods, as well as the technical considerations that were used for interpreting the polysomnography findings, making the diagnosis, and issuing the final polysomnography report, were those established by the American Academy of Sleep Medicine.(1)
The STATA statistical program, version 9.2 (Stata Corp., College Station, TX, USA), was used for statistical analysis.
Variables with normal distribution are expressed as means and standard deviations, whereas variables whose distribution is asymmetric or unknown are expressed as medians and interquartile ranges.
Pearson’s chi-square test was used for determination of statistical significance for comparison of categorical variables. The Student’s t-test was used for comparison of the means of the continuous variables with normal distribution, whereas the nonparametric Mann-Whitney test was used for comparison of the medians of the variables whose distribution was asymmetric or unknown.
Multiple linear regression was used in order to create a prediction model for sleep apnea, the AHI being the dependent variable. The variables that maintained a statistically significant association (p < 0.05) in the multivariate analysis remained in the final model. The linear regression model chosen was the one with the highest coefficient of determination (R2)
and whose variables showed, in addition to a statistically significant association, a strong clinical association with the AHI, based on data in the literature.
The F statistic was used for testing the statistical significance of the inclusion of each dependent variable in the model. The coefficient of determination R2 was used for calculating
the proportion of the total variation in AHI explained by each independent variable and by the set of independent variables. The adjusted daytime sleepiness, and periodic leg movements
in sleep).
The exclusion criteria were being pregnant, being under 18 years of age, having a psychiatric disorder (history, treatment, or use of medications) or a mental disorder that prevented the completion of the questionnaires, being illiterate, and being or having been under treatment for sleep apnea.
The study was approved by the Research Ethics Committee of the Federal University of Minas Gerais (ruling no. 2006205212), and all participating patients gave written informed consent.
We used a general questionnaire, which was standardized by the clinical team and adapted to the study, containing questions related to sociodemographic, clinical, and lifestyle variables, together with the Epworth sleepiness scale (ESS).(15,16) The ESS is designed to measure
subjective daytime sleepiness. It was developed in 1991(15) and has been validated for use in
Brazil.(17) An ESS score of 10 was used as the
cut-off point for distinguishing between normal and abnormal levels of daytime sleepiness.(16)
Arterial pressure, expressed in mmHg, was measured with a Missouri device (Embu, Brazil) by the indirect method, with auscultation. Patients with an arterial pressure ≥ 140/90 mmHg or
being treated with antihypertensive medication were defined as having systemic arterial hypertension.(18)
Height, in centimeters, was measured with a stadiometer (Welmy S.A., Santa Bárbara do Oeste, Brazil). Weight, in kilograms, was measured with a scale (Welmy S.A.) The BMI was calculated as the weight in kilograms divided by the square of the height in meters weight (kg/m2). Patients with a BMI of 25.0-29.9 kg/m2
were classified as overweight, those with a BMI of 30.0-39.9 kg/m2 were classified as obese, and
those with a BMI > 40.0 kg/m2 were classified
as morbidly obese. Neck circumference, in centimeters, was measured at the level of the cricoarytenoid joint with a tape measure.
Overnight polysomnography with the recording of 16 channels for a minimum of 6 hours was conducted by a duly trained professional technician. All tests were performed with an Alice® 3 polysomnography system
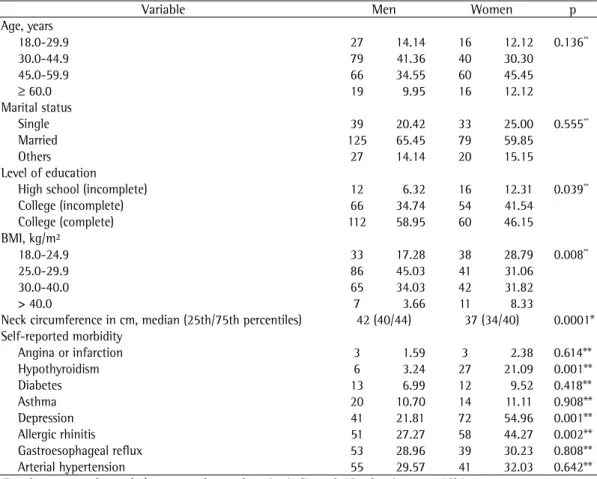
was a predominance of married patients and of patients with a high level of education (90% had completed at least high school and 53.7% had completed college). Of the patients evaluated, 39.3% were overweight, 33.1% were obese, and 5.6% were morbidly obese.
Table 1 shows the gender distribution of the study population by the characteristics under investigation. There were no gender-related differences in terms of age or marital status. Men and women differed significantly in terms of the distribution of BMI values, the percentage of obese patients being higher among men and the percentage of morbidly obese patients being higher among women. The median neck circumference was 40 cm, and there was a significant gender-related difference. The comorbidities most often reported were arterial hypertension, gastroesophageal reflux, allergic rhinitis, and depression. In comparison with the men, the women more often reported hypothyroidism (p < 0.001), depression (p < 0.001), and allergic rhinitis (p < 0.002).
The prevalence of sleep apnea in the study population was 71.2%, sleep apnea being classified as mild in 30.7% of the cases, as moderate in 10.0%, and as severe in 22.6%. Apnea was more common among men than among women (81.2% vs. 56.8%; p < 0.001), as were severe cases (30.4% vs. 11.4%). The median AHI was significantly higher for men than for women (14.3 events/h vs. 6.2 events/h; p < 0.0001; Table 2).
Although obstructive sleep apnea was the most common type of sleep apnea among men and women, the prevalence of all types of apnea was higher among men (p < 0.001).
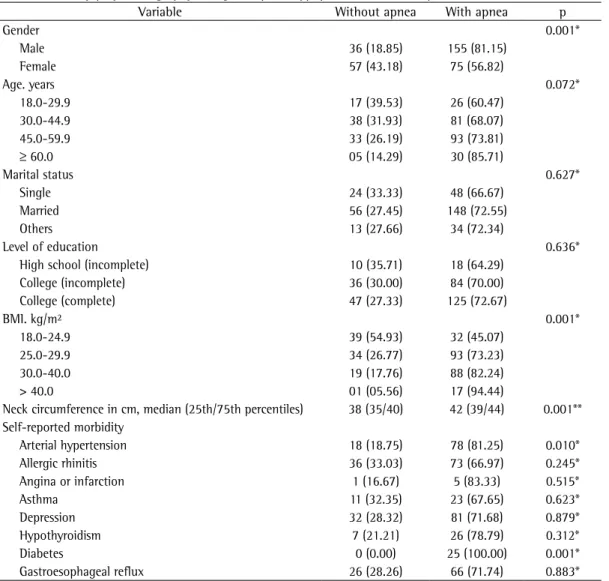
There was no significant difference between the groups of patients with and without sleep apnea in terms of age. However, the prevalence of the disease increases in parallel with increasing age (60.5% among patients aged 18-29 years vs. 85.7% among patients aged 60 years or older). There were also no significant differences between the patients with and without apnea in terms of marital status or level of education. There was a statistically significant difference between the groups of patients with and without sleep apnea in terms of BMI, the prevalence of apnea increasing in parallel with increases in BMI (45.1%, 73.2%, 82.2%, and 94.4% for coefficient of determination R2 was used for
measuring the increase in variation explained in the multivariate model, after it had been decided that the variation in R2 was simply random.
The appropriateness of the linear regression model was tested graphically, and the assumption tests for the validity of the linear regression model available in the STATA software package were used. To fit these assumptions (normality of the distribution of residuals, homoscedasticity, and appropriateness of the model in terms of the inclusion of all relevant variables), the AHI was log-transformed, the variable “log AHI” being created.
The normality of the distribution of residuals was tested graphically and confirmed by a p value > 0.05 on the Shapiro-Wilk W test.(19)
The assumption of homogeneity of variance of residuals (homoscedasticity) was also tested graphically and with the use of the decomposition of the information matrix test (STATA IM-test) as proposed by Cameron &
Trivedi for regression models.(20) The strength of
the correlations among the variables included in the model was tested by examining the variance inflation factor.
The appropriateness of the model in terms of the inclusion of all relevant variables was tested with the use of linktest and ovtest. The Ramsey regression specification error test was also used.
Finally, multinomial logistic regression analysis was used for identifying factors independently associated with the severity of apnea (mild, moderate, or severe) in comparison with the absence of apnea. Initially, univariate analysis was performed to determine the association of each independent variable with mild, moderate, and severe sleep apnea. After this analysis, all variables with a p value < 0.20 in the initial analysis were included in the multivariate analysis, whereas only those with a p value < 0.05 remained in the final model. The magnitude of the association was expressed in ORs and 95% CIs.
Results
The multiple linear regression model that best fit the assumptions and obtained the highest R2, using log AHI as the dependent variable,
was composed of the following independent variables: neck circumference (cm); witnessed apnea (yes = 1); age (years); BMI (kg/m2); and
allergic rhinitis (yes = 1). This model explained approximately 39% of the variation in the log individuals classified as normal BMI, overweight,
obese, and morbidly obese, respectively).
The mean neck circumference in the groups of patients with and without sleep apnea was 38 cm and 42 cm, respectively (p < 0.001). Arterial hypertension (p = 0.010) and diabetes (p = 0.001) were the most common comorbidities in the group of patients with sleep apnea (Table 3).
Table 1 - Sociodemographic characteristics and aspects of health of 191 men and 132 women submitted to
polysomnography.a
Variable Men Women p
Age, years
18.0-29.9 27 14.14 16 12.12 0.136**
30.0-44.9 79 41.36 40 30.30
45.0-59.9 66 34.55 60 45.45
≥ 60.0 19 9.95 16 12.12
Marital status
Single 39 20.42 33 25.00 0.555**
Married 125 65.45 79 59.85
Others 27 14.14 20 15.15
Level of education
High school (incomplete) 12 6.32 16 12.31 0.039**
College (incomplete) 66 34.74 54 41.54
College (complete) 112 58.95 60 46.15
BMI, kg/m²
18.0-24.9 33 17.28 38 28.79 0.008**
25.0-29.9 86 45.03 41 31.06
30.0-40.0 65 34.03 42 31.82
> 40.0 7 3.66 11 8.33
Neck circumference in cm, median (25th/75th percentiles) 42 (40/44) 37 (34/40) 0.0001* Self-reported morbidity
Angina or infarction 3 1.59 3 2.38 0.614**
Hypothyroidism 6 3.24 27 21.09 0.001**
Diabetes 13 6.99 12 9.52 0.418**
Asthma 20 10.70 14 11.11 0.908**
Depression 41 21.81 72 54.96 0.001**
Allergic rhinitis 51 27.27 58 44.27 0.002**
Gastroesophageal reflux 53 28.96 39 30.23 0.808**
Arterial hypertension 55 29.57 41 32.03 0.642**
aResults expressed as n (%), except where otherwise indicated. *Student’s t-test. *Chi-square test.
Table 2 - Gender comparison of polysomnographic measures in the patients evaluated.
Variable Men Women p*
Median 25th/75th percentiles
Median 25th/75th percentiles
Sleep efficiencya 91.14 85.63/96.04 88.91 81.38/93.59 0.0023
Sleep latencyb 12 6/28 19 8/41 0.0016
AHI, events/h 14.3 05.9/38.0 6.2 03.1/16.7 0.0001
Mean SpO2, % 93 92/95 94 92/96 0.0180
Minimum SpO2, % 83 70/88 85 77/89 0.0204
SpO2 < 90% 2.66 0.24/16.87 0.61 0.00/4.61 0.0002 AHI: apnea-hypopnea index. aTotal sleep time/total recording time × 100. bSleep induction time in minutes.
Discussion
In the present study, sleep apnea was diagnosed in more than two thirds of the study population, suggesting that clinical screening identified and eliminated most of the false-positive results. The prevalence of sleep apnea found in the present study was much higher than that reported in studies based on the general population, although it is similar to that reported in clinical studies of populations suspected of having this disease.(21,22)
The frequency of sleep apnea was significantly higher in male patients, the male/ female ratio being 1.43:1.00. More recent AHI. The equation of the final linear regression
model is described below:
log AHI = 4.5552 + [witnessed apnea ×
(0.5173)] + [BMI × (0.3803)] + [age × (0.2604)] + [neck circumference × (0.1071)] +
[allergic rhinitis × (−0.2510)]
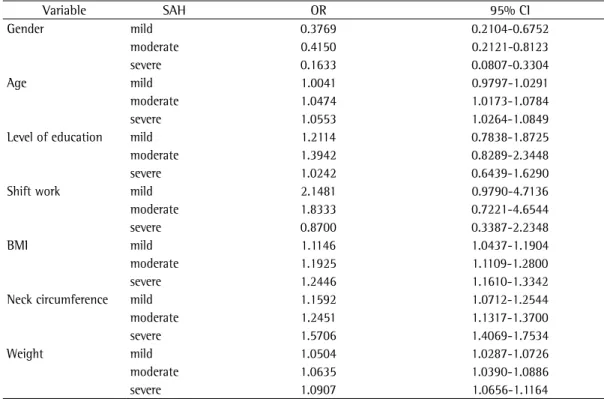
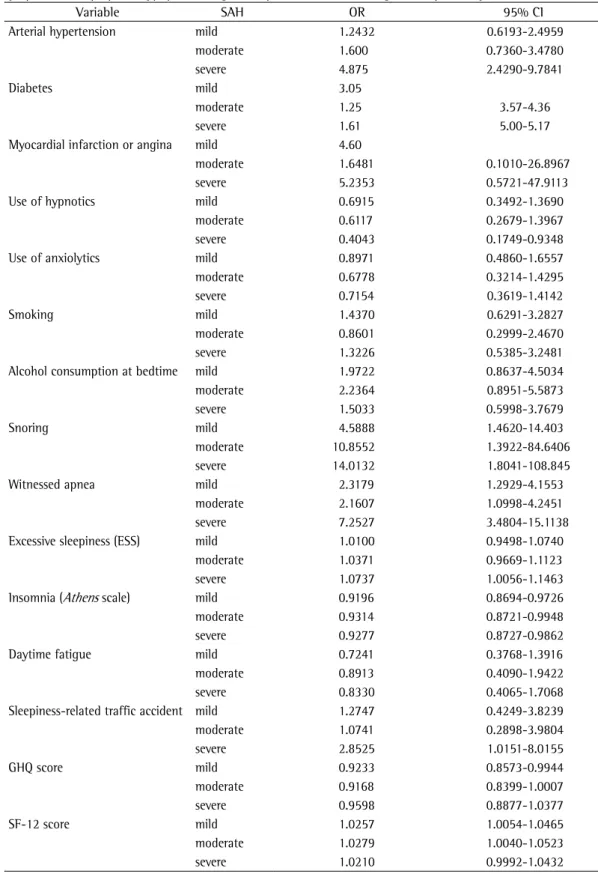
The multinomial logistic regression analysis (Tables 4 and 5), used for investigating the association of several independent variables with the severity of sleep apnea (mild, moderate, or severe), revealed that mild apnea was significantly associated with BMI and neck circumference, whereas severe apnea was associated with age, BMI, neck circumference, and witnessed apnea.
Table 3 - Sociodemographic and clinical characteristics of the groups of patients with and without sleep apnea,
as determined by polysomnography, using the apnea-hypopnea index cut-off point of 5 events/h.a
Variable Without apnea With apnea p
Gender 0.001*
Male 36 (18.85) 155 (81.15)
Female 57 (43.18) 75 (56.82)
Age. years 0.072*
18.0-29.9 17 (39.53) 26 (60.47)
30.0-44.9 38 (31.93) 81 (68.07)
45.0-59.9 33 (26.19) 93 (73.81)
≥ 60.0 05 (14.29) 30 (85.71)
Marital status 0.627*
Single 24 (33.33) 48 (66.67)
Married 56 (27.45) 148 (72.55)
Others 13 (27.66) 34 (72.34)
Level of education 0.636*
High school (incomplete) 10 (35.71) 18 (64.29)
College (incomplete) 36 (30.00) 84 (70.00)
College (complete) 47 (27.33) 125 (72.67)
BMI. kg/m² 0.001*
18.0-24.9 39 (54.93) 32 (45.07)
25.0-29.9 34 (26.77) 93 (73.23)
30.0-40.0 19 (17.76) 88 (82.24)
> 40.0 01 (05.56) 17 (94.44)
Neck circumference in cm, median (25th/75th percentiles) 38 (35/40) 42 (39/44) 0.001** Self-reported morbidity
Arterial hypertension 18 (18.75) 78 (81.25) 0.010*
Allergic rhinitis 36 (33.03) 73 (66.97) 0.245*
Angina or infarction 1 (16.67) 5 (83.33) 0.515*
Asthma 11 (32.35) 23 (67.65) 0.623*
Depression 32 (28.32) 81 (71.68) 0.879*
Hypothyroidism 7 (21.21) 26 (78.79) 0.312*
Diabetes 0 (0.00) 25 (100.00) 0.001*
Gastroesophageal reflux 26 (28.26) 66 (71.74) 0.883*
aResults expressed as n (%), except where otherwise indicated. *Chi-square test; p < 0.05. **Nonparametric
statistically significant factor in the final linear regression model, possibly due to the fact that gender was strongly associated with the variables that remained in the final model, especially BMI, neck circumference, and witnessed apnea.
The prevalence of obesity—overall obesity, as measured by BMI, and localized obesity, as estimated by neck circumference—was high in the study population. These two variables were also significant in predicting log AHI and were independently associated with sleep apnea of any level of severity, as shown in the multinomial regression model. In middle-aged adults, obesity is the major risk factor for sleep apnea.(5,26)
We found that sleep apnea was associated with hypertension and diabetes but not with other comorbidities or lifestyle. A population-based case-control study in which patients with sleep apnea were matched to controls for age, gender, zip code, and physician they had seen in the last 2 years revealed that treatment for cardiovascular diseases in general was more common among the patients with sleep apnea, as was treatment for arterial hypertension, congestive heart failure, cardiac arrhythmia, and chronic obstructive airway disease.(27) These
population-based studies have shown prevalence ratios ranging from 2:1 to 3:1.(23) One of the
hypotheses to explain this higher frequency in men is that the clinical presentation of sleep apnea is less typical in women and this would lead to underdiagnosis, which means that a gender bias is likely. The clinical presentation of sleep apnea is more typical in men, there being a higher frequency of snoring and witnessed apnea. The female population has less specific symptoms, such as depression, excessive sleepiness, and fatigue, which are often believed to have causes other than sleep apnea; this explains why these patients are less frequently referred for polysomnography. Studies of sleep apnea symptoms in clinical populations have shown that 40% of women with the disease report no witnessed apnea, nocturnal choking, or nonrestorative sleep, whereas most men do.(24)
Another group of authors, studying gender-related differences in sleep apnea and using the AHI cut-off point of 5 events/h for diagnosis, reported a prevalence of 9% for women and a prevalence of 24% for men.(25)
In the present study, sleep apnea was more common in men. However, gender was not a
Table 4 - Results of the univariate multinomial logistic regression analysis (sociodemographic aspects and
objective measures), sleep apnea-hypopnea being the dependent variable categorized by severity.
Variable SAH OR 95% CI
Gender mild 0.3769 0.2104-0.6752
moderate 0.4150 0.2121-0.8123
severe 0.1633 0.0807-0.3304
Age mild 1.0041 0.9797-1.0291
moderate 1.0474 1.0173-1.0784
severe 1.0553 1.0264-1.0849
Level of education mild 1.2114 0.7838-1.8725
moderate 1.3942 0.8289-2.3448
severe 1.0242 0.6439-1.6290
Shift work mild 2.1481 0.9790-4.7136
moderate 1.8333 0.7221-4.6544
severe 0.8700 0.3387-2.2348
BMI mild 1.1146 1.0437-1.1904
moderate 1.1925 1.1109-1.2800
severe 1.2446 1.1610-1.3342
Neck circumference mild 1.1592 1.0712-1.2544
moderate 1.2451 1.1317-1.3700
severe 1.5706 1.4069-1.7534
Weight mild 1.0504 1.0287-1.0726
moderate 1.0635 1.0390-1.0886
severe 1.0907 1.0656-1.1164
Table 5 - Results of the univariate multinomial logistic regression analysis (comorbidities, habits, signs, and
symptoms), sleep apnea-hypopnea being the dependent variable categorized by severity.
Variable SAH OR 95% CI
Arterial hypertension mild 1.2432 0.6193-2.4959
moderate 1.600 0.7360-3.4780
severe 4.875 2.4290-9.7841
Diabetes mild 3.05
moderate 1.25 3.57-4.36
severe 1.61 5.00-5.17
Myocardial infarction or angina mild 4.60
moderate 1.6481 0.1010-26.8967
severe 5.2353 0.5721-47.9113
Use of hypnotics mild 0.6915 0.3492-1.3690
moderate 0.6117 0.2679-1.3967
severe 0.4043 0.1749-0.9348
Use of anxiolytics mild 0.8971 0.4860-1.6557
moderate 0.6778 0.3214-1.4295
severe 0.7154 0.3619-1.4142
Smoking mild 1.4370 0.6291-3.2827
moderate 0.8601 0.2999-2.4670
severe 1.3226 0.5385-3.2481
Alcohol consumption at bedtime mild 1.9722 0.8637-4.5034
moderate 2.2364 0.8951-5.5873
severe 1.5033 0.5998-3.7679
Snoring mild 4.5888 1.4620-14.403
moderate 10.8552 1.3922-84.6406
severe 14.0132 1.8041-108.845
Witnessed apnea mild 2.3179 1.2929-4.1553
moderate 2.1607 1.0998-4.2451
severe 7.2527 3.4804-15.1138
Excessive sleepiness (ESS) mild 1.0100 0.9498-1.0740
moderate 1.0371 0.9669-1.1123
severe 1.0737 1.0056-1.1463
Insomnia (Athens scale) mild 0.9196 0.8694-0.9726
moderate 0.9314 0.8721-0.9948
severe 0.9277 0.8727-0.9862
Daytime fatigue mild 0.7241 0.3768-1.3916
moderate 0.8913 0.4090-1.9422
severe 0.8330 0.4065-1.7068
Sleepiness-related traffic accident mild 1.2747 0.4249-3.8239
moderate 1.0741 0.2898-3.9804
severe 2.8525 1.0151-8.0155
GHQ score mild 0.9233 0.8573-0.9944
moderate 0.9168 0.8399-1.0007
severe 0.9598 0.8877-1.0377
SF-12 score mild 1.0257 1.0054-1.0465
moderate 1.0279 1.0040-1.0523
severe 1.0210 0.9992-1.0432
general population not submitted to clinical screening.
References
1. Kushida CA, Littner MR, Morgenthaler T, Alessi CA, Bailey D, Coleman J Jr, et al. Practice parameters for the indications for polysomnography and related procedures: an update for 2005. Sleep. 2005;28(4):499-521. 2. Tufik S, Santos-Silva R, Taddei JA, Bittencourt LR.
Obstructive sleep apnea syndrome in the Sao Paulo Epidemiologic Sleep Study. Sleep Med. 2010;11(5):441-6. 3. Bearpark H, Elliott L, Grunstein R, Cullen S, Schneider H,
Althaus W, et al. Snoring and sleep apnea. A population study in Australian men. Am J Respir Crit Care Med. 1995;151(5):1459-65.
4. Peppard PE, Young T, Palta M, Dempsey J, Skatrud J. Longitudinal study of moderate weight change and sleep-disordered breathing. JAMA. 2000;284(23):3015-21. 5. Pack AI. Advances in sleep-disordered breathing. Am J
Respir Crit Care Med. 2006;173(1):7-15.
6. Somers VK, Dyken ME, Clary MP, Abboud FM. Sympathetic neural mechanisms in obstructive sleep apnea. J Clin Invest. 1995;96(4):1897-904.
7. Row BW, Liu R, Xu W, Kheirandish L, Gozal D. Intermittent hypoxia is associated with oxidative stress and spatial learning deficits in the rat. Am J Respir Crit Care Med. 2003;167(11):1548-53.
8. O’Donnell CP, Ayuse T, King ED, Schwartz AR, Smith PL, Robotham JL. Airway obstruction during sleep increases blood pressure without arousal. J Appl Physiol. 1996;80(3):773-81.
9. Poyares D, Cintra FD, dos Santos FM, de Paola A. Complicações cardiovasculares da SAHOS: implicações e mecanismos modulatórios do sistema nervoso autônomo. In: Tufik S, editor. Medicina e biologia do sono. Barueri: Manole; 2008. p. 298-305.
10. Shahar E, Whitney CW, Redline S, Lee ET, Newman AB, Javier Nieto F, et al. Sleep-disordered breathing and cardiovascular disease: cross-sectional results of the Sleep Heart Health Study. Am J Respir Crit Care Med. 2001;163(1):19-25.
11. Togeiro SM, Smith AK. Métodos diagnósticos nos distúrbios do sono. Rev Bras Psiquiatr. 2005;27(Suppl 1):8-15.
12. Deegan PC, McNicholas WT. Predictive value of clinical features for the obstructive sleep apnoea syndrome. Eur Respir J. 1996;9(1):117-24.
13. Kushida CA, Efron B, Guilleminault C. A predictive morphometric model for the obstructive sleep apnea syndrome. Ann Intern Med. 1997;127(8 Pt 1):581-7. 14. Ramachandran SK, Josephs LA. A meta-analysis of
clinical screening tests for obstructive sleep apnea. Anesthesiology. 2009;110(4):928-39.
15. Johns MW. A new method for measuring daytime sleepiness: the Epworth sleepiness scale. Sleep. 1991;14(6):540-5.
16. Johns MW. Reliability and factor analysis of the Epworth Sleepiness Scale. Sleep. 1992;15(4):376-81.
17. Bertolazi AN, Fagondes SC, Hoff LS, Pedro VD, Menna Barreto SS, Johns MW. Portuguese-language version of the Epworth sleepiness scale: validation for use in Brazil. J Bras Pneumol. 2009;35(9):877-83.
18. Sociedade Brasileira de Cardiologia [homepage on the Internet]. São Paulo: Sociedade Brasileira de
findings are similar to ours in terms of arterial hypertension. Our finding that, in the final model, sleep apnea did not correlate with the remaining comorbidities can be explained by a lack of statistical power, due to the small number of cases.
Our linear regression model for predicting log AHI explained 39% of the variation in the variable “response”. The use of upper-airway anatomical findings, identified by physical examination, as has been done in some previous studies but not in the present study, might have increased the efficiency of these models.
After adjusting for the various confounding variables in the multinomial logistic regression, we found that age, BMI, neck circumference, and witnessed apnea remained statistically associated with mild, moderate, or severe sleep apnea, BMI being the variable with the greatest strength of association for all degrees of severity. There have been several attempts to predict sleep apnea without the use of polysomnography. Those models differ in terms of the variables included and the case definitions, making it difficult to compare the results across studies.(12,13,27,28)
The use of multiple regression analyses with the inclusion of clinical variables has produced good prediction models. In a prospective study evaluating four AHI prediction models, their sensitivity was found to be high (85-98%), although their specificity was low (33-39%).
(29) The variables included in those models were
witnessed apnea, arterial hypertension, BMI, age, snoring, neck circumference, and gender.(30)
24. Ambrogetti A, Olson LG, Saunders NA. Differences in the symptoms of men and women with obstructive sleep apnoea. Aust N Z J Med. 1991;21(6):863-6.
25. Lin CM, Davidson TM, Ancoli-Israel S. Gender differences in obstructive sleep apnea and treatment implications. Sleep Med Rev. 2008;12(6):481-96.
26. Banno K, Kryger MH. Sleep apnea: clinical investigations in humans. Sleep Med. 2007;8(4):400-26.
27. Smith R, Ronald J, Delaive K, Walld R, Manfreda J, Kryger MH. What are obstructive sleep apnea patients being treated for prior to this diagnosis? Chest. 2002;121(1):164-72.
28. Crocker BD, Olson LG, Saunders NA, Hensley MJ, McKeon JL, Allen KM, et al. Estimation of the probability of disturbed breathing during sleep before a sleep study. Am Rev Respir Dis. 1990;142(1):14-8.
29. Dixon JB, Schachter LM, O’Brien PE. Predicting sleep apnea and excessive day sleepiness in the severely obese: indicators for polysomnography. Chest. 2003;123(4):1134-41.
30. Rowley JA, Aboussouan LS, Badr MS. The use of clinical prediction formulas in the evaluation of obstructive sleep apnea. Sleep. 2000;23(7):929-38.
Cardiologia [cited 2007 Jan 10]. V Diretrizes Brasileiras de Hipertensão Pulmonar. Available from: http://www. departamentos.cardiol.br/dha/vdiretriz/vdiretriz.asp 19. Royston JB. Some techniques for assessing
multivariate based on the Shapiro-Wilk W. Appl Statist. 1983;32(2):121-33.
20. Bollen KA, Long JS, editors. Testing Structural Equation Models. Newbury Park: Sage Publications; 1993. 21. Young T, Palta M, Dempsey J, Skatrud J, Weber
S, Badr S. The occurrence of sleep-disordered breathing among middle-aged adults. N Engl J Med. 1993;328(17):1230-5.
22. Daltro CH, Fontes FH, Santos-Jesus R, Gregorio PB, Araújo LM. Obstructive sleep apnea and hypopnea syndrome (OSAHS): association with obesity, gender and age [Article in Portuguese]. Arq Bras Endocrinol Metabol. 2006;50(1):74-81.
23. Kapsimalis F, Kryger MH. Gender and obstructive sleep apnea syndrome, part 1: clinical features. Sleep. 2002;25(4):409-16.
About the authors
Silvio Musman
Pulmonologist. Júlia Kubitschek Hospital, Fundação Hospitalar do Estado de Minas Gerais – FHEMIG, Hospital Foundation of the state of Minas Gerais – Belo Horizonte, Brazil.
Valéria Maria de Azeredo Passos
Associate Professor. Department of Clinical Medicine, Federal University of Minas Gerais School of Medicine, Belo Horizonte, Brazil.
Izabella Barreto Romualdo Silva
Medical Student. Federal University of Minas Gerais School of Medicine, Belo Horizonte, Brazil.
Sandhi Maria Barreto