MET Gene Amplification and MET Receptor
Activation Are Not Sufficient to Predict
Efficacy of Combined MET and EGFR
Inhibitors in EGFR TKI-Resistant NSCLC Cells
Dario Presutti1, Simonetta Santini1, Beatrice Cardinali1, Giuliana Papoff1, Cristiana Lalli1, Simone Samperna1, Valentina Fustaino1, Giuseppe Giannini2, Giovina Ruberti1*
1Institute of Cell Biology and Neurobiology, National Research Council, Campus Adriano Buzzati-Traverso, Monterotondo (Roma), Italy,2Department of Experimental Medicine, University La Sapienza, Roma, Italy
Abstract
Epidermal growth factor receptor (EGFR), member of the human epidermal growth factor receptor (HER) family, plays a critical role in regulating multiple cellular processes including proliferation, differentiation, cell migration and cell survival. Deregulation of the EGFR signal-ing has been found to be associated with the development of a variety of human malignancies including lung, breast, and ovarian cancers, making inhibition of EGFR the most promising molecular targeted therapy developed in the past decade against cancer. Human non small cell lung cancers (NSCLC) with activating mutations in theEGFRgene frequently experience significant tumor regression when treated with EGFR tyrosine kinase inhibitors (TKIs), although acquired resistance invariably develops. Resistance to TKI treatments has been associated to secondary mutations in theEGFRgene or to activation of additional bypass sig-naling pathways including the ones mediated by receptor tyrosine kinases, Fas receptor and NF-kB. In more than 30–40% of cases, however, the mechanisms underpinning drug-resis-tance are still unknown. The establishment of cellular and mouse models can facilitate the unveiling of mechanisms leading to drug-resistance and the development or validation of novel therapeutic strategies aimed at overcoming resistance and enhancing outcomes in NSCLC patients. Here we describe the establishment and characterization of EGFR TKI-resistant NSCLC cell lines and a pilot study on the effects of a combined MET and EGFR inhibitors treatment. The characterization of the erlotinib-resistant cell lines confirmed the association of EGFR TKI resistance with loss ofEGFRgene amplification and/or AXL overex-pression and/orMETgene amplification and MET receptor activation. These cellular models can be instrumental to further investigate the signaling pathways associated to EGFR TKI-resistance. Finally the drugs combination pilot study shows thatMETgene amplification and MET receptor activation are not sufficient to predict a positive response of NSCLC cells to a cocktail of MET and EGFR inhibitors and highlights the importance of identifying more reliable biomarkers to predict the efficacy of treatments in NSCLC patients resistant to EGFR TKI.
OPEN ACCESS
Citation:Presutti D, Santini S, Cardinali B, Papoff G, Lalli C, Samperna S, et al. (2015) MET Gene Amplification and MET Receptor Activation Are Not Sufficient to Predict Efficacy of Combined MET and EGFR Inhibitors in EGFR TKI-Resistant NSCLC Cells. PLoS ONE 10(11): e0143333. doi:10.1371/ journal.pone.0143333
Editor:Jung Weon Lee, Seoul National University, REPUBLIC OF KOREA
Received:July 31, 2015
Accepted:November 3, 2015
Published:November 18, 2015
Copyright:© 2015 Presutti et al. This is an open access article distributed under the terms of the Creative Commons Attribution License, which permits unrestricted use, distribution, and reproduction in any medium, provided the original author and source are credited.
Data Availability Statement:All relevant data are within the paper and its Supporting Information files.
Funding:GR was partially funded by Project FaReBio di Qualità, a grant from the Italian Ministry of Economy and Finance to the CNR and the CNR Project“Personalised Medicine”. The funders had no role in study design, data collection and analysis, decision to publish, or preparation of the manuscript.
Introduction
Epidermal growth factor receptor (EGFR), member of the human epidermal growth factor receptor (HER) family controls key cellular programs, including survival, proliferation, differ-entiation and migration during development and adult life [1,2].EGFRgene is either mutated or shows altered expression in a variety of human cancers. Lung is the most frequent cause of cancer-related mortality worldwide leading to over a million deaths each year [3]. Based on his-tological characteristics, the two principal types of human lung cancer are small cell lung can-cer (SCLC) and non small cell lung cancan-cer (NSCLC); the latter being the most commonly detected type contributing to nearly 85% of cases. Identification of all driver oncogene alter-ations in lung adenocarcinoma and consequently adoption of molecular target therapies is challenging because of a large burden of passenger events per tumor genome [4–7]. NSCLC patients, whose tumors harbor EGFR sensitizing mutations in exon 19/21, get a meaningful clinical benefit from EGFR TKI treatments. However, despite an initial response to these inhib-itors, most patients ultimately develop drug resistance, followed by relapses [8–18]. Several clinical studies have shown that a secondary mutation in the tyrosine kinase domain of EGFR (T790M) is responsible for the development of resistance to EGFR-targeting TKIs in approxi-mately half of the cases of lung adenocarcinoma [19–21]. Acquired NSCLC resistance to TKIs has also been associated to overexpression and activation of other receptor tyrosine kinases (RTKs) including HER3, AXL or MET [22–26], to modulation of Fas receptor and NF-kB sig-naling pathways [27] and to epithelial to mesenchymal transition (EMT) [28–30].
The MET receptor and its ligand, hepatocyte growth factor (HGF), have recently been iden-tified as novel promising targets in several human malignancies, including NSCLC. MET receptor mediates multiple biological responses promoting tissue remodeling, wound repair, organ homeostasis and cancer metastasis. In several solid tumors,METgene amplification, mutations or overexpression lead to constitutively activated MET receptor [31,32].MET amplification occurs in 5–20% of NSCLC patients and its amplification or up-regulation corre-lates with acquired resistance to EGFR TKI treatments [25,26,33]. MET amplification can occur in NSCLC also before treatment with TKIs [34]. For all above reasons MET could become a valuable target for cancer therapy and several drugs targeting MET or its ligand HGF are currently undergoing early phase clinical trials in various cancers [35–37].
The identification of model systems to investigate or validate strategies to disrupt EGFR-dependent tumor cell growth is critical and may provide the basis for clinical applications. Therefore we decided, as others, to develop and characterize NSCLC cell lines resistant to EGFR TKIs. In our cellular model system we observed, as previously reported, association of EGFR TKI-resistance with loss of EGFR mutated allele amplification and/or AXL overexpres-sion and/orMETgene amplification and MET receptor activation. Moreover, we demonstrated thatMETgene amplification and MET receptor activation are not sufficient to predict a posi-tive effect of a combination of MET and EGFR inhibitors in erlotinib resistant NSCLC, suggest-ing the need of identifysuggest-ing other biomarkers in order to move towards a precision medicine treatment in NSCLC patients.
Material and Methods
Material
inactivated 10% fetal bovine serum (FBS) (Sigma-Aldrich). All cells were cultured at 37°C in a 5% CO2humidified incubator. Erlotinib (ERL)-resistant cell lines (RA1, RA2, RB1, RB1.1, RB2
and RC2.2) established essentially as previously described [29] were cultured in the same experimental conditions. Briefly, HCC827 and HCC4006 parental cell lines were cultured in complete tissue culture medium with a stepwise increase of erlotinib concentrations (stepwise method), or a high concentration of erlotinib (1μM) (high-concentration method) over 5–6
months.
The primary antibodies: EGFR (clone D09, kindly provided by O. Segatto); phosphorylated-EGFR (Tyr1068); HER2/ErbB2 (D8F12); HER3/ErbB3 (D22C5); HER4/ErbB4 (111B2); phos-pho-HER2/ErbB2 (Y1221/1222) (6B12); HER3/ErbB3 (Y1289) (D1B5); phospho-HER4/ErbB4 (Y1284) (21A9); p44-42 MAPK (ERK1/2) (#9102), phospho-p44-42 MAPK (ERK1/2) (T202/Y204) clone E10; c-MET (D1C2); phospho-c-MET (Y1234/1235) (D26); Akt and phospho-Akt (S473), clone D9E were from Cell Signaling Technology (CST); AXL (#AF154) and phospho-AXL (Y779) (#AF228) were from R&D Systems; GAPDH, clone 1D4 or #5174 was respectively from Novus Biologicals or CST. Secondary antibodies: goat rab-bit IgG (H+L)-HRP and goat mouse IgG (H+L)-HRP were from Bio-Rad; donkey anti-goat IgG-HRP (sc 2020) was from Santa Cruz Biotechology; streptavidin Alexa Fluor-488 were from Life Technologies. Biotin-labeled horse anti-rabbit Ig was from Vector Laboratories Bur-lingame, CA, USA. Tyrosine kinase inhibitors: Erlotinib Hydrochloride Salt, gefitinib Free Base, Vandetanib Free Base Lapatinib, Imatinib and Paclitaxel were from LC Laboratories, USA; SU11274, PHA-665752 hydrate and PF-04217903 were from Sigma-Aldrich, AZD9291, Rociletinib (CO-1686, AVL-301) and R428 (BGB324) were from Selleckchem and distributed by DBA Italia. Stock solutions of 10 mM for all inhibitors were prepared in DMSO and stored at -20°C or -80°C. MTT, 3-(4,5-methylthiazol-2-yl)-2,5-diphenyltetrazolium bromide was from Sigma-Aldrich. MTT stock solution (5 mg/ml in H2O, sterilized by filtration) was stored
at 4°C for 1 months. Power SYBR Green PCR Master Mix was from Applied Biosystems. TRI-zol reagent was from Life Technologies, Reverse Transcription System was from Promega.
Methods
Cell growth inhibition MTT assay. Cells (10–20.000 cells/well) plated in 96-well plates at day 0 were treated at day 1 with increasing concentrations of TKIs (from 64 pM up to 10– 20μM if not otherwise stated) in complete tissue culture medium and cultured for 72 hours at
37°C in 5% CO2. Next, cells were gently washed with 1x PBS, incubated for 4 hours with MTT
and processed for color detection with DMSO. The resulting purple solution was spectrophoto-metrically measured at 570 nm as previously described [38–39]. The optical density values, obtained by MTT assay reading, of cells treated with drugs were expressed as percentage of cell survival and normalized with the value of cells treated with vehicle (DMSO). For the EGFR stimulation, serum starved cells (24 hours) were treated, in RPMI supplemented medium, with EGF (100 ng/ml) or vehicle (DMSO) for 8 minutes or 100 nM erlotinib for 30 minutes, 1–3 hours. Next, cells were harvested in 1x PBS supplemented with 0.5 mM Na3VO4.
Western blot analysis. Total cell lysates were prepared by rinsing the cells 2 times in ice cold PBS 1x and by using ice-cold RIPA buffer (50 mM Tris-HCl pH 7.5, 150 mM NaCl, 1% NP40, 0.25% sodium deoxycholate, 1 mM EDTA) containing a combination of protease and phosphatase inhibitors (1μg/ml aprotinin, 2μg/ml leupeptin, 10 mM NaF, 20 mMβ
-glicero-phosfate, 10 mM Na pyrophosphate, 1 mM PMSF, 1 mM Na3VO4). EGFR stimulated cells
Cell lysates (25–40μg) were separated by 8–10% SDS-PAGE and transferred to
nitrocellu-lose membranes 0.45μm (GE Healthcare Life Sciences). The membranes were blocked with 5%
non-fat milk in 1x TBS pH 7.6–8.0 containing 0.1 or 0.2% Tween 20 (TBST) or 2% BSA (Sigma-Aldrich) for 2 hour at room temperature (RT) and subsequently probed with primary antibodies in 5% non-fat milk or 2–5% BSA in TBST, as recommended by the manufacturer, overnight at 4°C. Then membranes were washed 10 minutes for 3 times with TBST and probed with horseradish peroxidase-conjugated secondary antibodies in 5% non-fat milk in TBST for 1 hour at RT. Chemidoc XRS Bio-Rad was used for images acquisition with a chemi-lumines-cent camera, band signals were quantified using ImageLab 4.0 Bio-Rad software.
Soft agar assays. Soft agar assays were performed essentially as previously described [40]. Briefly 1.5 ml of 0.7% of Bacto-Agar (Becton Dickinson) in RPMI medium was plated in 35 mm petri dishes (bottom layer). Next, cells (20.000 cells/plate), in 0.35% Bacto-Agar, were plated on each bottom layer (top layer). Cells were cultured at 37°C in a 5% CO2humidified
incubator for 2–3 weeks. Plates were stained with a 0.005% crystal violet/20% methanol solu-tion and images recorded with an Olympus XM10 camera and processed using Olympus Cell-Sens Standard 1.8.1 software. Finally colonies with a diameter>50μm were counted with the ImageJ software. The percentage of colony forming efficiency (CFE) was calculated according to the formula: (number of colonies formed/number of cells seeded) x 100. Approximately 500–1000 colonies/plates; 4/7 plates for each cell lines were recorded and analysed by Image J software.
Ethics statement. All animal studies were carried out in accordance to experimental pro-tocols as reviewed and approved by the CNR-IBCN animal care and use committee and the Public Veterinary Health Department of the Italian Ministry of Health (Rome, Italy) (IBCN-CNR–0003357) according to the ethical and safety rules and guidelines for the use of animals in biomedical research provided by the relevant Italian laws and European Union’s directives.
Xenograft in nude mice. Athymic nude female mice (Foxn1nu/Foxn1+) (Harlan Laborato-ries) were housed in individually ventilated cages (IVC) under controlled conditions (20–22°C; 55–65% relative humidity; 12/12 hours light/dark cycle; irradiated standard diet and waterad libitum). To generate tumor xenografts, groups of 3–5 mice 5–10 weeks old were injected sub-cutaneously with NSCLC tumor cells (5–15 x 106cells in 200μl 1x PBS) into the dorsal flanks
of each mouse. Two independent experiments were performed with each NSCLC cell line. Tumor volume was calculated by caliper measurements of tumor length (L) and width (W) according to the formula: LxW2/2. Tumor size and body weight were measured twice per week. Differences in tumor sizes formed on both flanks of mice injected with erlotinib resistant cell lines were compared to their parental counterpart. To evaluate time to fold tumor volume increase, normalization of tumor volumes was done to the average tumor volume at day 3, within the experiment and across xenograft groups. Times to four and six fold increase from initial tumor volumes (day 3) were assessed. When the tumor volumes reached an average of approximately 0.6–0.8 cm3mice, previously euthanized with intra-peritoneal injections of Tile-tamine/Zolazepam (800 mg/kg) and Xylazine (100 mg/kg), were sacrificed and tumors were harvested, measured, photographed, and pathologically examined.
Excised tumors were fixed with 3.7% paraformaldehyde (PFA) (wt/vol) 1x PBS for 20 min at room temperature and then embedded in paraffin. Serial sections 8μm thick were cut from
blocking buffer (1× PBS, 0.1% Triton X-100, 1% BSA, 4% donkey serum) for 1 h and then incu-bated overnight at 4°C with primary antibodies diluted in blocking buffer. The following day slides were washed three times with washing buffer (1× PBS, 0.1% Triton X-100), incubated with biotinylated anti-Ig secondary antibody for 5 h followed by streptavidin Alexa 488, and finally washed as before and mounted using Mowiol 4–88 mounting media. Nuclei were stained using Hoechst 33258 (Sigma Aldrich). For xenograft studies, all tumors were also stained with the omission of primary antibody as a negative control. For confocal analysis Argon ion laser at 488 nm and blue diode laser at 405 were used as excitation sources. Confocal Z-stacks were collected at 0.5μm intervals to a total optical depth of 8–10 xm. Confocal images
were processed with Volocity (Improvision, Perkin Elmer) and Adobe Photoshop CS4 software for image rendering and representation of x/y view. Images for direct comparison were col-lected under same parameters and representative images were chosen.
Genomic DNA preparation. Cell pellets (approximately 10x106cells) were lysed in 10 mM Tris-HCl pH 8.0, 200 mM NaCl, 2 mM EDTA pH 8.0. Then lysates were brought to 400 mM NaCl, 0.6% SDS, 300μg/ml proteinase K and incubated overnight at 55°C in water
bath. Saturated NaCl (0.3 volumes) was added and the samples were vigorously mixed followed by spinning at 14000 rpm at 4°C for 15 minutes. The supernatant was precipitated and the DNA dissolved in TE buffer (10 mM Tris-HCl pH 7.5, 1 mM EDTA). Afterwards genomic DNA was treated with RNAse A to remove contaminant RNA. Genomic DNA was incubated in 300μl of TE buffer and 15μl of RNAse A (1μg/μl) in a 65°C water bath for 10 minutes.
Then, RNAse A was precipitated with 0.4 volumes of 7.5 M ammonium acetate for 30 minutes at 4°C, centrifuged at 13000 rpm for 30 minutes at 4°C. The supernatant was precipitated with absolute ethanol. After washes with 70% ethanol, genomic DNA was resuspended in TE buffer.
Mutation analysis by direct sequencing. EGFR exons 19 and 20 and KRAS exons 2 and 3 were amplified by PCR (for primer pairs seeS1 Table). Amplified products were then purified using Exostar 1-Step (VWR International) according to the manufacturer's instructions. Sequencing reactions were performed using the Big Dye Terminator version 3.1 (Applied Bio-systems, Foster City, CA, USA). Dye purification was carried out by Centrisep Spin columns (Princeton Separation) and subsequent sequencing analysis was resolved on a 3130XL Genetic Analyzer (Applied Biosystems). Sequences were finally analyzed with Sequence Analysis v5.2 and SeqScape v2.5 (Applied Biosystems).
Relative quantitation of gene copy number. Differences in EGFR andMETgene copy number between ERL-resistant and parental cell lines were determined by quantitative real-time PCR (qPCR) using an Applied Biosystems 7500 Fast Real-Time PCR System (Applied Biosystems). PCRs were carried out in 20μl volume containing 5 ng of genomic DNA, 200 nM
each primer forMET,EGFRandRibonuclease P(RNase P), in independent reactions (S1 Table) and 1x Power SYBR Green PCR Master Mix (Applied Biosystems). PCRs for each primer set were performed in triplicate, and mean values were calculated. Quantification was based on the standard curve method.RNase Pwas used as a reference gene, to normalize quan-titation of target genes for differences in the amount of total DNA in each sample. Genomic DNA of HCC827 and HCC4006 parental cell line were used as calibrator samples, relative to which differences in gene copy number have been calculated. The data were analyzed using SDS (Ver. 1.4) software (Applied Biosystems).
RNA analysis. For quantitative RT-PCR analysis, total RNA was extracted using the TRI-zol (Life Techologies) reagent and retro-transcribed with the Reverse Transcription System (Promega) using oligo (dT) and random primers. qPCR analysis was performed using a 7500 Fast Real-Time PCR System (Applied Biosystems). PCRs were carried out in 20μl volume
normalize quantitation of target genes for differences in the amount of total RNA in each sam-ple. Total RNA of HCC827 and HCC4006 parental cell lines were used as calibrator samples, relative to which differences in the RNA amount of resistant cell lines have been calculated. The data were analyzed using SDS (Ver. 1.4) software (Applied Biosystems).
Drug combination studies and synergy quantification. The synergy of erlotinib and MET or erlotinib and AXL inhibitors was evaluated by the Chou-Talalay method [41,http:// www.combosyn.com]. In brief, the cells were treated with 8–12 concentrations of erlotinib each in combination with 8–12 concentrations of MET or AXL inhibitors. In particular the ratio of erlotinib with SU11274 was 1:4, while the ratio of erlotinib with PHA-665752 or PF-04217903 was 1:1. The ratio of erlotinib with the AXL inhibitor was 10:1 as previously reported [42]. Erlotinib was used at a concentration approximately equal to its IC50in HCC827 cell line
and at concentrations within 5-fold increments above or below. Each drug was also used alone at the same concentrations. Cell survival was determined by MTT assays. Each data point was performed in triplicates. The CompuSyn software (ComboSyn Inc., Paramus, NJ) was used to determine dose-effect curves for single and combination treatments. Further, combination index (CI) values were calculated to assess the nature of drug interactions that can be, additive (CI = 1), antagonistic (CI>1) or synergistic (CI<1). In particular, nonlinear regression tren-dlines were used to calculate CI. Single and combination dose response curves were entered into CompuSyn software and the following equation was used: [(D1/Dx1)+(D2/Dx2)], in which Dx1 is the dose of Drug 1 that inhibits cell survival at x% and Dx2 is the dose of Drug 2 that inhibits cell survival at x% and D1 is the portion of Drug 1 that also inhibits cell survival at x% in combination with Drug 2 and vice versa. The doses which produced a particular effect (Dx) can be calculated from the Median effect equation: Dx = Dm [fa/1-fa)]1/m, where,Dm,fa
andfu(1-fa) represent: the median dose, fraction affected and fraction unaffected, respectively.
Dmwas estimated from the antilog of theX-intercept of the median effect plot, whereX= log (D) versusY= log (fa/fu); which meansDm= 10−(Y-intercept)/m,mbeing the slope of the median
effect plot.
Statistical analysis. GraphPad Prism software 6.0c was used for MTT data analysis. The regression trendline were fitted using a non-linear regression method and IC50values were
determined using a sigmoidal dose response inhibition variable slope method.
In the drug combination studies, dose–effect curve parameters, CI values, Fa-CI plot (plot representing CI versus Fa, the fraction affected by a particular dose) were calculated by Com-puSyn program (Compusyn Inc, Paramus, NJ, USA).
In the xenograft experiments the statistical significance of the results was evaluated by two way analysis of variance and Bonferroni multiple testing to compare differences in tumor fold growth between ERL-resistant and HCC827 parental cell line. All statistical tests were per-formed using GraphPad Prism and the threshold for statistical significance was set at P-values lower than 0.05.
Results and Discussion
Establishment of erlotinib resistant NSCLC cell lines
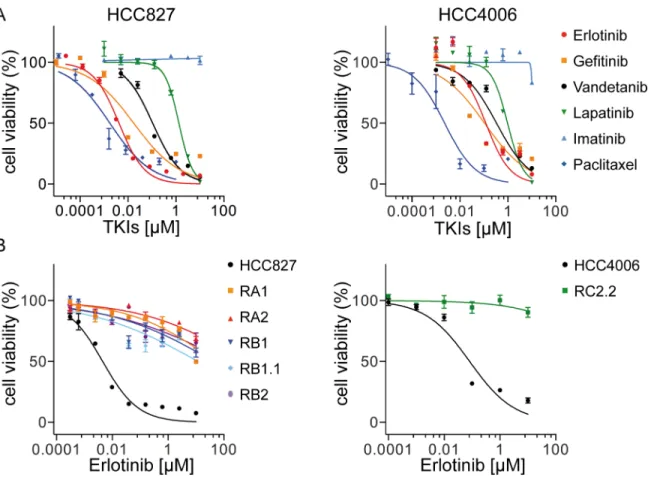
In order to investigate mechanisms leading to resistance to EGFR-targeted therapy, two NSCLC cell lines HCC827 and HCC4006 were used to derivein vitromodels of acquired resis-tance to theEGFRTKI, erlotinib. Both cell lines harbor EGFR activating mutations in the tyro-sine kinase domain, the HCC827 cell line a deletion in exon 19 (ΔE746-A750) and HCC4006 a deletion (ΔL747-E749) and a point mutation (A750P) in exon 19. HCC827 and HCC4006 cell lines are both highly sensitive to TKIs targeting the EGFR. TKI dose-response curves and IC50
[43] and gefitinib [44] with an IC50in line with previous reports [26,45]. Paclitaxel, a member
of the taxane family and an important agent in cancer chemotherapy that acts by binding to microtubules and interfering with the mitotic process, was used as positive control [46]. Sensi-tivity to vandetanib [47–49] and to a lesser extent to lapatinib [50], TKIs targeting respectively VEGFR (Vascular Endothelial Growth Factor Receptor)/EGFR/RET and EGFR/HER2, was also observed. Imatinib, targeting mainly ABL, PDGFR (Platelet Derived Growth Factor Fig 1. Cell inhibition growth analysis of ERL-resistant NSCLC cell lines.A) Representative dose-effect curve plots of HCC827 and HCC4006 parental cell lines to the indicated TKIs. Cell viability was determined by MTT assays. The results are expressed as the percentage of cell viability in drug-treated cultures relative to DMSO-treated control samples; B) Dose effect curve plots of derived ERL-resistant HCC827 and HCC4006 cell lines. The results are expressed as described above. Data (mean±s.e.m) in A and B are representative of more than three independent experiments.
doi:10.1371/journal.pone.0143333.g001
Table 1. IC50values of TKIs against parental and ERL-resistant NSCLC cell lines.
HCC827 RA1 RA2 RB1 RB1.1 RB2 HCC4006 RC2.2
Erlotinib 4–17 nM >10μM >10μM >10μM >10μM >10μM 80–200 nM >10μM
Gefitinib 4–20 nM >10μM >10μM >10μM >10μM >10μM 25–107 nM >10μM
AZD9291 0.4–10 nM >1μM >1μM >1μM >1μM >1μM 1–8 nM >1μM
Rociletinib 12–32 nM >1μM >1μM >1μM >1μM >1μM 100–195 nM >1μM
Vandetanib 70–180 nM >10μM >10μM >10μM >10μM >10μM 310–390 nM >10μM
Lapatinib 0.5–1.7μM >10μM >10μM >10μM >10μM >10μM 0.65–1.85μM >10μM
Imatinib >1μM - - - >1μM
-Paclitaxel 0.1–2 nM 1–4 nM >1μM 1–4 nM 0.1–2 nM 1–5 nM 0.1–4 nM >1μM
Receptor) and c-KIT [51–53] had no effect on both HCC827 and HCC4006 cell lines (Fig 1 andTable 1).
It has been suggested that the features of drug-resistant cells may vary depending on the pro-tocol used for the selection process [29]. Therefore we derived resistant cell lines by exposing HCC827 and HCC4006 cell lines (parental) to erlotinib for 5–6 months, following two distinct protocols essentially as previously described [29]. Briefly, in“protocol 1”, cells were exposed to increasing concentrations of erlotinib (2x IC50−25/50x IC50), while in“protocol 2”cells were
con-tinuously exposed to a high dose of erlotinib (1μM). The selection outcomes were monitored
periodically by cell growth inhibition assays by using cells in“drug holiday”for at least 1 week. Five erlotinib (ERL)-resistant cell lines were isolated from the parental HCC827 cell line, three with“protocol 1”(RA1, RB1, and RB1.1) and two with“protocol 2”(RA2 and RB2) and one cell line was obtained from HCC4006 cell line by using“protocol 2”(RC2.2). Several attempts to derived additional HCC4006 ERL-resistant cell lines with both protocols failed.
All cell lines derived from parental cell lines are resistant to erlotinib and gefitinib (IC50>
10μM) (Fig 1B,Table 1) as well to the third generation irreversible EGFR inhibitors AZD9291
[54] and Rociletinib (CO-1686, AVL-301) [55] now in advanced stage clinical trials (Table 1) and highly sensitive to paclitaxel with the exception of RA2 and RC2.2 cell lines that exhibited higher IC50values for paclitaxel than those of parental cell lines (Fig 1B,Table 1). Interestingly, the
derived ERL-resistant cell lines are also resistant to inhibitors targeting other RTKs besides EGFR (Table 1). Importantly the resistant phenotype is stable in the absence of drug selection pressure thus resembling the phenotype of cancer cells that could survive in patients in drug holiday.
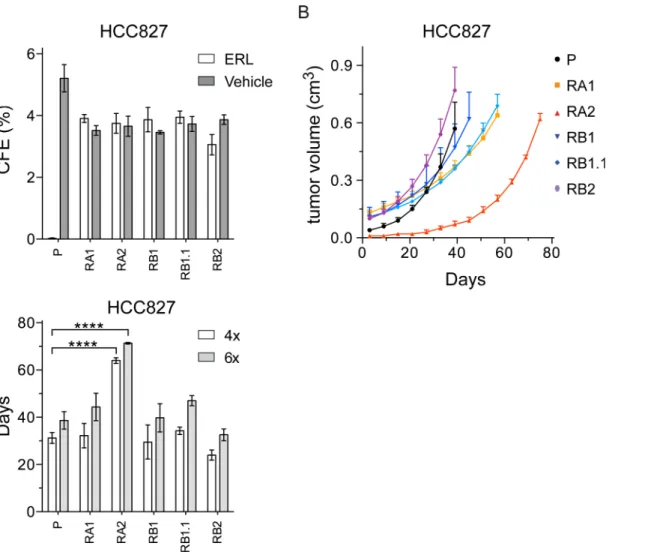
To investigate the tumorigenicity of the ERL-resistant cell lines and verify whether erlotinib could inhibit their anchorage-independent growth we performed soft agar colony formation assays. All HCC827 cell lines formed colonies similar in number and size (diameter>50μm), but only the ERL-resistant cell lines formed colonies in presence of erlotinib (Fig 2A). The HCC4006 and RC2.2 cells formed colonies but smaller in size (diameter<40–50μm) and with lower frequency. Nevertheless, the ERL-resistant RC2.2 cell line was resistant to erlotinib in soft agar as well (data not shown).
To further investigate the tumorigenicity of the NSCLC cell lines, we performed xenograft assays in athymic nude mice (Fig 2B). Similar tumor growth curves were recorded for parental and ERL-resistant HCC827 cell lines with the exception of RA2 xenografts that showed a rele-vant tumor growth delay (Fig 2B) with statistically different times required to reach a four and six fold increase from initial tumor volumes (Fig 2C). Since the RC2.2 cell line grows well in culture but at low cell density (1:5 when compared with the HCC827 parental and derived cell lines), xenograft assays were performed only with 5x10⁶cells. In those experimental conditions, only small nodes and not in all mice were obtained (data not shown). Overall the data demon-strate that HCC827 ERL-resistant cell lines and, to a lesser extent, RC2.2 cell line are tumori-genic in anchorage-independent systems. Importantly, even if the selection protocols used monolayer tissue culture conditions, the derived NSCLC cell lines grow in presence of erlotinib in 3D model systems, more closely resemblingin vivotissues conditions.
EGFR
T790M or
KRAS
gene mutations are not present in the
ERL-resistant NSCLC cell lines
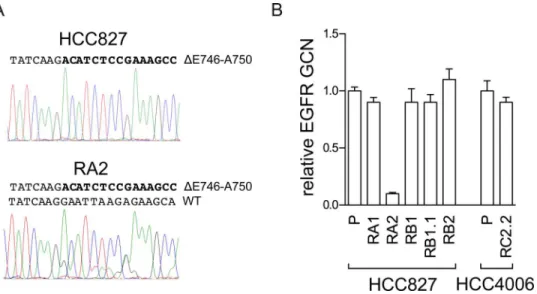
(Table 2). Interestingly, the analysis of pherograms showed in HCC827 only the mutated allele, likely for its high amplification levels, while in RA2 both allele sequences were detected suggest-ing a loss ofEGFRgene amplification in the mutated allele. Gene copy number analysis by qPCR confirmed a decrease in EGFR copy number in RA2 cell line (Fig 3). This cell line could be a useful tool to further investigate the dosage effect ofEGFRmutated allele in erlotinib sensi-tivity.KRASgene mutations appear to be mainly mutually exclusive withEGFRgene activating mutations [56–59], however co-occurrence ofKRASandEGFRactivating mutations has been recently reported in Chinese and Indian NSCLC patients [60–61].KRASgene codons (12/13, 61) were wild type in all our NSCLC cell lines (Table 2).
Erlotinib binds EGFR and impairs EGFR and ERK1/2 phosporylation
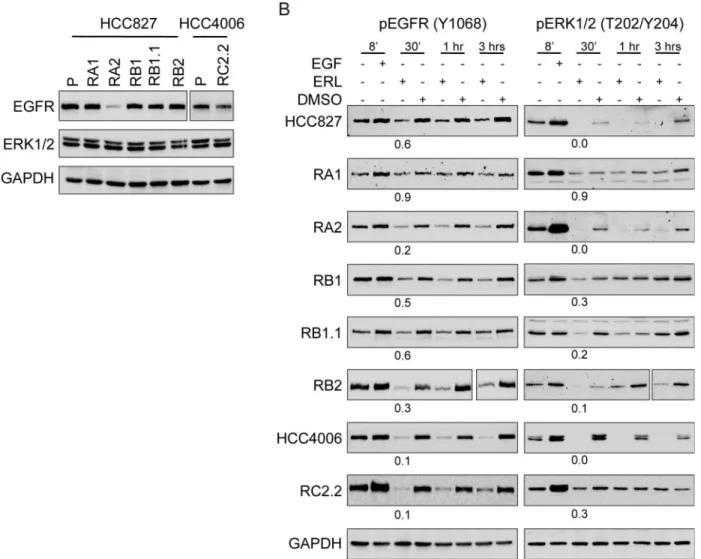
By western blotting analysis we demonstrated that all ERL-resistant cell lines express similar levels of total and constitutively phosphorylated EGFR and ERK1/2, with the exception of RA2 cell line that showed a strong decrease in EGFR protein levels (Fig 4A). Upon erlotinib Fig 2. The ERL-resistant HCC827 cells lines are tumorigenic.A) Soft agar colonies were counted by ImageJ software. The percentage of colony forming efficiency (CFE) of parental (P) and ERL-resistant cell lines, as mean±s.e.m., is shown. Histograms in gray and white colors indicate respectively vehicle
(DMSO, 0.01%) and ERL (erlotinib 1μM) cell treatments; B) Tumor volume of xenograft nodes, calculated as described in material and methods, are shown
as mean±s.e.m; C) Times to four (4x) and six fold (6x) increases from initial tumor volumes (day 3) are shown respectively by white and grey bars. P-values<0.0001 are indicated.
treatment a decrease in EGFR and ERK1/2 phosphorylation signals was observed (Fig 4B) indi-cating that erlotinib can still bind EGFR and that, unlikely, rare secondary mutations in the EGFR tyrosine kinase domain are present and/or can impair TKI binding. Furthermore, the mitogen activated protein kinase (MAPK) downstream targets of the EGFR signaling path-ways, ERK1/2, are still responsive to erlotinib (Fig 4B). Therefore, while with a partial dephos-phorylation of EGFR and ERK1/2 proteins we cannot exclude a contribution of EGFR activation due to intratumoral drug-response heterogeneity, bypass tracks signaling are likely involved in the ERL-resistant phenotype.
HER2 and HER3 receptors are not overexpressed in ERL-resistant
NSCLC cell lines
Ligand binding to human HERs results in the formation of homo- or heterodimers that acti-vate RTKs and subsequently downstream signaling pathways including the phosphoinositide Table 2. Analysis ofEGFRandKRASgene mutations.
EGFRExon 19 EGFRExon 20 KRASExon 2 codons 12/13 KRASExon 3 codon 61
HCC827 ΔE746-A750 WT WT WT
RA1 ΔE746-A750 WT WT WT
RA2 WT/ΔE746-A750 WT WT WT
RB1 ΔE746-A750 WT WT WT
RB1.1 ΔE746-A750 WT WT WT
RB2 ΔE746-A750 WT WT WT
HCC4006 ΔE746-A750 WT WT WT
RC2.2 ΔE746-A750 WT WT WT
Cells were analyzed for the mutational status by nucleotides direct sequencing.Δ: E746-A750 deletion of exon 19, WT: wild-type.
doi:10.1371/journal.pone.0143333.t002
Fig 3. Analysis of theEGFRgene in the RA2 ERL-resistant cell line.A) Analysis ofEGFRexon 19 nucleotides sequence. The pherogram of the parental cell line with peaks corresponding to theEGFR
mutated sequence (ΔE746-A750) and the pherogram of the RA2 resistant cells with peaks corresponding to the mutated and wild type (WT) EGFR nucleotides sequence are shown. B) qPCR analysis. RelativeEGFR
gene copy number (GCN) in genomic DNA, normalized to theRnase Pgene, is expressed relative to the levels in parental cell lines (P) set as 1 (mean±SD of triplicate determinations). Results are representative of those obtained from 2 independent analysis.
3-kinase (PI3K)/protein kinase B (AKT) [62]. HER2 amplification and elevated expression of HER3 are frequently observed in various malignancies including NSCLC [63,64]. HER3 can promote tumor progression via interactions with other RTKs due to its lack of or weak intrinsic kinase activity. To investigate the expression and phosphorylation status of all HER family members in our model system we performed western blot analysis using parental and ERL-resistant cell lines. HER2 and HER3 signals were similar in parental and ERL-ERL-resistant cell lines with the exception of RA2 and RC2.2. In particular, RA2 showed very low HER2 expres-sion and RC2.2 low HER2 and undetectable HER3 signals (Fig 5A). Constitutive phosphoryla-tion of HER2 (Y1221/1222) and HER3 (Y1289) was detected in all cell lines with the excepphosphoryla-tion of RA2 and RC2.2 cell lines that showed undetectable or very low signals for pHER2 and pHER3 (Fig 5A). Notably, the total level of tyrosine phosphorylation was strongly and repro-ducible reduced in both RA2 and RC2.2 cell lines implying a marked deregulation of kinases Fig 4. Erlotinib impairs EGFR and ERK1/2 phosphorylation in ERL-resistant cell lines.A) Representative western blots with EGFR and ERK1/2 antibodies and B) pEGFR (Y1068) and pERK1/2 (T202/Y204) antibodies in the indicated parental and ERL-resistant cell lines treated with EGF (100μg/ml), ERL (Erlotinib, 100 nM) or vehicle (DMSO) at different time points (8’, 30’, 1hr, 3hrs). Densitometric analyses of band signals were normalized with GAPDH, the number indicates the signals quantification at 30’upon ERL-treatment. For RA2 cell line double amount of total cell lysate was loaded to analyze EGFR expression.
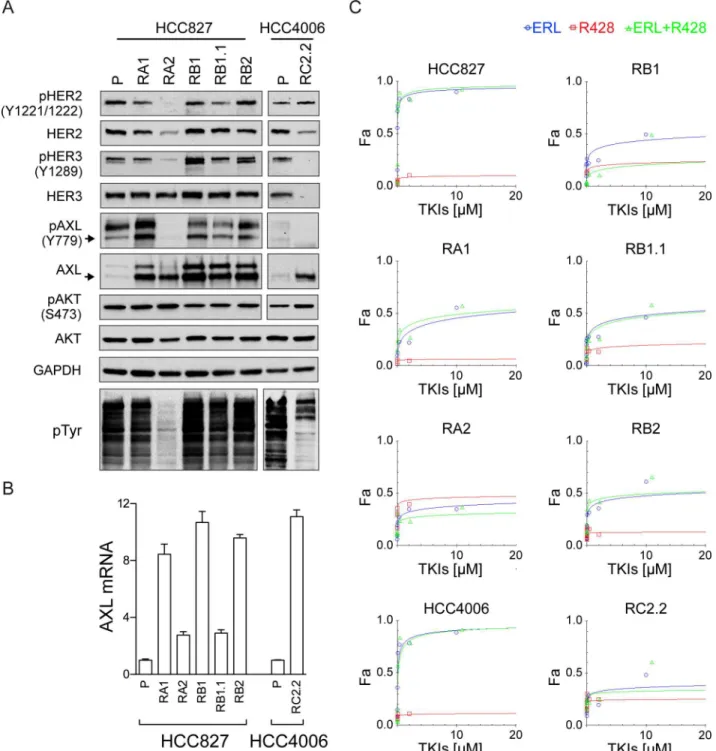
and/or phosphatases in both cell lines (Fig 5A). HER4 protein was not expressed in parental and ERL-resistant cell lines (data not shown). Overall, these data suggest that HER2 and HER3 are not overexpressed and therefore unlikely responsible for the ERL-acquired resistance. Fig 5. HER2/HER3 and AXL expression and phosphorylation analysis.A) Representative western blots of total cell lysates of HCC827 and HCC4006 parental cell lines (P) and their derived ERL-resistant cell lines. Arrows indicate the expected molecular weight size. Total cell lysates loaded were 40μg for AXL and pAXL analyses and 25μg for the others. B) qPCR analysis of AXL mRNA normalized to rp-L31 mRNA and expressed relative to the levels in parental cell lines set as 1 (mean±SD of triplicate determinations). Western blots and qPCR data are representative of those obtained respectively from 3 and 2 independent analysis. C) Dose-effect curves were calculated using CompuSyn software and plotting the entered Fa values against the entered dose values. For combination treatments, the combined drugs dose was entered. Each data point represents the mean of 3 replicates.
AXL and MET receptor in ERL-resistant NSCLC
Among RTK signaling pathways, previously reported to be involved in mechanisms of ERL-resistance, we focused our studies on AXL and MET receptors.
AXL is considered a potential relevant target in NSCLC therapy and targeting strategies with TKIs, aptamers or molecules modulating its turnover are under very active investigation [65–68]. Moreover, an association of AXL deregulation to ERL-resistance in NSCLC has been previously reported [24].
AXL expression analysis by western blotting (Fig 5A) and qPCR (Fig 5B), in our model sys-tem, showed an overexpression of AXL in both HCC827 and HCC4006 ERL-resistant cell lines independently from the protocol used for selection. However, AXL was constitutively phos-phorylated (Y779) in both parental and ERL-resistant HCC827 cell lines with the exception of RA2 (Fig 5A) and not phosphorylated in the RC2.2 cell line. To further investigate the possible role of AXL on ERL-resistance, cell viability inhibition studies were performed with a selective AXL inhibitor, R428 [42,69]. TKI dose-response curves and Dm50values indicate that AXL
inhibitor alone or in combination with erlotinib did not impair the cell viability of ERL-sensi-tive and -resistant cell lines (Fig 5C,Table 3). Overall the data suggest that unlikely, in our cell lines, AXL activation is a key player in the mechanism of ERL-resistance.
We also analyzed the expression levels and constitutive phosphorylation of the serine-threo-nine kinase AKT. AKT protein was expressed at similar levels in all parental and ERL-resistant cell lines. Similar constitutive phosphorylation levels of pAKT was observed in all HCC827 ERL-resistant cell lines, a slight and reproducible higher pAKT signal was observed in RC2.2 cell lysates when compared with the HCC4006 cell lysates by western blotting (Fig 5A).
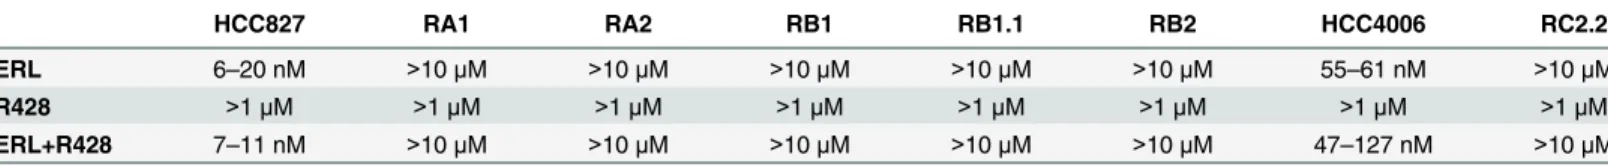
MET has recently emerged as a promising target in NSCLC and targeting strategies are actively explored in pre-clinical models and in ongoing clinical trials [35–37]. In our cellular model system we detected an increase inMETgene copy numbers by qPCR in all ERL-resistant cell lines with the exception of RA2 and RC2.2 cell lines (Fig 6A). MET protein and mRNA expression, respectively by western blot (Fig 6B) and qPCR (Fig 6C) analysis, confirmed the higher expression levels of MET in all cell lines harboringMETgene amplification. MET recep-tor was also constitutively phosphorylated at the Y1234/1235 site in all ERL-resistant cell lines with the exception of RC2.2 cell line (Fig 6B). Finally, immunohistochemistry studies of xeno-graft node sections, obtained by mice injected with HCC827 parental and ERL-resistant cell lines, confirmed the increased expression of MET in the ERL-resistant cell lines harboring amplifiedMETgene such as RA1 and RB1 when compared with parental and RA2 cell lines xenograft nodes (Fig 6D). Overall these data confirmed the association of ERL-resistance with METgene amplification and overexpression as previously reported [26,33].
MET overexpression and activation are not sufficient to predict efficacy
of EGFR and MET inhibitors
Several of our HCC827 ERL-resistant cell lines showedMETgene amplification and constitu-tive MET receptor activation, therefore we decided to investigate the effect on cell growth of
Table 3. Dm50of single agent and drugs combination for parental and ERL-resistant NSCLC cell lines.
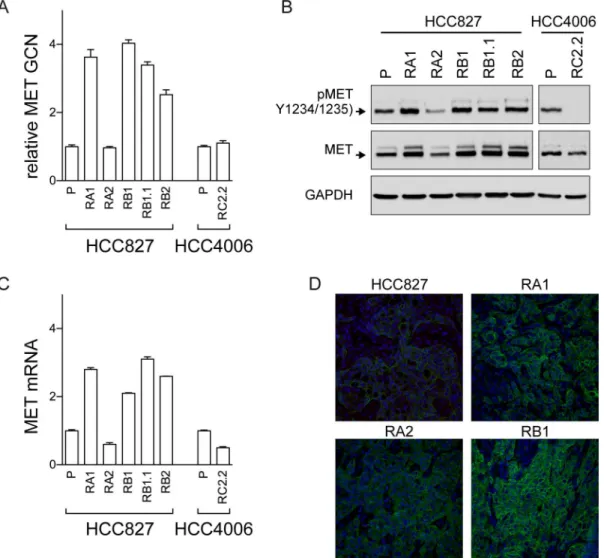
HCC827 RA1 RA2 RB1 RB1.1 RB2 HCC4006 RC2.2
ERL 6–20 nM >10μM >10μM >10μM >10μM >10μM 55–61 nM >10μM
R428 >1μM >1μM >1μM >1μM >1μM >1μM >1μM >1μM
ERL+R428 7–11 nM >10μM >10μM >10μM >10μM >10μM 47–127 nM >10μM
Median effect concentrations (Dm50) values are indicated. ERL: Erlotinib
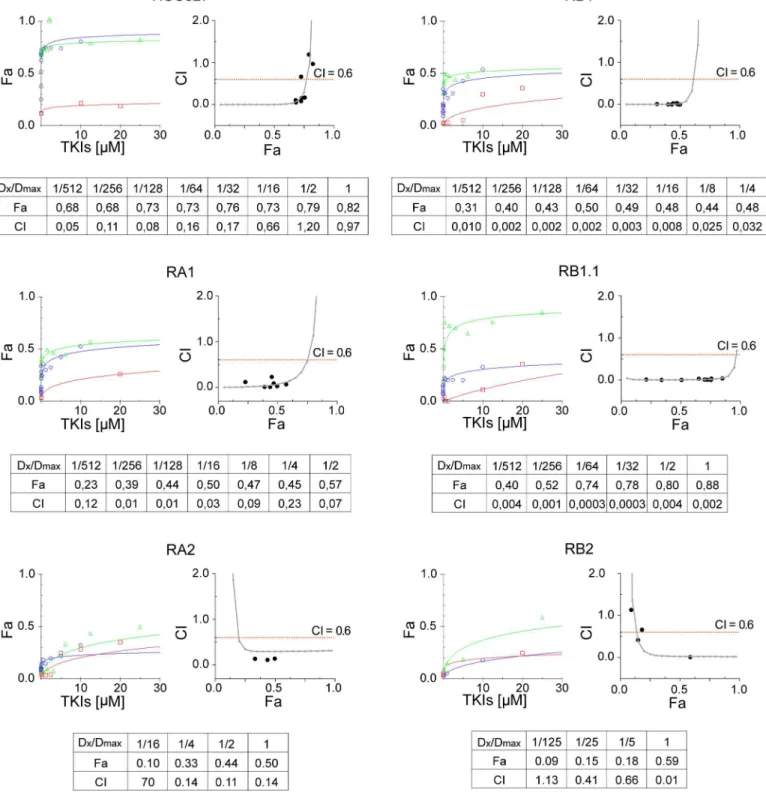
the following specific MET inhibitors: SU11274 (SU) [70–72], PHA-665752 (PHA) [73–74], and PF-04217903 (PF) [75–77], and to determine their type of interaction with EGFR inhibi-tor. Briefly, sensitive and ERL-resistant HCC827 cell lines were treated with SU or erlotinib sin-gly or in combination using 5-fold dilution series. For combination treatments, a fixed
concentration ratio 1:4 of erlotinib and SU was used. Cell viability data were determined by MTT and entered as fractional effect (Fa) values into CompuSyn software. Fa values were plot-ted against the concentration of single drug or drug combinations; representative dose effect curves are shown inFig 7. The data indicate that treatment with either MET inhibitor or erloti-nib did not impair the viability of HCC827 ERL-resistant cell lines while treatments with both TKIs strongly inhibited the RB1.1 cell line growth. Importantly the RB1.1 showed very low Dm50similar to the one recorded in the ERL-sensitive parental cell line (Table 4). Further
cal-culated CI values between 0 and 2 were plotted against Fa values; representative Fa-CI plots are Fig 6. MET analysis in ERL-resistant cell lines.A) qPCR analysis of gene copy numbers ofMET;B) western blots of total cell lysates with the antibodies indicated of parental (P) and ERL-resistant cell lines; C) qPCR analysis of MET mRNA expression in parental (P) and ERL-resistant cell lines.METgene and mRNA in A) and C) are normalized to RNaseP gene and rp-L31 mRNA respectively and both are expressed relative to the levels in parental cell lines set as 1 (mean±SD of triplicate determinations). qPCR data are representative of those obtained from 2 independent analysis; D) Confocal microscopy analysis of MET receptor (green) expression in xenograft nodes of mice subcutaneously injected with the parental HCC827 cells and the ERL-resistant RA1, RB1 and RA2 cell lines. Images show representative xy-plane maximum projection of the specimens. Scale bars correspond to 15μm.
Fig 7. Synergistic effects of Erlotinib and MET inhibitors in ERL-resistant NSCLC cell lines.Dose-effect curves were calculated using CompuSyn plotting the entered Fa values against the entered dose values. For combination treatments, the combined drugs dose were entered. Each data point represents the mean of 3 replicates. Combination index (CI) values were generated by non-linear regression method. Trendlines indicate CI values at any given effect (Fa, fraction affected, %inhibition), actual data points are also shown. CI = 1, additivity; CI>1, antagonism; CI<1, synergy.
shown inFig 7. Fa values as well as CI values for the actual experimental data points are shown along with the drug concentrations used for each point as ratio of the actual dose (Dx) and the maximal dose (Dmax) used (Fig 7). CI analysis indicated that while the drugs combination was synergic in all ERL-resistant HCC827 cell lines only in RB1.1 low drug concentrations were sufficient to impair cell growth by 70–80%. In all other ERL-resistant lines, in particular in RA2 and RB2, synergy was observed only at high drug concentrations. Remarkably, in RB1.1 cells the majority of experimental points assayed were in the area of the CI plots corresponding to a % of inhibition 70–80% (Fig 7). To validate these data, two other MET inhibitors, PHA and PF, were tested in combination with erlotinib in cell viability inhibition assays. The data essentially similar to the ones obtained with SU and erlotinib confirmed the efficacy of these combination drugs (Table 4).
Overall the data suggest thatMETgene amplification and receptor activation are not suffi-cient to predict efficacy of erlotinib plus MET inhibitor treatment in NSCLC with acquired resistance to erlotinib and that other biomarkers are required for optimal treatment choice.
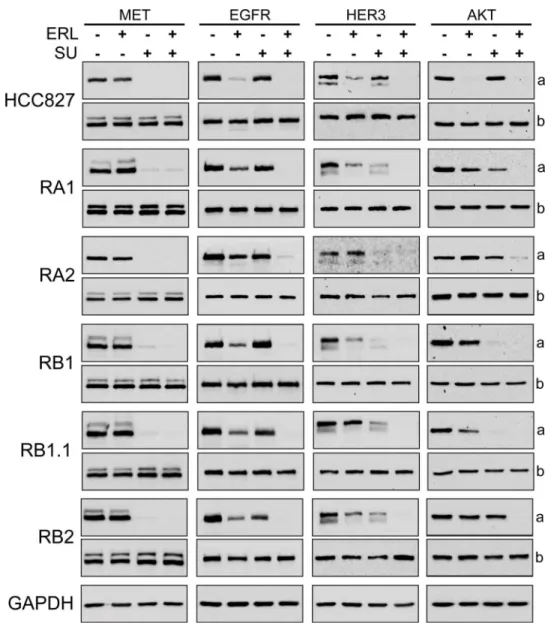
To further investigate the biochemical mechanisms of the combined treatments, the expres-sion of MET, EGFR, HER3 and AKT and their phosphorylation status were investigated by western blotting. In all cell lines, as expected, a strong decrease of MET phosphorylation (Y1234/1235) was observed upon treatment with SU inhibitor or SU in combination with erlo-tinib (Fig 8). Furthermore, a decrease of pEGFR (Y1068) levels was observed in parental cell line treated with erlotinib and in ERL-resistant cell lines treated with the TKIs combination (Fig 8). These data confirmed the selectivity of SU for MET receptor and indicate that drugs combination could potentially switch off both receptor-mediated signaling pathways. A com-plete dephosphorylation of AKT (S473) and HER3 was observed in all ERL-resistant cell lines only when the cells were treated with both erlotinib and MET inhibitor (Fig 8). However, a par-tial reduction of pHER3 levels was observed in the ERL-resistant cell lines treated with SU inhibitor alone indicating likely an effect of SU on HER3-MET heterodimers. In fact MET has been found to form heterodimers with other RTKs, including EGFR, HER2, HER3 and RET [78–80,26,31].
In summary these data suggest that this TKIs combination treatment can impair both MET and EGFR signaling pathways but that a strong impact on cell survival can be obtained only in RB1.1 ERL-resistant NSCLC cell line. Ongoing comparative genome hybridization and RNA expression array analyses could be instrumental to identify possible mechanisms leading to dif-ferential response to drug treatment combination and/or biomarkers to predict treatment efficacy.
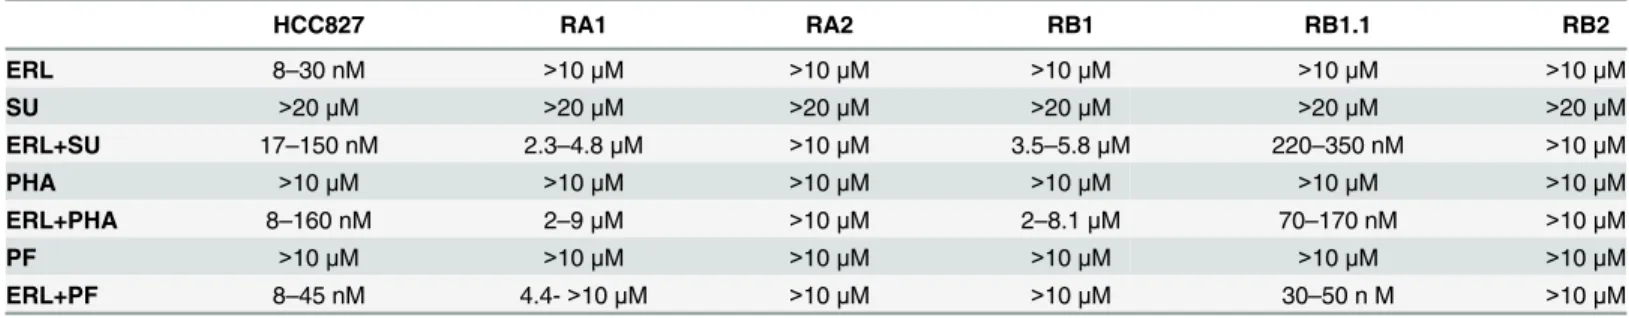
Table 4. Dm50of single agent and drugs combination for parental and ERL-resistant NSCLC cell lines.
HCC827 RA1 RA2 RB1 RB1.1 RB2
ERL 8–30 nM >10μM >10μM >10μM >10μM >10μM
SU >20μM >20μM >20μM >20μM >20μM >20μM
ERL+SU 17–150 nM 2.3–4.8μM >10μM 3.5–5.8μM 220–350 nM >10μM
PHA >10μM >10μM >10μM >10μM >10μM >10μM
ERL+PHA 8–160 nM 2–9μM >10μM 2–8.1μM 70–170 nM >10μM
PF >10μM >10μM >10μM >10μM >10μM >10μM
ERL+PF 8–45 nM 4.4->10μM >10μM >10μM 30–50 n M >10μM
Median effect concentrations (Dm50) values are indicated. ERL, SU, PHA and PF inhibitors: Erlotinib, SU11274, PHA-665752, PF-04217903.
Conclusion
We have isolated and characterized six ERL-resistant EGFR mutant NSCLC cell lines. We reported alteration in EGFR amplification in one cell line, AXL overexpression and/or MET overexpression and activation in ERL-resistant cell lines, consistently with previous studies indicating that multiple mechanisms may contribute to EGFR TKI treatment resistance. More-over, our pilot study with EGFR and MET inhibitors demonstrate thatMETgene amplification and receptor activation are not sufficient to predict a positive effect of drug TKI cocktails on ERL-resistant NSCLCs highlighting the necessity to search for novel biochemical and molecu-lar markers guiding treatment choice in ERL-resistant patients and in ongoing clinical trials. Fig 8. Biochemical analysis of the effects of Erlotinib and MET inhibitors in ERL-resistant NSCLC cell lines.Western blotting of 8% SDS-PAGE of parental and ERL-resistant HCC827 cells treated with ERL (erlotinib, 1μM), SU (SU11274, 4μM) for 3 hrs. In (a) are shown representative western blots with antibodies specific for phospho-MET (Y1234/1235), phospho-EGFR (Y1068), phosho-HER3 (Y1289) and phospho-AKT (S473); in (b) western blots for MET, EGFR, HER3 and AKT proteins.
Supporting Information
S1 Table. Primer nucleotide sequences.(DOCX)
Acknowledgments
We are grateful to Dr. Oreste Segatto (Department of Medical Oncology, Regina Elena National Cancer Institute, Rome) for providing the HCC827 and HCC4006 cell lines; Dr. Michele Milella (Department of Medical Oncology, Regina Elena National Cancer Institute, Rome) for his advice with the analyses of combination drugs assay data; Dr. Stefano Iacovelli and Dr. Daniele Baiz (ICGEB unit, Monterotondo) for assistance with the CompuSyn software; Dr. Stefano Alemà (CNR-IBCN) for helpful discussions; Dr. Giulia Bolasco and the microscopy facility of EMBL Monterotondo for technical support with confocal microscopy analyses, Dr Emerald Perlas (EMBL Monterotondo outstation) for his advice in immunohistochemistry experiments; Dr. Loriana Castellani (CNR-IBCN) for critical reading the manuscript; Flavio Sabatini for mouse husbandry and Pierluigi Palozzo for dishwashing lab technical support.
Author Contributions
Conceived and designed the experiments: DP BC GR. Performed the experiments: DP S. San-tini BC GP CL S. Samperna GG GR. Analyzed the data: DP BC GR. Wrote the paper: BC GR. Statistical analysis: VF.
References
1. Sibilia M, Kroismayr R, Lichtenberger BM, Natarajan A, Hecking M, Holcmann M. The epidermal growth factor receptor: from development to tumorigenesis. Differentiation. 2007; 75: 770–787. PMID: 17999740
2. Lemmon MA, Schlessinger J. Cell signaling by receptor tyrosine kinases. Cell. 2010; 141: 1117–1134. doi:10.1016/j.cell.2010.06.011PMID:20602996
3. Ferlay J, Soerjomataram I, Dikshit R, Eser S, Mathers C, Rebelo M, et al. Cancer incidence and mortal-ity worldwide: sources, methods and major patterns in GLOBOCAN 2012. Int J Cancer. 2015; 136: E359–E386. doi:10.1002/ijc.29210PMID:25220842
4. Ding L, Getz G, Wheeler DA, Mardis ER, McLellan MD, Cibulskis K, et al. Somatic mutations affect key pathways in lung adenocarcinoma. Nature. 2008; 455: 1069–1075. doi:10.1038/nature07423PMID: 18948947
5. Imielinski M, Berger AH, Hammerman PS, Hernandez B, Pugh TJ, Hodis E, et al. Mapping the hall-marks of lung adenocarcinoma with massively parallel sequencing. Cell. 2012; 150: 1107–1120. doi: 10.1016/j.cell.2012.08.029PMID:22980975
6. Govindan R, Ding L, Griffith M, Subramanian J, Dees ND, Kanchi KL, et al. Genomic landscape of non-small cell lung cancer in smokers and never-smokers. Cell. 2012; 150: 1121–1134. doi:10.1016/j.cell. 2012.08.024PMID:22980976
7. The Cancer Genome Atlas Research Network. Comprehensive molecular profiling of lung adenocarci-noma. Nature. 2014; 511: 543–550. doi:10.1038/nature13385PMID:25079552
8. Jackman D, Pao W, Riely GJ, Engelman JA, Kris MG, Jänne PA, et al. Clinical definition of acquired resistance to epidermal growth factor receptor tyrosine kinase inhibitors in non-small-cell lung cancer. J Clin Oncol. 2010; 28: 357–360. doi:10.1200/JCO.2009.24.7049PMID:19949011
9. Pao W and Chmielecki J. Rational, biologically based treatment of EGFR-mutant non-small-cell lung cancer. Nat Rev Cancer. 2010; 10: 760–774. doi:10.1038/nrc2947PMID:20966921
10. Irmer D, Funk JO, Blaukat A. EGFR kinase domain mutations—functional impact and relevance for lung cancer therapy. Oncogene. 2007; 26: 5693–5701. PMID:17353898
12. Lynch TJ, Bell DW, Sordella R, Gurubhagavatula S, Okimoto RA, Brannigan BW, et al. Activating muta-tions in the epidermal growth factor receptor underlying responsiveness of non-small-cell lung cancer to gefitinib. N Engl J Med. 2004; 350: 2129–2139. PMID:15118073
13. Paez JG, Jänne PA, Lee JC, Tracy S, Greulich H, Gabriel S, et al. EGFR mutations in lung cancer: cor-relation with clinical response to gefitinib therapy. Science. 2004; 304: 1497–1500. PMID:15118125
14. Pao W, Miller V, Zakowski M, Doherty J, Politi K, Sarkaria I, et al. EGF receptor gene mutations are common in lung cancers from "never smokers" and are associated with sensitivity of tumors to gefitinib and erlotinib. Proc Natl Acad Sci USA. 2004; 101: 13306–13311. PMID:15329413
15. Cappuzzo F, Hirsch FR, Rossi E, Bartolini S, Ceresoli GL, Bemis L, et al. Epidermal growth factor receptor gene and protein and gefitinib sensitivity in non-small-cell lung cancer. J Natl Cancer Inst. 2005; 97: 643–655. PMID:15870435
16. Chou TY, Chiu CH, Li LH, Hsiao CY, Tzen CY, Chang KT, et al. Mutation in the tyrosine kinase domain of epidermal growth factor receptor is a predictive and prognostic factor for gefitinib treatment in patients with non-small cell lung cancer. Clin Cancer Res. 2005; 11: 3750–3757. PMID:15897572
17. Han SW, Kim TY, Hwang PG, Jeong S, Kim J, Choi IS, et al. Predictive and prognostic impact of epider-mal growth factor receptor mutation in non-sepider-mall-cell lung cancer patients treated with gefitinib. J Clin Oncol. 2005; 23: 2493–2501. PMID:15710947
18. Mitsudomi T, Kosaka T, Endoh H, Horio Y, Hida T, Mori S, et al. Mutations of the epidermal growth fac-tor recepfac-tor gene predict prolonged survival after gefitinib treatment in patients with non-small-cell lung cancer with postoperative recurrence. J Clin Oncol. 2005; 23: 2513–2520. PMID:15738541
19. Pao W, Miller VA, Politi KA, Riely GJ, Somwar R, Zakowski MF, et al. Acquired resistance of lung ade-nocarcinomas to gefitinib or erlotinib is associated with a second mutation in the EGFR kinase domain. PLoS Med. 2005; 2: e73 doi:10.1371/journal.pmed.0020073PMID:15737014
20. Kobayashi S, Boggon TJ, Dayaram T, Jänne PA, Kocher O, Meyerson M, et al. EGFR mutation and resistance of non–small-cell lung cancer to gefitinib. N Engl J Med. 2008; 352: 786–792.
21. Yun CH, Mengwasser KE, Toms AV, Woo MS, Greulich H, Wong KK, et al. The T790M mutation in EGFR kinase causes drug resistance by increasing the affinity for ATP. Proc Natl Acad Sci USA. 2008; 105: 2070–2075. doi:10.1073/pnas.0709662105PMID:18227510
22. Camidge DR, Pao W, Sequist LV. Acquired resistance to TKIs in solid tumours: learning from lung can-cer. Nat Rev Clin Oncol. 2014; 11: 473–481. doi:10.1038/nrclinonc.2014.104PMID:24981256
23. Engelman JA and Jänne PA. Mechanisms of acquired resistance to epidermal growth factor receptor tyrosine kinase inhibitors in non-small cell lung cancer. Clin Cancer Res. 2008; 14: 2895–2899. doi:10. 1158/1078-0432.CCR-07-2248PMID:18483355
24. Zhang Z, Lee JC, Lin L, Olivas V, Au V, LaFramboise T, et al. Activation of the AXL kinase causes resis-tance to EGFR-targeted therapy in lung cancer. Nat Genet. 2012; 44: 852–860. doi:10.1038/ng.2330 PMID:22751098
25. Bean J, Brennan C, Shih JY, Riely G, Viale A, Wang L, et al. MET amplification occurs with or without T790M mutations in EGFR mutant lung tumors with acquired resistance to gefitinib or erlotinib. Proc Natl Acad Sci USA. 2007; 104: 20932–20937. PMID:18093943
26. Engelman JA, Zejnullahu K, Mitsudomi T, Song Y, Hyland C, Park JO, et al. MET amplification leads to gefitinib resistance in lung cancer by activating ERBB3 signaling. Science. 2007; 316: 1039–1043. PMID:17463250
27. Bivona TG, Hieronymus H, Parker J, Chang K, Taron M, Rosell R, et al. FAS and NF-κB signalling mod-ulate dependence of lung cancers on mutant EGFR. Nature. 2011; 471: 523–526. doi:10.1038/ nature09870PMID:21430781
28. Neel DS, Bivona TG. Secrets of drug resistance in NSCLC exposed by new molecular definition of EMT. Clin Cancer Res. 2013; 19: 3–5. doi:10.1158/1078-0432.CCR-12-3232PMID:23172883
29. Shien K, Toyooka S, Yamamoto H, Soh J, Jida M, Thu KL, et al. Acquired resistance to EGFR inhibitors is associated with a manifestation of stem cell-like properties in cancer cells. Cancer Res. 2013; 73: 3051–3061. doi:10.1158/0008-5472.CAN-12-4136PMID:23542356
30. Thomson S, Buck E, Petti F, Griffin G, Brown E, Ramnarine N, et al. Epithelial to mesenchymal transi-tion is a determinant of sensitivity of non-small-cell lung carcinoma cell lines and xenografts to epider-mal growth factor receptor inhibition. Cancer Res. 2005; 65: 9455–9462. PMID:16230409
31. Lai AZ, Abella JV, Park M. Crosstalk in Met receptor oncogenesis. Trends Cell Biol. 2009; 19: 542–551. doi:10.1016/j.tcb.2009.07.002PMID:19758803
33. Cappuzzo F, Janne PA, Skokan M, Finocchiaro G, Rossi E, Ligorio C, et al. MET increased gene copy number and primary resistance to gefitinib therapy in non-small-cell lung cancer patients. Ann Oncol. 2009; 20: 298–304. doi:10.1093/annonc/mdn635PMID:18836087
34. Turke AB, Zejnullahu K, Wu YL, Song Y, Dias-Santagata D, Lifshits E, et al. Preexistence and clonal selection of MET amplification in EGFR mutant NSCLC. Cancer Cell. 2010; 17: 77–88. doi:10.1016/j. ccr.2009.11.022PMID:20129249
35. Goździk-Spychalska J, Szyszka-Barth K, Spychalski L, Ramlau K, Wójtowicz J, et al. C-MET inhibitors in the treatment of lung cancer. Curr Treat Options Oncol. 2014; 15: 670–682. doi: 10.1007/s11864-014-0313-5PMID:25266653
36. Peters S, Adjei AA. MET: a promising anticancer therapeutic target. Nat Rev Clin Oncol. 2012; 9: 314– 326. doi:10.1038/nrclinonc.2012.71PMID:22566105
37. Gherardi E, Birchmeier W, Birchmeier C, Vande Woude G. Targeting MET in cancer: rationale and progress. Nat Rev Cancer. 2012; 12: 89–103. doi:10.1038/nrc3205PMID:22270953
38. Mosmann T. Rapid colorimetric assay for cellular growth and survival: Application to proliferation and cytotoxicity assays. J Immunol Meth. 1983; 65: 55–63.
39. Hansen MB, Nielsen SE, Berg K. Re-examination and further development of a precise and rapid dye method for measuring cell growth/cell kill. J Immunol Methods. 1989; 119: 203–210. PMID:2470825
40. Franken NA, Rodermond HM, Stap J, Haveman J, van Bree C. Clonogenic assay of cells in vitro. Nat Protoc. 2006; 1: 2315–2319. PMID:17406473
41. Chou TC. Drug combination studies and their synergy quantification using the Chou-Talalay method. Cancer Res. 2010; 70: 440–446. doi:10.1158/0008-5472.CAN-09-1947PMID:20068163
42. Giles KM, Kalinowski FC, Candy PA, Epis MR, Zhang PM, Redfem AD, et al. Axl mediates acquired resistance of head and neck cancer cells to the Epidermal Growth Factor Receptor inhibitor erlotinib. Mol Cancer Ther. 2013; 2541–2558. doi:10.1158/1535-7163.MCT-13-0170PMID:24026012
43. Barker AJ, Gibson KH, Grundy W, Godfrey AA, Barlow JJ, Healy MP, et al. Studies leading to the identi-fication of ZD1839 (IRESSA): an orally active, selective epidermal growth factor receptor tyrosine kinase inhibitor targeted to the treatment of cancer. Bioorg Med Chem Lett. 2001; 11:1911–1914. PMID:11459659
44. Moyer JD, Barbacci EG, Iwata KK, Arnold L, Boman B, Cunningham A, et al. Induction of apoptosis and cell cycle arrest by CP-358,774, an inhibitor of epidermal growth factor receptor tyrosine kinase. Cancer Research. 1997; 57: 4838–4848. PMID:9354447
45. Sos ML, Koker M, Weir BA, Heynck S, Rabinovsky R, Zander T, et al. PTEN loss contributes to erlotinib resistance in EGFR-mutant lung cancer by activation of Akt and EGFR. Cancer Res. 2009; 69: 3256– 3261. doi:10.1158/0008-5472.CAN-08-4055PMID:19351834
46. Jordan MA, Wilson L. Microtubules as a target for anticancer drugs. Nature reviews Cancer. 2004; 4: 253–265. PMID:15057285
47. Carlomagno F1, Vitagliano D, Guida T, Ciardiello F, Tortora G, Vecchio G et al. ZD6474, an orally avail-able inhibitor of KDR tyrosine kinase activity, efficiently blocks oncogenic RET kinases. Cancer Res. 2002; 62: 7284–7290. PMID:12499271
48. Ryan AJ, Wedge SR. ZD6474: a novel inhibitor of VEGFR and EGFR tyrosine kinase activity. Br J Can-cer. 2005; 92: S6–S13. PMID:15928657
49. Morabito A, Piccirillo MC, Falasconi F, De Feo G, Del Giudice A, Bryce J, et al. Vandetanib (ZD6474), a dual inhibitor of vascular endothelial growth factor receptor (VEGFR) and epidermal growth factor receptor (EGFR) tyrosine kinases: current status and future directions. Oncologist. 2009; 14: 378–390. doi:10.1634/theoncologist.2008-0261PMID:19349511
50. Rusnak DW, Lackey K, Affleck K, Wood ER, Alligood KJ, Rhodes N et al. The effects of the novel, reversible epidermal growth factor receptor/ErbB-2 tyrosine kinase inhibitor GW2016, on the growth of human normal and tumor-derived cell lines in vitro and in vivo. Mol Cancer Ther. 2001; 1: 85–94. PMID: 12467226
51. Druker BJ, Tamura S, Buchdunger E, Ohno S, Segal GM, Fanning S,et al. Effects of a selective inhibitor of the Abl tyrosine kinase on the growth of Bcr-Abl positive cells. Nat Med. 1996; 2:561–566. PMID: 8616716
52. Druker BJ, Talpaz M, Resta DJ, Peng B, Buchdunger E, Ford JM, et al. Efficacy and safety of a specific inhibitor of the BCR-ABL tyrosine kinase in chronic myeloid leukemia. N Engl J Med. 2001; 344:1031– 1037. PMID:11287972
54. Cross DA, Ashton SE, Ghiorghiu S, Eberlein C, Nebhan CA, Spitzler PJ, et al. AZD9291, an irreversible EGFR TKI, overcomes T790M-mediated resistance to EGFR inhibitors in lung cancer. Cancer Discov. 2014; 4: 1046–1061. doi:10.1158/2159-8290.CD-14-0337PMID:24893891
55. Walter AO, Sjin RT, Haringsma HJ, Ohashi K, Sun J, Lee K,.et al. Discovery of a mutant-selective cova-lent inhibitor of EGFR that overcomes T790M-mediated resistance in NSCLC. Cancer Discov. 2013; 3: 1404–1415. doi:10.1158/2159-8290.CD-13-0314PMID:24065731
56. Kosaka T, Yatabe Y, Endoh H, Kuwano H, Takahashi T, Mitsudomi T. Mutations of the epidermal growth factor receptor gene in lung cancer: biological and clinical implications. Cancer Res. 2004; 64: 8919–8923. PMID:15604253
57. Pao W, Wang TY, Riely GJ, Miller VA, Pan Q, Ladanyi M, et al. KRAS mutations and primary resistance of lung adenocarcinomas to gefitinib or erlotinib. PLoS Med 2005; 2: e17. doi:10.1371/journal.pmed. 0020017PMID:15696205
58. Shigematsu H, Lin L, Takahashi T, Nomura M, Suzuki M, Wistuba II, et al. Clinical and biological fea-tures associated with epidermal growth factor receptor gene mutations in lung cancers. J Natl Cancer Inst. 2005; 97: 339–346. PMID:15741570
59. Tam IY, Chung LP, Suen WS, Wang E, Wong MC, Ho KK, et al. Distinct epidermal growth factor recep-tor and KRAS mutation patterns in non-small cell lung cancer patients with different tobacco exposure and clinicopathologic features. Clin Cancer Res. 2006; 12: 1647–1653. PMID:16533793
60. Li S, Li L, Zhu Y, Huang C, Qin Y, Liu H, et al. Coexistence of EGFR with KRAS, or BRAF, or PIK3CA somatic mutations in lung cancer: a comprehensive mutation profiling from 5125 Chinese cohorts. Br J Cancer. 2014; 110: 2812–2820. doi:10.1038/bjc.2014.210PMID:24743704
61. Choughule A, Sharma R, Trivedi V, Thavamani A, Noronha V, Joshi A, et al. Coexistence ofKRAS
mutation with mutant but not wild-typeEGFRpredicts response to tyrosine-kinase inhibitors in human lung cancer. British Journal of Cancer. 2014; 111: 2203–2204. doi:10.1038/bjc.2014.401PMID: 25117816
62. Olayioye MA, Neve RM, Lane HA, Hynes NE. The ErbB signaling network: receptor heterodimerization in development and cancer. EMBO J. 2000; 19: 3159–3167. PMID:10880430
63. Hirsch FR, Varella-Garcia M, Franklin WA, Veve R, Chen L, Helfrich B, et al. Evaluation of HER-2/neu gene amplification and protein expression in non-small cell lung carcinomas. Br J Cancer. 2002; 86: 1449–1456. PMID:11986780
64. Amin DN, Campbell MR, Moasser MM. The role of HER3, the unpretentious member of the HER family, in cancer biology and cancer therapeutics. Semin Cell Dev Biol. 2010; 21: 944–950. doi:10.1016/j. semcdb.2010.08.007PMID:20816829
65. Tang H, Yang J, Shen DR, Calambur D, Witmer M, Wu S, et al. High-throughput high-content imaging assays for identification and characterization of selective AXL pathway inhibitors. Assay Drug Dev Technol. 2014; 12: 80–86. doi:10.1089/adt.2013.540PMID:24547742
66. Rho JK, Choi YJ, Kim SY, Kim TW, Choi EK, Yoon SJ et al. MET and AXL inhibitor NPS-1034 exerts efficacy against lung cancer cells resistant to to EGFR kinase inhibitors due to MET or AXL activation Cancer Research. 2014; 74: 253–262. doi:10.1158/0008-5472.CAN-13-1103PMID:24165158
67. Cerchia L, Esposito CL, Camorani S, Rienzo A, Stasio L, Insabato L, et al. Targeting Axl with an high-affinity inhibitory aptamer. Mol Ther. 2012; 20: 2291–2303. doi:10.1038/mt.2012.163PMID:22910292
68. Bae SY, Hong J-Y, Lee H-J, Park H J, Lee SK. Targeting the degradation of AXL receptor tyrosine kinase to overcome resistance in gefitinib-resistant non-small cell lung cancer. Oncotarget. 2015; 6: 10146–10160. PMID:25760142
69. Holland SJ1, Pan A, Franci C, Hu Y, Chang B, Li W, et al. R428, a selective small molecule inhibitor of Axl kinase, blocks tumor spread and prolongs survival in models of metastatic breast cancer. Cancer Res. 2010; 70: 1544–1554 doi:10.1158/0008-5472.CAN-09-2997PMID:20145120
70. Sattler M, Pride YB, Ma P, Gramlich JL, Chu SC, Quinnan LA, et al. A novel small molecule met inhibitor induces apoptosis in cells transformed by the oncogenic TPR-MET tyrosine kinase. Cancer Res. 2003; 63: 5462–5469. PMID:14500382
71. Shibasaki S, Tsunemi S, Kitano S, Sekiguchi M, Sano H, Iwasaki T. Differential regulation of c-Met sig-naling pathways for synovial cell function. SpringerPlus. 2014; 3: 554–560. doi: 10.1186/2193-1801-3-554eCollection 2014. PMID:25332857
72. Chen G, Noor A, Kronenberger P, Teugels E, Umelo IA, De Grève J. Synergistic effect of afatinib with su11274 in non-small cell lung cancer cells resistant to gefitinib or erlotinib. PLoS One. 2013; 8: e59708. doi:10.1371/journal.pone.0059708PMID:23527257
74. Christensen JG, Schreck R, Burrows J, Kuruganti P, Chan E, Le P, et al. A selective small molecule inhibitor of c-Met kinase inhibits c-Met-dependent phenotypes in vitro and exhibits cytoreductive antitu-mor activity in vivo. Cancer Res. 2003; 63: 7345–7355. PMID:14612533
75. Cui JJ, McTigue M, Nambu M, Tran-Dubé M, Pairish M, Shen H, et al. Discovery of a novel class of exquisitely selective mesenchymal-epithelial transition factor (c-MET) protein kinase inhibitors and identification of the clinical candidate 2-(4-(1-(quinolin-6-ylmethyl)-1H-[1,2,3]triazolo[4,5-b]pyrazin-6-yl)-1H-pyrazol-1-yl)ethanol (PF-04217903) for the treatment of cancer. J Med Chem. 2012; 55: 8091– 8109. PMID:22924734
76. Timofeevski SL, McTigue MA, Ryan K, Cui J, Zou HY, Zhu JX, et al. Enzymatic characterization of c-Met receptor tyrosine kinase oncogenic mutants and kinetic studies with aminopyridine and triazolopyr-azine inhibitors. Biochemistry. 2009; 48: 5339–5349. doi:10.1021/bi900438wPMID:19459657
77. Zou HY, Li Q, Lee JH, Arango ME, Burgess K, Qiu M, et al. Sensitivity of selected human tumor models to PF-04217903, a novel selective c-Met kinase inhibitor. Mol Cancer Ther. 2012; 11: 1036–1047. doi: 10.1158/1535-7163.MCT-11-0839PMID:22389468
78. Jo M, Stolz DB, Esplen JE, Dorko K, Michalopoulos GK, Strom SC. Cross-talk between epidermal growth factor receptor and c-Met signal pathways in transformed cells. J Biol Chem. 2000; 275: 8806– 8811. PMID:10722725
79. Mueller KL, Yang ZQ, Haddad R, Ethier SP, Boerner JL. EGFR/Met association regulates EGFR TKI resistance in breast cancer. J Mol Signal. 2010; 5: 8. doi:10.1186/1750-2187-5-8PMID:20624308