DYNAMIC CHARACTERIZATION OF
A MASONRY ARCH BRIDGE
Cristina Costa, Instituto Politécnico de Tomar, Portugal António Arêde, Faculdade de Engenharia da Universidade do Porto, Portugal Aníbal Costa, Faculdade de Engenharia da Universidade do Porto, Portugal [email protected]
Abstract
The present work addresses the identification of the most relevant dynamic parameters of a stone masonry arch bridge for validation of the numerical model used in the structural analysis. In situ dynamic tests were performed to measure the structural response under ambient vibration in order to characterize the structural dynamic behaviour. Appropriate software was adopted for signal analysis and processing based in the Peak Picking technique and in the Frequency Domain Decomposition.
1 Introduction
The structural behaviour analysis for the assessment of the conservation state of the built heritage is, presently, a research field of great interest. The theme assumes greater importance for constructions with considerable historical and cultural value, as in the case of monumental masonry arch bridges, where the complexity of the structural analysis is, in general, an important and challenging factor.
The Lagoncinha Bridge is a medieval typology bridge classified as National Monument since 1943 by the Directorate General for National Buildings and Monuments (DGEMN), from Portugal. The bridge is made of stone masonry with a two-slope longitudinal deck profile. Six different arches form the bridge, as shown in the Figure 1, where the identification of the arches used in this work is also included. The total length is about 130 m and the width is 3.5 m.
The initial phase of the study about the current state of the structure was based on the visual inspection of the monument in order to perform the survey of the structure general characteristics, to detect the existence of cracks, settlements and extreme deformations, and to evaluate the state of the material degradation.
Results from the visual survey were further completed by collecting historical data, details about reconstruction, rehabilitation or restoration works on the monument, as well as information concerning other events likely to have influenced the structural behaviour of the bridge.
Figure 1: Front view of the Lagoncinha Bridge. [1].
6 5 4 3 2 1 North South
The results of such preliminary investigation, allowed to define the strategy to be adopted in the subsequent steps of the study, which was based on the numerical model of the bridge.
The structural analysis was carried out for the whole bridge by means of a three-dimensional structural numerical model using the finite element method. Particular detail was considered for the arches, were the visible stone blocks were simulated by solid elements duly individualized, in order to consider the existing joints in the arches zone and between the piers and the remaining structure; 3D elements were adopted for in the infill and the deck zones.
The mechanical material properties of the numerical model were based on the results of in situ and laboratory tests on material samples directly extracted from the bridge and on results of the historical research and visual inspection. The model validation was performed comparing the results of modal numerical analysis with the in situ measurements, for which a set of dynamic tests was carried out in order to characterize the structure dynamic properties (vibration frequencies and mode shapes).
The main results of the performed in situ dynamic tests are presented in the following paragraphs. Result discussion and interpretation is also included, namely focusing on the most relevant aspects arising from the wide trial process that was accomplished for the numerical model fitting.
2 Model calibration using in situ dynamics tests
The objective of the modal analysis on the Lagoncinha Bridge was to characterize the dynamic properties of the structure (vibration frequencies and mode shapes), based on the general input-output relations. The comparison of the experimental results and the same dynamic numerical parameters allowed to calibrate the bridge numerical model.
In this context three sets of dynamic tests were performed. With the two first ones, some natural frequencies were found and a preliminary calibration of the numerical model was accomplished. In addiction, it was useful for planning the third set of dynamic tests, which had allowed to get also additional information regarding the vibration mode shapes. In this paper special attention is given to the third set of dynamic test and to the corresponding results.
2.1 Basic background
The modal analysis is based on the domain of the input-output relations which can be divided in three sub-domains: input, structure and output. Based in those relations, the objective of the present modal analysis consisted in the characterization of the structure sub-domain.
The relation between the generic input and the generic output is called transfer function. These relations allow for the definition of the output spectral density (also called power spectral density or power spectrum) once the input spectral density is known. In the frequency domain analysis, the transfer function is also called frequency response function. In this context, the output characteristics determination based on the spectral density requires the knowledge of the input spectral density and the transfer function.
However, in the ambient vibration tests only the output response is measured and the ambient excitation of the structure is assumed as a stationary Gaussian white noise stochastic process in the frequency band of interest. Under this assumption, the power spectral density of the input is considered constant [2], whish means that the transference function peaks coincide with peaks of the output power spectral density function; consequently, it becomes possible to identify the natural frequencies of the system by analysing the output power spectral density function.
In this type of tests the vibration source is not controlled and is due, for example, to the traffic load, wind action, human activity, micro-earthquakes and machinery. This test technique can be considered simpler, when compared with others which involving complex and onerous input processes. However, ambient vibration test results should be looked with special care, since, actually, the input power spectral density function hardly can be constant and it may not even correspond to a wide band spectrum. As a result, the peaks of the output spectral density may correspond, not only, to the system resonances but also to the dominant input components [3]. In order to improve the results of the ambient vibration tests, the cross spectral density functions and the coherence are also analysed. For a given frequency value, should the coherence be greater than 0.7, then the signals are considered well correlated, which means that, the recorded output in two different measurement points are produced by the same input source and therefore such frequency value corresponds to a natural frequency of the structure. Next, the analysis of the phase function evolution of the cross spectral density is performed, in order to verify whether the peaks of the output spectral density function, for one given frequency, are associated to a real vibration mode shape: that will be the case if the difference between the phases of the vibration mode shape components are 0º or ±180º [3]. Therefore, if the coherence function is high (say greater than 0.7) and the phase is near to 0º, then it corresponds to a structural vibration mode shape involving phase movement of these two points. If the phase is near to ±180º, then, a structural vibration mode shape involving opposite phase movements of these two points can be associated to this vibration frequency.
2.2 Dynamic test description
The dynamic tests were carried out using four portable GeoSYG macro-seismographs models GSR-16 and GRS-18 [4], whish include triaxial accelerometers.
These tests were performed in collaboration with the Laboratory of Vibration and Monitoring (ViBest) of the Faculty of the Engineering of the University of Porto (FEUP).
The methodology test consisted in a set of successive measurements of the output response of the structure in twenty five points on the deck bridge. Eight series of measurements were carried out, using one macro-seismograph placed in the same point (reference point) and the remaining devices in the other measurement points following a successive scanning of all deck as indicated in Figure 2.
Figure 3 show the parameter configuration phases of the signals acquisition, as well as three macro-seismographs placed on the deck.
All the triaxial sensors were placed in the upstream side of the transversal section of the bridge, with the three acquisition cannels orderly guided according to longitudinal, transversal and vertical directions.
The data sets consisted on records of acceleration signals with 300 seconds duration, with 100Hz sampling rate.
a) b) Figure 3: Dynamic test. a) System configuration phase. b) Positions of three
macro-seismographs on the bridge.
2.3 Signal processing with ARTeMIS software
The determination of the natural frequencies and vibration mode shapes of the bridge was based on the acquisition of the acceleration measurements. For this purpose the ARTeMIS [5] software for analysis and signal processing was used, the results of this test having been compared with the preliminary test results whose detailed description can be found elsewhere [6].
In the ARTeMIS software, the natural frequencies and the vibration mode shapes can be determinated using the Peak Peaking and the Frequency Domain Decomposition (FDD) techniques. Concerning the Peak Peaking technique, natural frequencies are identified from the peaks of the normalized average power spectra of the measured accelerations in each section, assuming that the dynamic output in resonance is due only to one vibration mode shape. The power spectra are previously obtained converting the recorded measurements from the time domain to the frequency domain, using the Fast Fourier Transform. Coherence functions are calculated, using the cross density functions (or cross power spectra), in order to evaluate if the signals measured in two different points are well correlated.
The identification of vibration mode shape components is made using the transfer functions between the output responses of the current measurement point and reference point. Thus, a given component relative to the reference point can be estimated considering the amplitude of the vibration mode shape proportional to the ordinate of the transfer function. The analysis of the phase spectrum between two measurement points allows to check, for a given identified frequency, if the phase difference is close to 0º (movement in phase) or if the phase difference is close to ±180º (movements in phase opposition).
By recourse to the FDD technique implemented in the ARTeMIS software, the modal identification consists in the following steps [7]:
1. Determination of the output power spectral densities matrices as well as the corresponding auto-spectra and cross spectra for each test.
2. Decomposition of the spectral densities matrices in eigenvectors, for each frequency value.
3. Interpretation of each eigenvalue as the auto-spectrum of one system with a single degree of freedom.
4. Interpretation of the first eigenvectors of the system, associated to the first peak of the auto-spectrum, as a vibration mode shape.
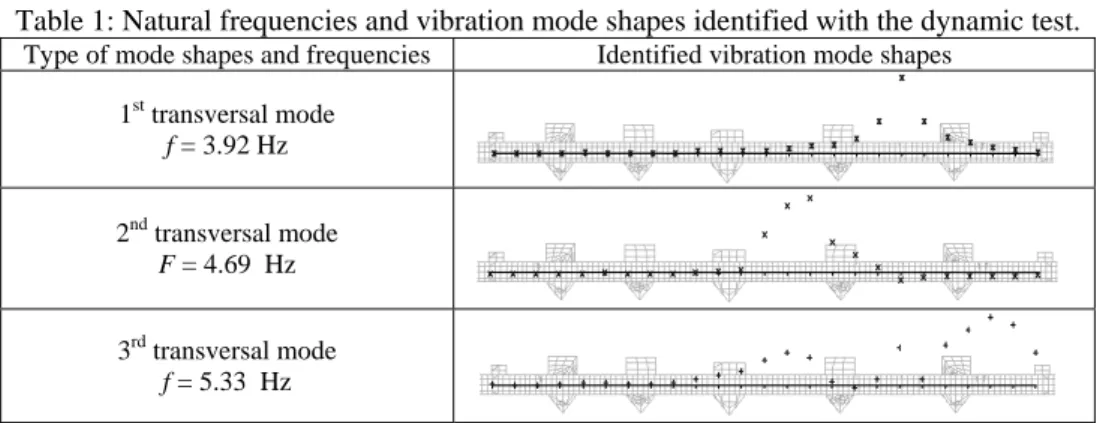
The determination of the natural frequencies and the vibration mode shapes of the bridge were based on both previously described techniques. Considering first the Peak Peaking technique, frequencies which correspond simultaneously to power spectra peaks and to a coherence values close to the unit were identified. Moreover, for each frequency value, the phase spectra between the measurement points were analyzed in order to identify whether the phase shift is 0º or ±180º. In addition, the FDD of the spectral density matrix was also determinated for each frequency, followed by the calculation of a set of eigenvalues, as many as the number of the acceleration records. The peaks of the eigenvalue spectra of the spectral density matrix were then identified as the natural system frequencies. Figure 4 shows the average of the normalized eigenvalues of spectral density matrices of data sets and the values of the more excited frequencies during the vibration test. Accordingly, Table 1 presents the configuration of the three first vibration modes and the corresponding frequencies.
F re q u e n c y [ H z ] 0 4 8 1 2 1 6 2 0 0 4 8 1 2 1 6 2 0
Figure 4: Eigenvalues of the spectral density matrix of data sets.
As already mentioned, the eigenvector associated with each eigenvalue of the spectral density matrix, is taken as a vibration mode shape whose terms are amplitudes relative to the reference point. Using this information the visualization and the animation of the amplitude and the phase shift of the vibration modes are easily achieved by means of the ARTeMIS software.
Table 1: Natural frequencies and vibration mode shapes identified with the dynamic test.
Type of mode shapes and frequencies Identified vibration mode shapes 1st transversal mode f = 3.92 Hz 2nd transversal mode F = 4.69 Hz 3rd transversal mode f = 5.33 Hz
The preliminary analysis of the vibration mode shape amplitude showed a good agreement with the results of the numerical model and of the preliminary test. However, for the simultaneous representation of the phase and the amplitude, difficulties arose in the analysis of the phase evolution between different measurement points, related with some disagreement with the results obtained using the Peak Peaking technique. In fact, some difficulties were also found in the
comparison with the numerical results, because the numerical modes are real type modes and the experimental modes are complex type modes.
Therefore, in order to find out the real modes, some corrections were made in the ordinates of the phase representation for the vibration mode shapes obtained from the FDD technique. The vibration amplitude was considered equal to the square root of the sum of the squares of the real part (which represents the amplitude in the complex mode) and of the imaginary part (which represents the phase shift), both calculated with the ARTeMIS software. The phase was defined performing the analysis of the evolution phase spectra of the measurement sections relative to the reference section using the concepts previously presented for the Peak Peaking technique; even so, the analysis of the cross spectra between successive measurement points was also needed in some cases to help on clarifying the results.
2.4 Comparison between the experimental and numerical results
The structural analysis was carried out through three-dimensional numerical modelling of the structure using the finite element method by means of the Cast3m software [8].
Once the geometric characteristics of the bridge were known, a refined structural model was defined using solid elements duly individualized by joints elements. Mechanical material properties used in the numerical model are presented in Table 2.
Table 2: Mechanical material properties of the numerical model.
Mechanical properties of the blocks Zones Young Modulus (GPa) Specific Weight (kN/m3) Zones Young Modulus (GPa) Specific Weight (kN/m3) Arches of the south zone 35 26 Arches of the north zone 25 to 30 26 Piers of the south zone 4.9 21 Piers of the north zone 0.6 19 Infill of the south zone 6.5 21 Infill of the north zone 0.6 to 2.8 18 to 19
Mechanical properties of the joints Types of joints and zones Normal Stiffness
(MPa/mm)
Shear Stiffness (MPa/mm) Arches of the south zone 6.24 0.69 Joints between the
blocks of the arches Arches of the north zone 4.46 to 6.24 0.48 to 0.69 Infill of the south zone 65.0 27.1 Joints between the
arches and the infill Infill of the north zone 6.0 to 28.0 2.50 to 11.6
The various properties of the volumetric elements of the linear behaviour model was based on the results of the visual inspection and the historical research, on the results of the laboratory tests and on the calibration performed by comparison of the parameters obtained in the dynamics tests with the same parameters numerically calculated.
Estimates of both the compressive strength, Young modulus and Poisson ratio of stone blocks were obtained by means of compressive tests, whereas the tensile strength was estimated using the Brazilian test.
Some modelling aspects are worth mentioning, particularly regarding the Young modulus considered for the different block zones. Notwithstanding the fact that they were based on laboratory tests, lower values of that modulus were adopted for the north zone arch blocks in order to account for more degradation actually existing in that bridge zone. On the contrary, the infill Young modulus for the south zone was assumed greater than in the north because the former had
been subjected to restoration works in 1953, during which the infill mentioned was improved with a cyclopean concrete and reinforced concrete envelope layers were added to the south arches extrados.
Finally, the values included in Table 2 for the infill material represent a homogeneous Young modulus values which aim at accounting for the behaviour of the infill material and the stone masonry spandrel walls.
For the same reason, also for the piers, greater values of the Young modulus were considered in the South zone than in the North zone due to the restoration works that were also made there.
The mortar joint behaviour parameters were based on tests carried on this type of joints, as presented elsewhere [9] and [10]. However, these parameters were adjusted so that the initial (elastic) branch of the normal and shear behaviour laws would match the normal and shear stiffness listed in Table 2 and estimated on the basis of the modal analysis calibration.
The joint stiffness in the north zone arches was given lower values than in the remaining arches in order to take into account the increased degradation state observed in these arches. The adjustment of these values was performed on the basis of the modal analysis calibration, as previously described.
Finally, the joints between the piers and the infill were generally considered with lower values for the elastic linear behaviour parameters in order to account for the constructive detail of these elements which are only leaned to the remaining structure.
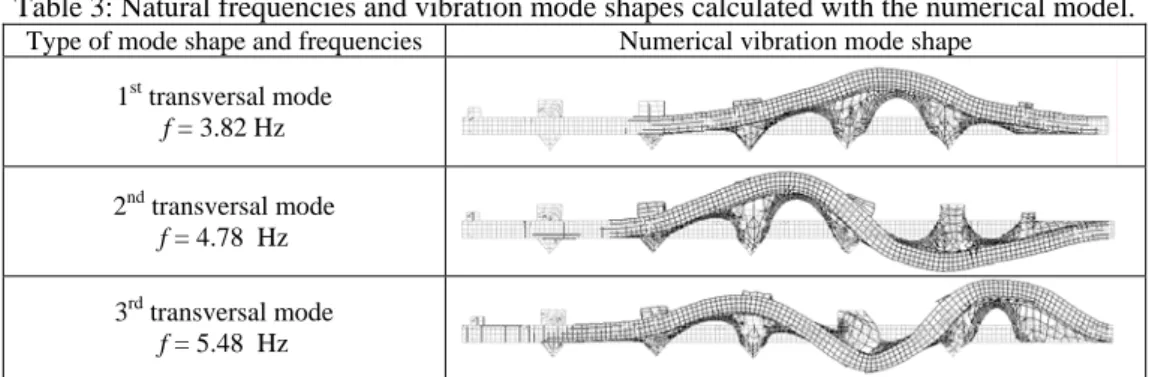
The results of the modal analysis performed using the so calibrated numerical model are presented in the Table 3, both in terms of frequency, type and configurations of the numerical vibration mode shapes.
Table 3: Natural frequencies and vibration mode shapes calculated with the numerical model.
Type of mode shape and frequencies Numerical vibration mode shape 1st transversal mode f = 3.82 Hz 2nd transversal mode f = 4.78 Hz 3rd transversal mode f = 5.48 Hz
As can be verified by the comparison of the numerical vibration mode shapes (Table 3) and the experimental modes (Table 1), there is a reasonable agreement between the vibration modes as well as the respective values of the natural frequencies. Finally it should be mentioned that, the analysis of experimental tests evidenced bridge movement excitation in correspondence with frequencies of 11.3 Hz and 12.7 Hz [6], exhibiting higher vertical displacement amplitudes in arch 5. This vibration pattern was not found to fit with any of the three above shown vibration modes; instead, the presence of those vertical components suggested that such vibration might have been strongly influenced by the traffic input source, which, due to significant pavement irregularities, is very likely to induce vertical excitation in the bridge.
2 Conclusion
In this paper particular emphasis was put on the dynamic identification of the vibration frequencies of the mode shapes of a stone masonry arch bridge in order to calibrate the numerical model. In situ dynamic tests were performed using four macro-seismographs to measure the structural response under ambient vibration in order to characterize the structural dynamic behaviour. Appropriate software was adopted for signal analysis and processing based on peak picking and on the FDD techniques.
Vibration frequencies and mode shapes were compared against numerical results, thus allowing to calibrate material properties of the numerical model which, in a first trial, had been based in the results of in situ and laboratory tests on material samples directly extracted from the bridge. Elastic characteristics of materials and geometric model data were adjusted in order to numerically simulate the in situ identified parameters. Despite the complexity and heterogeneity of structure under analysis, the result simulation has shown that the adopted procedure appears quite adequate for numerical model calibration.
3 References
[1] DGEMN "Boletim da Direcção Geral dos Edifícios e Monumentos Nacionais" Ponte da Lagoncinha. Boletim n.º 87, MOP, 1957 [2] CAETANO, E. - "Dynamics of Cable-Stayed Bridges. Experimental
Assessment of Cables-Structure Interaction", Ph.D. Thesis, FEUP,2001 [3] CAETANO, E. - " Identificação experimental de parâmetros dinâmicos
em sistemas estruturais ", MSc. Thesis, FEUP,1992
[4] Grob, J. "GeoSIG GSR-12/16/18. Operation Manual" GoeSIG AG, Switzerland
[5] Structural Vibration Solutions Aps, Artemis Extractor Light 3.1, Aalborg East, Denmark
[6] Costa, C. "Análise do Comportamento da Ponte da Lagoncinha sob a Acção do Tráfego Rodóviario" MSc. Thesis FEUP, 2002
[7] Brincker, R. "Introductory Seminar: ARTeMIS EXTRACTOR SOFTWARE" Lisboa, 2001
[8] Commissariat à l'Énergie Atomique; Pasquet, P. "Manuel d'utilisation de Cast3m", www-cast3m.cea.fr, 2003
[9] LNEC "Ensaios de Mecânica das Rochas na Igreja do Mosteiro da Serra do Pilar", Technical Report, LNEC, 2000
[10] Almeida, C. "Análise do Comportamento da Igreja do Mosteiro da Serra do Pilar à Acção dos Sismos" MSc. Thesis, FEUP, 2000
![Figure 1: Front view of the Lagoncinha Bridge. [1].](https://thumb-eu.123doks.com/thumbv2/123dok_br/15850944.1085571/1.748.109.701.735.790/figure-view-lagoncinha-bridge.webp)