Pages: 182-186 DOI: 10.13057/biodiv/d120309
Carbon baseline as limiting factor in managing environmental sound
activities in peatland for reducing greenhouse gas emission
BAMBANG HERO SAHARJO♥
Forest Fire Laboratory, Forest Protection Division, Department of Silviculture, Faculty of Forestry, Bogor Agricultural University, IPB Campus at Darmaga, Bogor 16001, West Java, Indonesia. Tel. +62-251-8626806, Fax: +62-251-8626886, ♥email: [email protected]
Manuscript received: 27 March 2011. Revision accepted: 27 April 2011.
ABSTRACT
Saharjo BH (2011) Carbon baseline as limiting factor in managing environmental sound activities in peatland for reducing greenhouse gas emission. Biodiversitas 12: 182-186. The total carbon stock in Indonesia was estimated to be around 44.5 Gt or about 53.1% of the total carbon stock in tropical areas. Over 1990-2002, it was estimated that around 3.5 Gt of carbon was released in Sumatra and about 0.81-2.56 Gt was released in Central Kalimantan due to the 1997 fire alone. It was recognized that deforestation, high exploitation of peat and peat fire were behind the huge emissions of Greenhouse Gases in Indonesia. Results of a research conducted in Central Kalimantan peatland, showed that the total carbon stock at logged over area was estimated around 413.972 t ha-1 (0-30 cm depth of peat) and at burnt area was 411.349 t ha-1 (0-30 cm depth of peat). Meanwhile it had been well recognized that most of opened peatlands had been occupied by Acacia crassicarpa and oil palms. Research carried out in East Kalimantan showed that the carbon stock of 25 years old oil palm planted on mineral soil was about 180 t ha-1, which is less than that of carbon stock produced by peatland clearance. This indicated that although plants occupied peatland, high Greenhouse Gas emissions were still produced, meaning that global climate change would continue and created high risk impacts.
Key words: carbon stock, peat, oil palm, emission, GHG.
INTRODUCTION
The total amount of carbon stored in tropical peatland is about 83.3 Gt where 44.5 Gt or about 53.1% is found in Indonesia across the three main islands, i.e., Sumatra, Kalimantan and Papua (West Papua) with total carbon stored of 18.3 Gt (41.1%), 15.1 Gt (33.8%) and 10.3 Gt (23%) respectively. The majority of Indonesian peatland (16.5 million ha) are deeper than 60 cm with a minimum organic content of 65% (Andriesse 1974). Peat formation is a true carbon sink, the carbon being sequestered out of the system and converted into peat through biological activity. Peat swamps forests originally represent major ecosystems in Indonesia and ranged between 16.5-27 million ha. In their original state, Indonesian peat swamp forests sequestered between 0.01-0.03 Gt of carbon annually. These important ecosystems have however in recent years been reduced through drainage and conversion to agriculture lands and other activities (Sorensen 1993).
Southeast Asia (ADB 2009) has contributed 12% of the world’s total greenhouse gas (GHG) emissions in 2000, an increase of 27% over 1990 and twice as fast as the global average rate of increase. Emissions from land use change and forestry (LUCF) sectors were 75%, energy 15% and agriculture 8%. Emissions rose fastest in the energy sector (83% during 1990-2000), while about 59% of the total emissions that came from Indonesia, are largely generated
by LUCF. The highest CO2 emission in Indonesia (PEACE
2007) is due to forestry activities. Deforestation and land
conversion cover about 75% followed by 23% of energy used in forestry sectors and 2% from forest industry. Forest fire was the main contributor for deforestation and land conversion which cover about 57%. The 1997 forest fire alone released 3,000 to 9,000 MtCO2e to atmosphere (Page
et al. 2002). Fire alone annually released about 1,400 Mt of carbon supported by dry peatland decomposition of about 600 Mt. If emissions from peatland fires (which are also caused by deforestation and drainage) are included, the
total CO2 emission number is significantly higher. Over
1997-2006, CO2 emissions from peatland fires in Indonesia
were several times higher than those due to peat decom-position in drained peatland areas: 1400 Mt/year to possibly as much as 4300 Mt year-1 (Hooijer et al. 2006, 2010).
Peatland management and restoration of organic soil practices have the potential to sequester carbon by 7.33-139.33 t CO2 ha-1 year-1 and reduce N2O emission by
0.05-0.28 t CO2-eq ha-1 year-1 (ADB 2009). The sequestration of
also reduce flood damages; stabilize shorelines and river deltas; retard saltwater seepage; recharge aquifers; and improve wildlife, waterfowl, and fish habitat. Restoration of organic soils can also improve soil quality as well as aesthetic and amenity values, promote biodiversity and wildlife habitats and support energy conservation.
The research calculates the above ground carbon stock of 25 years old oil palm planted on mineral soil. Such data would provide insights in order to determine whether oil palms should be planted on high or low carbon stock areas. The carbon loss which occurs when tropical forest is converted to oil palm plantation, by far exceeds the carbon sequestration during one cycle of oil palm growth (25 years). The overall carbon loss is further enhanced when the plantation is located on peat. When oil palm plantations replace grasslands, carbon sequestration exceeds carbon loss by the conversion of grasslands. In such case, oil palm plantations act as a net carbon sink (Brinkman 2009). Finally carbon stock might be the limiting factor for environmental sound activities especially for oil palm and industrial forest plantations on peatland to obtain significant reduction of greenhouse gas emission.
MATERIAL AND METHOD
Study site
The research was carried out in August 2009 at oil palm plantation of 25 years old owned by a farmer located in the Kuaro Sub-district, Paser District within East Kalimantan Province, Indonesia. The oil palms were planted on mineral soil with spacing of 9 m x 7 m comprised of 125 trees per ha. Since the beginning of the plantation through to certain periods, the oil palm farmer has used non-organic fertilizers and pesticides to increase land productivity.
Biomass
Above-ground biomass
As many as three 25 years old oil palms trees were selected as samples for calculating the above ground biomass and carbon stock. These trees were selected from the total plants standing on the plantation where each tree must represent the condition of the plantation. In order to measure the above ground biomass of selected oil palms, destructive sampling was used by cutting down each sampled tree using chainsaw, followed by separation of tree parts from the lower part to the top. The stem of each sampled tree was divided into horizons of 1-2 m long. For
each horizon, fresh weight (FWx) of each morphological
tree compartments (stem, branch, twig, and leaf) were separately weighed and recorded. To analyze the basic characteristics of the plant, i.e. water content and fixed carbon, a small amount of 200 g were taken from each morphological compartment of the sampled trees.
Understorey biomass
Ten (10) 1 m2 sub-plots were established in understorey plot for above ground biomass measurement. All understoreys (shrubs, grass and litter) were cleaned, separated according to morphological compartments,
weighed and recorded. For each understorey, a 200 g of fresh sample was taken for analysis in the laboratory, to determine the basic characters, similar to the method used for tree morphological compartments.
Moisture content
About 1-2 gram of test sample was weighed (B0x), and
oven dried with temperature of 105±3°C for 24 hours to
determine the dry weight (DWx). Water contents of each
test sample (WCx) were calculated following the equation:
x x x x
DW DW BO
WC = −
Based on the results of water content values, biomass
for each tree morphology (Wx) was calculated using the
following equation:
1
+ =
x x x
WC FW W
Biomass calculation
Biomass of oil palm trees and understorey were calculated following the equation:
Bx = (TDW x 100)/A
Bx is the biomass of each morphological compartment (kg), TDW is the total dry weight of each morphological compartment (kg) and A is the plot area (m2).
Carbon Fixed carbon
Fixed carbon calculation for each tree morphology was made after determination of (a) volatile matter and (b) dust. Volatile matter content (VM) was determined by placing test sample inside a tightly closed porcelain dish
and placed in an oven of temperature 950oC. The steps
were: first, test sample was inserted close to the front door
of the oven with temperature of 300oC for 2 minutes, and
then transferred to the side of the oven with temperature of 500oC for 3 minutes, and again transferred into the inside
of the oven with temperature of 950oC for 6 minutes. The
dish containing heated powder was then cooled inside an exicator for 1 hour and weighed. The content of the volatile matter was expressed in percent of weight using the following equation:
VM = (A-B)/A x 100%
A is the oven dry weight at 105oC, B is the test sample weight minus the weight of dish and the remaining test sample at 950oC.
Dust content (DC) determination was done as follows:
DC = (Weight of dust/weight of oven dried test sample) x 100%
After the volatile and dust contents were measured, fixed carbon (FC) could then be calculated using the following equation:
FC = 100%-VM-DC
Carbon stock
Carbon stock of oil palm and understorey were calculated following the equation:
Cx = (FC x 100)/A
Cx is the carbon of each morphological compartment (kg), FC = fixed carbon of each morphological compartments (kg) and A is the plot area (m2).
RESULTS AND DISCUSSION
Biomass
Diameters of the selected oil palm trees varied between 65 cm to 95 cm, while the height varied from 10 m to 12 m. Oil palm stem (trunk) had the highest average dry weight with value of 84.32 t ha-1, followed by leaflet, fruit and petiole with 10.74 t ha-1, 0.78 t ha-1 and 0.18 t ha-1 respectively, with a total of about 98.91 t ha-1 (Table 1).
Table 1. Average dry weight of 25 years old oil palm planted on mineral soil in Paser District, East Kalimantan
Part of oil palm Average dry weight per plant (ton)
Average dry weight per ha (ton) Stem (trunk) 0.67 84.32
Leaflet 0.08 10.74
Fruit 0.006 0.78
Petiole 0.00017 0.22
Inflorescence 0.00014 0.18
Weeds in the trunk 0.02 2.67
Total 0.78 98.91
The highest average dry weight of the 25 years old oil palm plantation on mineral soil was dominated by understorey with value of 7.47 t ha-1, followed by grass and dry litter, each with a value of 5.57 t ha-1 and 2.14 t ha-1
respectively, with a total of approximately 15.18 t ha-1
(Table 2).
Table 2. Average dry weight of understorey and litter of 25 years old oil palm planted on mineral soil at Paser District, East Kalimantan
Source Average dry weight (ton ha-1)
Dry litter 2.14
Understorey 7.47 Grass 5.57 Total 15.18 Carbon
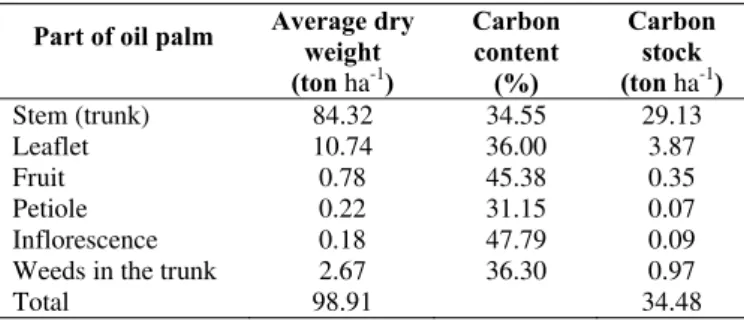
The carbon content of each part of oil palm varied from 31.15% at petiole part to 47.79% at inflorescence. The highest carbon stock for the 25 years oil palm planted on mineral soil was dominated by stem (trunk) with values 29.13 t ha-1, followed by leaflet with 3.87 t ha-1, fruits 0.35 t ha-1, inflorescence 0.09 t ha-1 and petiole 0.07 t ha-1, giving a total of 34.48 t ha-1 (Table 3).
Table 3. Carbon content and carbon stock of 25 years old oil palm planted on mineral soil at Paser District, East Kalimantan
Part of oil palm Average dry weight (ton ha-1)
Carbon content (%)
Carbon stock (ton ha-1) Stem (trunk) 84.32 34.55 29.13
Leaflet 10.74 36.00 3.87
Fruit 0.78 45.38 0.35
Petiole 0.22 31.15 0.07
Inflorescence 0.18 47.79 0.09
Weeds in the trunk 2.67 36.30 0.97
Total 98.91 34.48
The carbon content of average dry weight of under-storey varied from 34.05% at dry litter to 40.32% at grass stage. The highest carbon stock was dominated at understorey with a value 2.48 t ha-1, followed by grass with 2.25 t ha-1 and dry litter 0.73 t ha-1, giving a total of 5.46 t ha-1 (Table 4).
Table 4. Carbon content and carbon stock of understorey of 25 years old oil palm planted on mineral soil at Paser District, East Kalimantan
Source weight
Average dry (t ha-1)
Carbon content (%)
Carbon stock (t ha-1) Dry litter 2.14 34.05 0.73 Understorey 7.47 33.17 2.48
Grass 5.57 40.32 2.25
Total 15.18 5.46
Discussion
Based on data in Table 1 and 2, the total above ground biomass for 25 years old oil palm planted on mineral soil was 113.28 t ha-1. The total above ground carbon stock as shown in Table 3 and 4 was 39.94 t/ha, or equal to 146.58 t
of CO2-eq ha-1. If below ground carbon stock was
estimated at maximum of 20% (commons used value), hence the total carbon stock at 25 years old oil palm planted on mineral soil was 46.84 t ha-1 or equal to 171.32 t of CO2-eq ha-1 or 6.85 t of CO2-eq ha-1 year-1. Results of
research conducted in the Province of Riau of 19 years old oil palm planted on mineral soil showed that the total
biomass of ground and below ground was 108.58 t ha-1,
while the total carbon stock of above and below ground was 40.28 t ha-1, or equal to 147.83 t of CO2-eq ha-1 or 7.78
t of CO2-eq ha-1 year-1 (Tjitrosemito and Mawardi 2000).
ground biomass on oil palm plantations range from 50 t ha
-1
to over 100 t ha-1 towards the end of the plantations
economical live span after 20-25 years (Brinkman 2009). Biomass from oil palm root increased as the above ground biomass increased, where the maximum volume depend on the soil characteristics and water availability. Germer and Saurborn (2008) calculate the average biomass
of roots at 20±5 t ha-1. Biomass from ground vegetation
decreases as the oil palm vegetation grows and the sunlight it receives decreases. Germer and Sauerborn (2008) also calculate the average ground vegetation biomass at 2.5±1 t ha-1 with the assumption that the maximum development of ground vegetation is 10 t ha-1 and the linear decrease of biomass from reduced sunlight of 1 ton ha-1 from five years since planting. Based on this description, Germer and Sauerborn (2008) calculate the total above and below ground biomass to be 82.5±26 t ha-1 and carbon fixation to
be 35.3±11 t ha-1 during the economic planting period of
the palm oil plantation period or equivalent to 129.3±40.3 t
of CO2-eq ha-1. Henson (2008) has also made a
quantification of carbon absorbed by oil palm plantations in Malaysia. The average carbon absorbed by 25 year old oil palm trees is 2.09 t of carbon ha-1 year-1 (equivalent to 7.66
t of CO2-eq), where 80% originates from carbon stored
within the system (from ground vegetation, coarse litter and 20% from oil palm production). The total accumulated carbon of the oil palms at the end of the cycle is 44 t carbon
ha-1. The average carbon stored in areas that have been
planted for a period of 30 years is 35.4 t ha-1, equivalent to Germer and Sauerborn’s (2008) findings at 35.3 t carbon ha-1. Literature studies conclude that the amount of carbon which may be absorbed by oil palm plantations is 35 t for a period of 25-30 years, or equivalent to 130 t of CO2-eq ha-1
(Brinkman 2009).
The above figures showed that oil palm plantation may
absorb as much as 130-180 t of CO2-eq during the
economic planting period of 25-30 years. If the establishment of oil palm plantation was supposed to provide better environmental quality to human life, this indicated that plantation should be conducted on lower carbon stock area. Fargioni et al. (2008) concluded that converting native forests to biofuel production results in large carbon debts like converting lowland tropical rainforest in Indonesia and Malaysia to palm biodiesel would result in a biofuel carbon debt of 610 t ha-1 of CO2
-eq that would take approximately 86 years to repay. Converting tropical peatland rainforest to palm production incurs a similar biofuel carbon debt from vegetation, but the required drainage of peatland causes an additional sustained emission of approximately 55 t of CO2-eq ha-1
year-1 from oxidative peat decomposition. Peatland of
average depth (3 m) could release peat-derived CO2-eq for
about 120 years. Total net carbon released would be approximately 6,000 t ha-1 of CO2-eq, taking 840 years to
repay (Fargioni et al. 2008).
The calculation of how much oil palm plantation may
absorb CO2 during its economic cycle should be initiated
based on the type of land use.
The GHG emission that resulted from changes of the above and underground biomass depends on the original
biomass stock present on the land, as well as the question whether original biomass is removed through decomposition, or through burning (Brinkman 2009). Emissions arising from changes in carbon stocks during the development of a new plantation and during the operations of a plantation are in particular related to changes in above ground and underground biomass, as well as soil organic matter (including peat). Establishing and operating oil palm plantations may have three different impacts upon above ground and below ground carbon stocks, (Brinkman 2009) namely: (i) The establishment of a plantation leads to the removal of originally present above ground and below ground biomass, e.g. forest, grassland; (ii) A palm plantation stores carbon through the growth of oil palms; (iii) Establishing and operating oil palm plantations on peat requires ongoing drainage, thus causing ongoing peat oxidation.
It had been well recognized that most of opened
peatlands in Indonesia had been occupied by Acacia
crassicarpa and oil palm. Above ground biomass of 6 years old A. crassicarpa in peatland was 138.32 t ha-1 while the total carbon stock was 28.39 t ha-1 or equal to 104.18 t of
CO2-eq ha-1 (Limbong 2009). Results of the research
conducted in Central Kalimantan peatland (Siregar et al. 2004) show that the total carbon stock at logged over area is estimated around 413.972 t ha-1 (0-30 cm depth of peat) and at burnt area is 411.349 t ha-1 (0-30 cm depth of peat).
Under undisturbed conditions, the primary peat forest could be absorbed carbon through the accumulation of peat and biomass. This ecosystem functions as a carbon sink through the accumulation of peat. Drainage and degradation of the primary peat forest result in carbon emissions through peat decomposition. The conversion of peatlands to oil palm plantations require 60-80 cm drainage below the surface, supported by peat decomposition and GHG emissions (Brinkmann 2009). There are several uncertainties produced by researchers in peatlands regarding the true value of GHG emissions, however literature studies suggest that a realistic value of GHG emissions from drained peatlands is 25-55 t of CO2-eq ha-1
year-1. Based on an intensive literature study on CO2
emissions related to peat drainage on different use of land, it is generally concluded that deeper drainage causes higher emissions of CO2 ha-1. However, specific reference on CO2
emissions from oil palm plantations provide the value of 55
t CO2-eq ha-1 year-1 from drainage at a depth of 60 cm
(Melling et al. 2005) and 54 t CO2-eq ha-1 year-1 from
drainage at a depth of 80 cm (Muruyama and Bakar 1996). Henson (2008) concludes that there is a large uncertainty regarding the magnitude of carbon emissions from peat and its relation to drainage intensity and peat subsidence. He uses the figure of 7.2 t of carbon ha-1 year-1 (based on
Wösten et al. 1997) and 9.17 t of carbon ha-1 year-1
(Melling et al. 2007). This is equivalent to 25-30 t of CO2
-eq ha-1 year-1. Furthermore, longer term lifecycle analyses
also arrive at clearly negative values for CO2 emissions
from peat degradation, e.g. 1.8 kg of CO2 m-2year-1
(Germer and Sauerborn 2008), 3.7-5.5 kg of CO2 m-2year-1
(Reijnders and Huijbregts, 2008), 3.9 kg of CO2 m-2year-1
(Fargioni et al. 2008). Muruyama and Bakar (1996) have estimated an amount of 54 t CO2-eq ha-1 year-1 emitted
from oil palm plantations on peat at 80 cm drainage depth. As mentioned earlier, during the economic planting period of 25-30 years on mineral soil, oil palm plantation stored carbon at about 5.2 to 8 t ha-1 year-1 which may
absorbed about 130-200 t of CO2-eq. The six (6) years
planted A. crassicarpa on peatland has above ground
biomass value of 138.32 t ha-1 which has a total carbon
stock of 28.39 t ha-1 or equal to 104.18 t of CO2-eq ha-1. If
both carbon stock values were compared, this showed that the ability of oil palm and A. crassicarpa to absorb CO2
were less than the CO2 emission from opening of 30 cm
depth of peatland. This produced a contradictive situation in term of Greenhouse Gas emission reduction efforts, because those plants produce less carbon stocks compared to peatland clearance. In other words, this indicated that even though plants occupied peatland area, however high emissions of Greenhouse Gas were still produced. Thus, if an oil palm or industrial plantation would be established on peatlands, they should have carbon stock or higher ability
to absorb CO2 than during peatland clearance, otherwise
there would be no significant emission reductions occurred and high risk impacts would eventually created. Therefore, it can be said that carbon stock could be used as a baseline or might be used as a limiting factor for environmental sound activities especially for oil palm plantation and industrial forest plantation on peatlands in order to achieve significant reductions of greenhouse gas emission.
CONCLUSION
Reduction of Greenhouse Gas emission is the solution in minimizing the negative impacts of global climate change where it needs mitigation and adaptation efforts. Global climate change is actually the product of development, meaning that its reduction must come from the development itself. Reduction of greenhouse gas emission on peatland should start prior to land clearance activity. This means that carbon stock calculation should be carried out prior to plantation activities where the results should be compared to the established commodities of the future existing plantation as a compensation mechanism, which would provide one of the best solutions in reducing greenhouse gas emissions.
ACKNOWLEDGEMENTS
I thank Nugroho in Kuaro, Paser District of East Kalimantan Province, who allowed me to cut his 25 years old oil palms for biomass measurement and also to Sawit Watch that facilitates the research.
REFERENCES
ADB [Asian Development Bank] (2009) The economic of climate change in Southeast Asia: Regional Review. Asian Development Bank. Manila, The Philippines.
Andriesse JP (1974) Tropical lowland peats in southeast Asia, Communication Vol. 63. Koninklijk Instituut voor de Tropen, Amsterdam, The Netherlands.
Brinkman A (2009) Greenhouse gas emissions from palm oil production. Brinkman Consultancy. Hoevelaken, The Netherlands.
Fargioni J, Hill J, Tilman D, Polasky S, Hawthorne P (2008). Land clearing and the biofuel carbon debt. Science 29: 1235-1238. Freibauer A, Rounsevell MDA , Smith P, Verhagen A (2004) Carbon
sequestration in European agricultural soils. Geoderma 122: 1-23. Germer J, Sauerborn J (2008) Estimation of the impact of oil palm
plantation establishment on greenhouse gas balance. Environ, Develop Sustain 10: S. 697-716.
Henson IE (2008) The carbon cost of palm oil production in Malaysia. Planter 84: 445-464.
Hooijer A, Silvius M, Wösten H, Page S (2006) PEAT-CO2, Assessment of CO2 emissions from drained peatlands in SE Asia. Delft Hydraulics report Q3943. Delft, the Netherland.
Hooijer A, Page S, Canadell JG, Silvius M, Kwadijk J, Wösten H, Jauhiainen J (2010). Current and future CO2 emissions from drained peatlands in Southeast Asia. Biogeosci 7: 1505-1514.
IPCC [Intergovernmental Panel on Climate Change] (2007) Climate change 2007: mitigation of climate change. Contribution of Working Group III to the Fourth Assessment Report of the Intergovernmental Panel on Climate Change. Cambridge University Press. Cambridge, UK.
Limbong H (2009) Potential carbon of Acacia crassicarpa stand on the former burned peatlands: a case study at PT. SBA Wood Industries, South Sumatra. [M.Sc. Thesis]. School of Graduates, Bogor Agricultural University. Bogor.
Melling L, Hatano R, Goh KJ (2005) Soil CO2 flux from three ecosystems in tropical peatland of Sarawak, Malaysia. Tellus 57B: 1-11.
Melling L, Goh KJ, Beauvais C, Hatano R (2007) Carbon flow and budget in a young mature oil palm agroecosystem on deep tropical peat. In: Carbon-climate-human interaction on tropical peatland. In: Rieley JO, Banks CJ, Radjagukguk B (eds) Proceedings of the International Symposium and Workshop on Tropical Peatland, Yogyakarta, 27-29 August 2007.
Muruyama S, Bakar ZA (1996) Decomposition of tropical peat soils. Estimation of in situ decomposition by measurement of CO2-flux.
Japan Agric Res Quart 30: 153-158.
Page SE, Siegert F, Rieley JO, Boehm H-DV, Jaya A, Limin S (2002) The amount of carbon released from peat and forest fires in Indonesia in 1997. Nature 420: 61-65.
PEACE [Pelangi Energi Abadi Citra Enviro] (2007) Indonesia and climate change: current status and policies. The World Bank. Jakarta Reijnders L, Huijbregts MAJ (2008). Palm oil and the emission of
carbon-based greenhouse gases. J Cleaner Product 16: 477-482.
Siregar U, Massijaya Y, Jaya A (2004) Final report baseline study on carbon stock in peat swamp forest due to land use change in Central Kalimantan. JICA. Tokyo.
Sorensen KW (1993) Indonesian peat swamp forest and their roles as a carbon sink. Chemosphere 27 (6): 1065-1082.
Tjitrosemito S, Mawardi I (2000) Terrestrial carbon stock in oil palm plantation. SEAMEO-BIOTROP. Bogor.
Wicke B, Dornburg V, Junginger M, Faaij A (2008). Different palm oil production systems for energy purposes and their greenhouse gas implications. Biomass Bioenerg 32: 1322-1337.