ISSN 0104-6632 Printed in Brazil
www.abeq.org.br/bjche
Vol. 24, No. 04, pp. 623 - 635, October - December, 2007
Brazilian Journal
of Chemical
Engineering
DYNAMIC SIMULATION OF THE
CARBON-IN-PULP AND CARBON-IN-LEACH PROCESSES
L. R. P. de Andrade Lima
Department of Materials Science and Technology, Federal University of Bahia, Phone: +(55) (71) 3283-9514, Fax: +(55) (71) 3283-9837,
C.P. 6974, CEP: 41810-971Salvador - BA, Brazil. E-mail: [email protected]
(Received: March 20, 2006 ; Accepted: July 28, 2007)
Abstract - Carbon-in-leach and carbon-in-pulp are continuous processes that use activated carbon in a
cascade of large agitated tanks, which have been widely used to recover or concentrate precious metals in gold extraction plants. In the carbon-in-pulp process adsorption occurs after the leaching cascade section of the plant, and in the carbon-in-leach process leaching and adsorption occur simultaneously. In both processes the activated carbon is moved from one tank to another in countercurrent with the ore pulp until the recovery of the loaded carbon in the first tank. This paper presents a dynamic model that describes, with minor changes, the carbon-in-leach, the carbon-in-pulp, and the gold leaching processes. The model is numerically solved and calibrated with experimental data from a plant and used to perform a study of the effect of the activated carbon transfer strategy on the performance of the adsorption section of the plant. Based on the calculated values of the gold loss in the liquid and of the gold recovered in the loaded activated carbon that leaves the circuit, the results indicate that strategies in which a significant amount of activated carbon is held in the first tank and the contact time between the carbon and the pulp is longer are the best carbon transfer strategies for these processes.
Keywords:Activated carbon; Adsorption; Gold; Leaching; Modeling; Optimization.
INTRODUCTION
Metal recovery or concentration by adsorption on activated carbon has been the dominant process for gold extraction after leaching by cyanide in aerated alkaline slurries. The continuous processes of gold recovery by adsorption on activated carbon in agitated tanks, namely the carbon-in-pulp (CIP) and the carbon-in-leach (CIL) processes, have been widely used since the 1970s. Due to the economic importance of these processes, their simulation has been receiving some attention for twenty years, especially in South Africa, Australia, and Canada. These studies have provided useful insights for process operation and optimization; however, some assumptions of these models, such as the reactor mass balances and the activated carbon transfer, are
in general very simplistic. The main goal of the present work is to provide an alternative improved model for the CIL process that can be applied to process performance evaluation.
Hancock, 1980; Habashi, 1987; Bailey, 1987; Yannopoulos, 1991; Marsden and House, 1992).
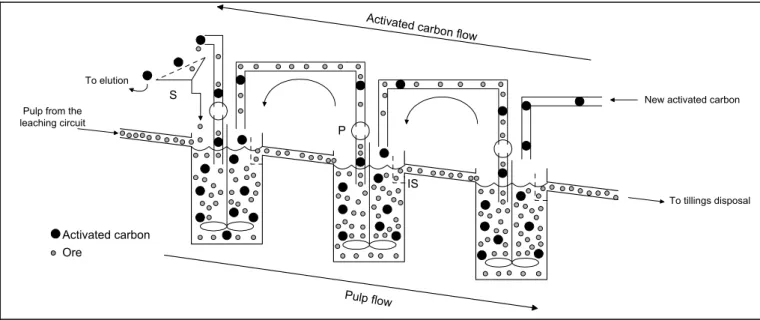
The CIL and CIP are slow processes, and in order to improve gold extraction and recovery, they occur continuously in a cascade of large agitated tanks. Figure 1 schematically shows the CIL or CIP circuit with three reactors. Note that the pulp flows by gravity from one tank to the next by overflow, the fresh activated carbon is added in the last tanks and the carbon moves intermittently in countercurrent with the pulp towards the elution process. Due to the fact that it is much larger than the ore particles, it can be easily separated by screening; therefore, note also in Fig. 1 that there are interstage screens (IS) at the reactor exit that confine the carbon in the tanks until the transfer pulp is activated. Reactors analogous to the conventional CIP and CIL tanks can also be used for gold leaching without adsorption.
The dynamic simulation of the CIP and CIL processes has received some attention since the 1980s, and some useful models are currently available to perform specific process optimization studies (Dixon et al., 1978; Nicol et al., 1984; Williams and Glasser, 1985; van Deventer, 1986; Carrier et al., 1987; Stange and King, 1987; Woollacott et al., 1990; Stange et al., 1990a,b; Stange, 1991, 1999; van Deventer and Ross, 1991; van der Walt and van Deventer, 1992; Schubert et al. 1993; van Deventer et al., 1994; Liebenberg and van Deventer, 1997a,b; Rogans et al., 1998; Coetzee and Gray, 1999; Rees and van Deventer, 2001; Rees et
al., 2001). The more detailed models available take into account competitive adsorption; carbon fouling by organic compounds and fine particles; carbon loading distribution; carbon loss by attrition; leaching and “preg-rubbing”; and macro and micropore diffusion kinetic control, but most of them assume perfect mixing in the reactors with no segregation, instantaneous carbon transfer, and constant solid and liquid holdup.
The main objective of this paper is to present an alternative general dynamic model that can be used to describe the carbon-in-leach process, but can also be easily simplified to describe the carbon-in-pulp and the gold leaching processes. This work is significant because the reactor description suggested here is more realistic than that used in most of the available models due to the fact that the evolution of solid, liquid, and activated carbon holdup are taken into account in the formulation, and the carbon transfer from one reactor to another is assumed to be a transient process in contrast with the commonly used assumption of instantaneous transfer.
This paper is organized as follows. First, the kinetic models for the processes of gold cyanidation and gold adsorption on activated carbon, and the mathematical model for the reactor are presented. Second, the calibration of the model for the leaching and the adsorption sections of a plant are presented. Third, a case study of the simulator with an analysis of the activated carbon transfer strategies is given. The conclusions are presented in final section.
Activated carbon Ore
To elution
New activated carbon
To tillings disposal Pulp from the
leaching circuit
P
IS S
Activated carbon flow
Pulp flow
Dynamic Simulation of the Carbon-in-Pulp and Carbon-in-Leach Processes 625
GOVERNING EQUATIONS
The detailed mathematical description of the simultaneous gold leaching and adsorption on activated carbon that occurs in the carbon-in-leach process is somewhat intrinsically complex such as the heterogeneous nature of the system that includes ore, activated carbon, aqueous solution, and gas; also there are several physical and chemical phenomena that happen simultaneously. In this section a model that includes leaching and adsorption on the carbon kinetics and the reactor is presented. In the next section the calibration and the use of this model is discussed.
In this study, for the sake of conciseness, the kinetics of only two simple models for gold leaching, cyanide consumption, and adsorption on activated carbon are presented; however, they can easily include other kinetic equations. These models are calibrated with data from a plant and the resulting equations are used to evaluate the carbon transfer strategy that will be discussed in the next section.
Kinetic Models
a) Adsorption on Activated Carbon
The detailed kinetic models for gold adsorption that include diffusion in the activated carbon particles or in the external film require the use of several parameters whose estimation using laboratory and plant experiments can be laborious. In this study, the simple linear adsorption-desorption rate equation is used.
In aqueous solutions, the adsorption of a single chemical specie on a substrate in a closed reactor and at constant temperature can be described by equilibrium isotherms, which are empirical equations that relate the concentration of the chemical species in the liquid phase (Cl) to their concentration on the surface of the substrate (Cc). The following classical adsorption isotherms have been used to describe gold adsorption on activated carbon: the linear
( Cc=A Cl ), the Freundlich ( n
Cc=A Cl ), and the
Langmuir (Cc= A Cl B+Cl ) (Dixon et al., 1978;
(
)
van Deventer, 1986). In the case of multiple component adsorption, these equations have been modified to account for competition between the solutes (van Deventer, 1986; van der Walt and van Deventer, 1992; Liebenberg and van Deventer,
1997a,b).Note that the linear isotherm is accurate for
low concentration systems, as is usually the case for gold adsorption (Dixon et al., 1978; van Deventer,
1986; van der Walt and van Deventer, 1992; Woollacott et al., 1990; Stange, 1991, 1999; Schubert et al., 1993).
The adsorption kinetic used in the present study is described by the lumped equation given by the linear adsorption-desorption equation, which assumes that adsorption is a reversible process (Dixon et al., 1978; Carrier et al., 1987; Woollacott et al., 1990; Stange, 1991,1999; Schubert et al., 1993):
(
*)
CB c d
R =k Cl Cc -Cc -k Cc (1)
where Cl is the gold concentration in the liquid
phase, Cc is gold content in the activated carbon, Cc*
is the maximum gold content of the activated carbon,
and kc and kd are empirical kinetic constants of
adsorption and desorption for gold. Note that under
equilibrium conditions (RCB=0) this model becomes
the classical Langmuir equation, where A = Cc* and
B = kd/ka.
b) Gold Cyanidation
The kinetics of three-phase reactions can be very complex; however, in many ore leaching systems the pseudohomogeneous approach has been sufficient to describe well the main features of the process (Rees and van Deventer, 2001; Rees et al., 2001; de Andrade Lima, 2001; de Andrade Lima et al., 2002; de Andrade Lima and Hodouin, 2005, 2006). For gold leaching, the kinetics may be empirically described as a second-order process with respect to the gold content of the ore and a first-order process with respect to the free cyanide concentration, as in the following lumped kinetic equation (de Andrade Lima, 2001; de Andrade Lima et al., 2002):
(
)
αAu
R =k Ccn Cs-Cs∞ (2)
where k is the rate constant, Ccn is the concentration of cyanide in the liquid phase, Cs is the
concentration of gold in the ore, Cs∞ is the residual
gold content of the ore, and α is the reaction order.
c) Free Cyanide Consumption
content, such as the losses by hydrolysis to hydrogen cyanide and ammonia and the oxidation to cyanate or cyanogen; the rate of consumption is thus (Adams, 1990; de Andrade Lima, 2001; de Andrade Lima et al., 2002; de Andrade Lima and Hodouin, 2006):
CN
R =e + f Ccn (3)
where Ccn is the cyanide concentration in the liquid phase, e is the zero-order rate constant, and f is the first-order rate constant.
Reactor Model
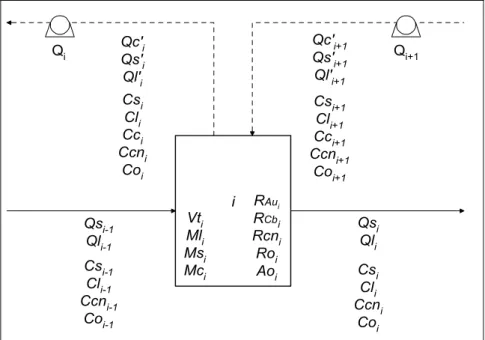
The CIL process takes place in large continuous stirred tank reactors (CSTRs) where the slurry flow behavior shows minor nonidealities (Carrier et al., 1987); in this study, the reactors are assumed to be ideal CSTRs. Figure 2 schematically shows a general CIL tank and the variables that can be used to describe this process, which include the flow rates, the concentrations, the holdups, the kinetic rates, the volume, and pump capacity. A dynamic model for the CIL process, assuming monosize particles, consists in conservation of the masses of the ore, liquid phase, carbon, gold in the ore, gold in the liquid phase, gold in the carbon, and cyanide in the liquid phase, as follows (Carrier et al., 1987; de Andrade Lima et al., 2002):
i
i-1 i i+1 i
dMs
=Qs -Qs +Qs - Qs
dt ′ ′ (4)
i
i-1 i i+1 i
dMl
=Ql -Ql +Ql - Ql
dt ′ ′ (5)
i
i+1 i
dMc
=Qc - Qc
dt ′ ′ (6)
[
i i]
i-1 i-1 i i
Au
i+1 i+1 i i i i
d Ms Cs
=Qs Cs -Qs Cs + dt
Qs Cs′ -Qs Cs -Ms R′
(7)
[
i i]
i-1 i-1 i i
Au Cb
i+1 i+1 i i i i i i
d Ml Cl
=Ql Cl -Ql Cl + dt
Ql′ Cl -Ql Cl +Ms R′ -Mc R
(8)
[
i i]
Cb
i+1 i+1 i i i i
d Mc Cc
=Qc Cc -Qc Cc +Mc R
dt ′ ′ (9)
[
i i]
i-1 i-1 i i
CN
i+1 i+1 i i i i
d Ml Ccn
=Ql Ccn -Ql Ccn + dt
Ql′ Ccn -Ql Ccn -Ml R′
(10)
where Qs is the ore flow rate, Ql is the liquid flow rate, Qc is the carbon flow rate, Cw is the solid concentration in the pulp, Ml is the liquid holdup, Ms is the ore holdup, Mc is the carbon holdup, Cs is the gold content of the ore, Cc is the gold content of the carbon, Cl is the concentration of gold in the liquid phase, Ccn is the cyanide concentration in the
liquid phase, RAu is the gold dissolution rate, RCN is
the rate of cyanide consumption, and RCb is the
kinetics of the adsorption of gold on the activated carbon. The subscripts “i-1,” “i,” and “i+1” stand respectively for the variable at the reactor entrance or in the previous reactor, inside the reactor, and in the next reactor. Note that the superscript “ ’ ” stands for the variable in the stream that transfers with the activated carbon.
Assuming that the segregation is negligible and the slurry volume holdup in the CSTRs is constant, the following closure equations hold (de Andrade Lima et al., 2002):
i i i
i
Ms Ml Mc
+ + =V
ρs ρl ρc (11)
i i i
i
Qs Ql Qc
+ + =Q
ρs ρl ρc
′ ′ ′
(12)
i i i
i
i i i i i i
Ms Qs Qs
= = =Cw
Ms +Ml Qs +Ql Qs +Ql
′
′ ′ (13)
(
)
i i
i i i i i i
i i
i
Mc Qc
= =
Ms +Ml +Mc Qs +Ql +Qc
1-Cw Cw
Ccb +
ρs ρl
′
′ ′ ′
(14)
where V is the net volume of the tank, ρs is the ore
density, ρl is the liquid density, ρc is the activated
carbon density, and Q is the volumetric capacity of the pumps that transfer the activated carbon.
Dynamic Simulation of the Carbon-in-Pulp and Carbon-in-Leach Processes 627
models for this process.
Eqs. 4 to 10 describe the ith CIL reactor with a
continuous transfer of activated carbon. However, by
setting the pump capacities (Qi) to zero, these
equations simplify and represent the process during the periods where there is no carbon transfer. In the CIL plants, the activated carbon transfer is intermittent; therefore, the time evolution of pump capacity can be assumed to be binary variables with values of zero for no transfer periods and of Q for the transfer periods. This approach, which describes what is occurring in the process, is more realistic and numerically flexible than the conventional approach,
which considers an instantaneous transfer of the activated carbon that results in different systems of equations for different stages of the transfer cycle (Carrier et al., 1987).
Equations 4 to 10 describe a general CIL reactor; however, by neglecting the reaction term in Eq. 7 they directly describe the CIP process. Also, by neglecting the carbon balance (Eq. 6); the gold balance on the carbon (Eq. 9); the ore, liquid, and carbon transfer (flow rates with superscript “ ’ ” in Eqs. 4, 5, 7, 8, 10, 12, 13 and 14); and the gold adsorption term in Eq. 8, they directly describe the simple leaching process.
i Csi-1
Cli-1 Ccni-1
Coi-1 Qs
i-1
Qli-1
Vti Ml
i
Msi Mc
i Csi
Cl
i
Ccni Co
i
Qsi Ql
i
Qc'
i
Qs'i Ql'i
Qc'
i+1
Qs'
i+1
Ql'i+1 Cs
i+1
Cli+1 Cc
i+1
Ccni+1 Co
i+1
Cs
i
Cli Cci Ccn
i
Coi
RAu
i
RCb
i
Rcni Ro
i
Aoi
Qi+1 Qi
Figure 2: Schematic diagram of the ith adsorption-leaching reactor of a cascade, showing the variables used in the model. Qs, Ql, and Qc are the ore, liquid, and carbon flow rates; Cs and Cc are the gold content of the ore and carbon; Cl, Co, and Ccn are the concentrations of gold, oxygen, and
free cyanide in the liquid phase, Ml, Ms, and Mc are the liquid, ore, and carbon holdups; RAu, Rcn,
Ro, Ao, and RCb are the rate constants for gold leaching, cyanide consumption, oxygen
consumption, addition of oxygen, and gold adsorption on activated carbon; Q is the carbon transfer pump capacity; and Vt is the net reactor volume.
Plant Simulation
The reactor model presented in the previous section describes the generic CIL reactor in a cascade; however, the equations for the first and last tanks of the cascade are slightly different due to the fact that from the first tank only the carbon is pumped to the elution section and in the last tank only the activated carbon is added (see Fig. 1) (Bailey, 1987; Carrier et al., 1987; de Andrade Lima, 2001). Therefore, the transferred pulp flow rates in Eqs. 4 to 10 are not included in the equations that
describe these tanks.
The CIL model can be directly solved using a numerical algorithm for differential-algebraic equations; however, the present case with algebraic manipulation gives two independent systems of ordinary differential equations, the first for the time evolution of the holdups and the second for the time evolution of the concentrations (de Andrade Lima, 2001; de Andrade Lima et al., 2002). Therefore, the governing equations are solved using an algorithm for ordinary differential equations.
transfer period, fractions of the activated carbon held in the reactors are intermittently transferred to other reactors. This operational procedure produces a blend of carbon with a high gold content and carbon with a low gold content (Stange and King, 1987; Woollacott et al., 1990; Stange et al., 1990a,b; Stange, 1991,1999). In this study, it is assumed that the empirical factors in the kinetic equation of gold adsorption for the blended carbon remain the same and they can be described by a weighted average concentration; therefore, the concentration of gold adsorbed on the activated carbon in each tank was calculated by considering the mass of gold on activated carbon initially present in the tank, the transferred mass of gold, and the transferred total mass of activated carbon.
Gold leaching and adsorption plants may have large reactors and intermittent recycling of the pulp with activated carbon. To perform the dynamic simulation of these processes, the simultaneous approach is used in each section of the plant, in which the governing equations for all tanks are solved at the same time, using the fourth-order Runge-Kutta method and the initial conditions, which are assumed to be the first measured
concentrations and estimated holdups.
MODEL CALIBRATION
The equations that describe the CIL and only leaching process are calibrated with the data from a plant that treats about 400 t/h of ore coming from twelve deposits located in the Eastern Goldfields Province, Yilgarn Craton, Western Australia (Roberts and Elias, 1990; Bax, 1996; de Andrade Lima, 2001; de Andrade Lima and Hodouin, 2006). The ore contains basalt and small amounts of
marcassite (FeS2), pyrite (FeS2), chalcopyrite (CuFeS2),
galena (PbS), sphalerite (ZnS), gersdorffite (NiAsS),
arsenopyrite (FeAsS), and pyrrhotite (Fe1-xS), but the
reactive sulfides content is very low (Roberts and Elias, 1990; Bax, 1996). Samples were simultaneously taken at the entrance and outlet of each tank in the leaching and adsorption section of the plant every hour for 38 hours. After filtration of the sampled pulp, the liquid phase was analyzed. The pH was measured with a standard pH meter, the cyanide concentration was determined by titration with silver nitrate and rhodanine, and the concentration of gold was measured by atomic absorption spectrophotometry after extraction with di-iso-butil-ketone (Bax, 1996).
The solids were washed and the gold content
of the ore measured by fire assay and spectrophotometry of atomic absorption (Bax, 1996). Concentration of the solids was also given for each sample. Every two hours, samples of the pulp were taken and filtered to measure the concentration of carbon in the tanks and their gold content was measured by fire assay and atomic absorption spectrophotometry (Bax, 1996; de Andrade Lima, 2001; de Andrade Lima and Hodouin, 2006). The time evolution of the ore flow rates was measured at the entrance of the comminution-leaching section of the plant, but not at the leaching-adsorption circuit entrance; therefore in this study estimated values are used, by assuming that the comminution circuit behaves as a second-order system with a time constant of 0.37 hours.
Model Calibration for the Primary Leaching Section
For calibration of the model, corresponding to the
evaluation of α, k, e, and f and the net reactor
volume, the experimental data for the leaching section of the plant was fitted using a conventional unconstrained optimization method, namely the simplex method, and the following least squares criteria:
(
)
(
)
(
) (
)
2 2
it it it it
Cs
2 2
38 3 it it
1
2 2
t 1 i 1
it it it it
2 2
it it
ˆ ˆ
Cs Cs Cl Cl
ω
Cs Cl
J
ˆ ˆ
Ccn Ccn Cw Cw
Ccn Cw
= =
− −
+ +
=
− −
+
∑∑
(15)where Cs, Cl, Ccn, and Cw are respectively the concentrations of gold in the solid and in the liquid phase, the free cyanide concentration in the liquid phase, and the solid concentration in the pulp. The superscript “^” stands for estimated variable and the subscripts “i” and “t” stand for tank number in the cascade and sample time respectively. Note that the measure of the gold content of the ore is not as precise as the other measures due to the low value and sampling difficulties; it is taken into account by
using the weighted factor ωCs in the criterion above.
In the leaching section of the plant, the net reactor
volume found is 1160 m3 and the best fit equation for
the gold leaching and for the cyanide consumption kinetics are (de Andrade Lima et al., 2002):
(
)
2.15 -3Au
Dynamic Simulation of the Carbon-in-Pulp and Carbon-in-Leach Processes 629
2 CN
R =3.43 +1.47 10× − Ccn (mg/kg·h) (17)
The reaction order in Eq.16 is about two, as was already reported in the literature, and the residual gold content of the ore was assumed to be 0.14 mg/kg because this value is found in the plant tilling after the leaching and adsorption sections. The high value of the zero-order constant for the cyanide consumption kinetics (Eq. 17) indicates a strong presence of cyanide consumers. The estimated net volume of the tank is about 60% of the nominal volume, which is explained by the presence of the gas phase, the deflectors of the baffles, the ore deposits, and the mechanical parts of the agitator. The measured and calibrated values for the gold content of the ore, gold and cyanide concentrations in the liquid phase, and solid concentration in the pulp, not shown here, show a small amount of noise and fluctuation but the overall results are very good (see de Andrade Lima et al., 2002).
Model Calibration for the CIL Section
In the CIL section of this plant the activated carbon is transferred from one tank to the previous one in countercurrent with the pulp by using a specific pumping sequence, for which a binary behavior is found; zero stands for no pumping period, while one stands for the pumping period. In the present case pumps 3, 4, 5, and 6 are synchronized, while the other pumps are activated following other criteria. In the present case the
transfer capacities of pumps 1 to 7 are 90 m3 of pulp
per hour, while the rate of transfer of activated
carbon to the last tank is about 0.6 m3 of activated
carbon per hour (for details, see de Andrade Lima, 2001).
Gold dissolution in this section of the plant is weak because the gold content of the ore is low; in addition, there are uncertainties on the measurements, especially for the first two tanks. However, for proposes of illustration it is taken into account in the simulations presented in this study. The kinetic parameters previously estimated for the gold leaching kinetics in the primary leaching
section of the plant (see Eqs. 16) are used in the
simulations.
For calibration of the simulator, the kinetic
parameters of adsorption (kc, kd, and Cc
*
) and the cyanide consumption kinetic constants (e and f)
were estimated using the relative least squares criteria:
(
)
238 7
it it
2 2
t 1 i 1 it
ˆ
Ccn Ccn
J
Ccn = =
−
=
∑∑
(18a)(
) (
2)
238 7
it it it it
3 2 2
t 1 i 1 it it
ˆ ˆ
Cl Cl Cc Cc
J
Cl Cc
= =
− −
= +
∑∑
(18b)where Cl, Cc, and Ccn are respectively the concentrations of gold in the liquid phase, gold content of the activated carbon, and the free cyanide concentration in the liquid phase. The subscript “^” stands for estimated variable and the subscripts “i” and “t” stand for tank number in the cascade and
sample time respectively. Note that J2 is a function of
e and f and is independent of adsorption parameters
and J3 is a function of ka, kd, and Cc* and is
independent of adsorption parameters; therefore, these criteria were minimized separately by using a conventional unconstrained optimization method, namely the gradient conjugated method.
In the adsorption section of the plant the best fit equations for the adsorption kinetics and the cyanide consumption kinetics are:
(
)
-2 4
CB -23
R =9.10 10 Cl 1.439 10 Cc
-6.27 10 Cc (mg/kg h)
× ×
×
(19)
-2 5
CN
R
=5.46 10 + 3.94 10 Ccn
×
×
− (mg/kg h) (20)The values of the estimated parameters for the kinetic equation of adsorption agree with the values found in the literature (Carrier et al., 1987; Stange, 1991,1999; Schubert et al., 1993), where the maximum activated carbon loading (Cc*) is generally between
3600 and 14200 mg/kg and the rate constant (ka)
between 0.012 and 0.12 kg/mg h. The desorption rate
constant (kd) found is lower that the value found in the
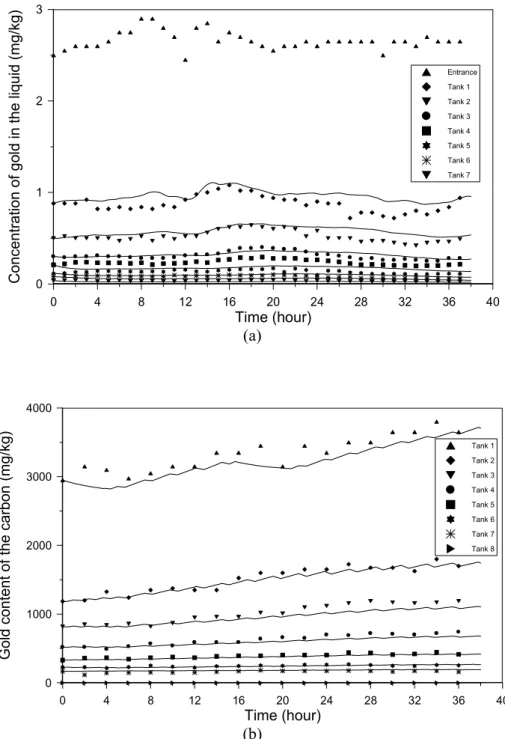
Figures 3a and 3b show the dynamic measured variables and the results of the calibration for the seven adsorption tanks. One can observe that the simulator represents well the variations in gold concentration in the liquid phase and gold content of the carbon. In spite of the high degree of measurement uncertainty and the
low gold content of the ore, the evolution of gold content of the solid and the free cyanide concentration with time, not shown here, are acceptable. In partial summary, the overall results of the plant calibration are good and the proposed model describes well the main features of the process dynamics.
0 4 8 12 16 20 24 28 32 36 40
Time (hour)
0 1 2 3
C
oncentr
a
ti
on
of go
ld
i
n
the l
iqui
d (
m
g/kg
)
Entrance Tank 1 Tank 2 Tank 3 Tank 4 Tank 5 Tank 6 Tank 7
(a)
0 4 8 12 16 20 24 28 32 36 40
Time (hour)
0 1000 2000 3000 4000
Gol
d
content
of the car
bon (
m
g/kg
)
Tank 1 Tank 2 Tank 3 Tank 4 Tank 5 Tank 6 Tank 7 Tank 8
(b)
Dynamic Simulation of the Carbon-in-Pulp and Carbon-in-Leach Processes 631
EVALUATION OF THE ACTIVATED CARBON TRANSFER STRATEGIES
In this study, the leaching and adsorption circuits of the plant, which were calibrated in the previous section, are simulated and the effect of the carbon transfer strategy in the adsorption section is analyzed. The study of the activated carbon transfer strategies in the CIL and CIP processes is a practical problem of interest for both the design and the operation of gold extraction plants (Carrier et al., 1987; Stange, 1991, 1999; Schubert et al., 1993; Rogans et al., 1998; Coetzee and Gray, 1999). The use of simulators to analyze this problem is very useful because experiments in pilot plants are expensive and complex. Some results are available from previous studies using other minerals and operational conditions (Stange, 1991). In the present study, other strategies not addressed yet are taken into account and the simulated flow rate and concentrations are used to calculate the performance indices to be used for a systematic comparison between the strategies, which helps identifing the carbon transfer strategies most relevant to this process.
The evaluation of the carbon transfer strategies uses the following metallurgical performance indices:
(i) Total amount of gold fed into the circuit:
( )
( )
( ) ( )
tf
0 0 0 0
ti
Cs t Qs t +Cl t Ql t dt
∫
(21)(ii) Amount of gold recovered by activated carbon at the exit of the adsorption circuit:
( )
( )
tf
1 1
ti
Cc t Qct t dt
∫
(22)(iii) Amount of gold lost with the liquid phase at the adsorption circuit exit:
( ) ( )
tf
7 7
ti
Cl t Ql t dt
∫
(23)(iv) Amount of gold lost with the ore at the adsorption circuit exit:
( )
( )
tf
7 7
ti
Cs t Qs t dt
∫
(24)(vi) Amount of gold accumulated in the circuit:
( )
( )
( )
( )
( )
( )
( )
( )
( )
( )
0 0 0 0
tf
1 1 7 7
ti
7 7
Cs t Qs t +Cl t Ql t
Cc t Qct t Cl t Ql t dt
Cs t Qs t
−
− −
∫
(25)(vii) Amount of carbon added to the adsorption circuit:
( )
tf7 ti
Qct t dt
∫
(26)(viii) Free cyanide lost at the exit of the adsorption circuit:
( ) ( )
tf7 7
ti
Ccn t Ql t dt
∫
(27)where Cs is the gold content of the ore, Cc is gold content of the carbon, Cl is the gold concentration in the liquid solution, Ccn is the cyanide concentration in the liquid solution, Ql is the liquid flow rate, Qs is
the solid flow rate, Qct is the carbon flow rate, ti is
the initial simulation time, and tf is the final
simulation time. Subscript “1” stands for inside the first tank and “7”, for the exit of the last tank.
The following strategies of sequential transfer of carbon in the adsorption circuit are simulated for 37 hours and then the metallurgical performance indices are calculated and analyzed:
(a) Strategy #1: Sequential transfer starting in the first tank. After five hours of rest (without carbon transfer), the loaded activated carbon is transferred from the first tank to the elution process for one hour, and after another hour of rest the activated carbon is transferred from the second tank to the first. This procedure is repeated for the other tanks until new activated carbon is added in the seventh tank. After one hour of rest the transfer cycle is repeated.
another hour of rest the activated carbon is transferred from the seventh to the sixth tank, and after an additional hour of rest the activated carbon is transferred from the sixth to the fifth tank. This procedure is repeated for the other tanks until the loaded activated carbon has been transferred from the first tank to the elution process. After one hour of rest the transfer cycle is repeated.
(c) Strategy #3: Sequential transfer starting in the last less one tank. After five hours of rest the activated carbon is transferred from the sixth to the fifth tank, after another hour of rest the activated carbon is transferred from the seventh to the sixth tank, after an additional hour of rest new activated carbon is added to the seventh tank during one hour, and then after another hour of rest the activated carbon is transferred from the fifth tank to the fourth. This procedure is repeated for the other tanks until the loaded activated carbon has been transferred from the first tank to the elution process. After one hour of rest the transfer cycle is repeated.
(d) Strategy #4: Sequential transfer starting in the last tank with synchronization of the pumps. This strategy is similar to strategy 2 except that the activated carbon transfer from the sixth to the fifth tank, the fifth to the fourth tank, the fourth to the third tank, and the third to the second tank is synchronized. After one hour of rest the transfer cycle is repeated.
(e) Strategy #5: This strategy is similar to strategies 2 and 4 except that the activated carbon transfer from the seventh to the sixth tank, the sixth to the fifth tank, the fifth to the fourth tank, the fourth to the third tank, and the third to the second tank is synchronized. After one hour of rest the transfer cycle is repeated.
(f) Strategy #6: Sequential transfer starting in the last tank with synchronization of the pumps. This strategy is similar to strategies 2, 4, and 5 except that the addition of new activated carbon in the seventh tank and the transfer of the seventh to the sixth tank, the sixth to the fifth tank, the fifth to the fourth tank, the fourth to the third tank, and the third to the second tank are synchronized. After one hour of rest the transfer cycle is repeated.
(g) Strategy #7: Sequential transfer starting in the last tank with synchronization of the pumps. This strategy is similar to strategies 2, 4, 5, and 6 except
that the addition of new activated carbon in the seventh tank and the transfer of the seventh to the sixth tank, the sixth to the fifth tank, the fifth to the fourth tank, the fourth to the third tank, the third to the second tank, and the second to the first tank are synchronized. After one hour of rest the transfer cycle is repeated.
(h) Strategy #8: Sequential transfer starting in the last tank with synchronization of the pumps. This strategy is similar to strategies 2, 4, 5, 6, and 7 except for addition of new activated carbon in the seventh tank and synchronization of all the transfer pumps. After one hour of rest the transfer cycle is repeated.
(i) Strategy #9: Sequential transfer starting in the fifth tank. After five hours of rest the activated carbon is transferred from the fifth to the fourth tank, after another hour of rest the activated carbon is transferred from the sixth to the fifth tank, after an additional hour of rest the activated carbon is transferred from the seventh to the sixth tank, then after another hour of rest new activated carbon is added to the seventh tank during one hour, and after one more hour of rest the activated carbon is transferred from the fourth to the third tank. This procedure is repeated for the other tanks until the loaded activated carbon has been transferred from the first tank to the elution process. After one hour of rest the transfer cycle is repeated.
Dynamic Simulation of the Carbon-in-Pulp and Carbon-in-Leach Processes 633
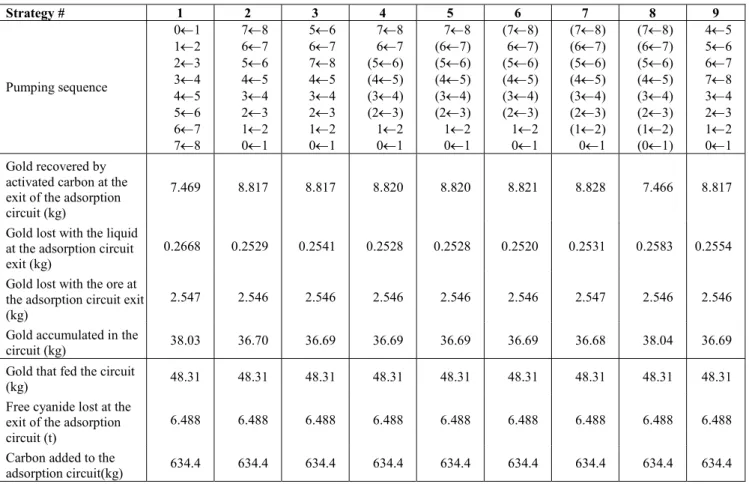
Table 1: Performance indices for different carbon transfer sequence strategies
Strategy # 1 2 3 4 5 6 7 8 9
Pumping sequence
0←1 1←2 2←3 3←4 4←5 5←6 6←7 7←8
7←8 6←7 5←6 4←5 3←4 2←3 1←2 0←1
5←6 6←7 7←8 4←5 3←4 2←3 1←2 0←1
7←8 6←7 (5←6) (4←5) (3←4) (2←3) 1←2 0←1
7←8 (6←7) (5←6) (4←5) (3←4) (2←3) 1←2 0←1
(7←8) 6←7) (5←6) (4←5) (3←4) (2←3) 1←2 0←1
(7←8) (6←7) (5←6) (4←5) (3←4) (2←3) (1←2) 0←1
(7←8) (6←7) (5←6) (4←5) (3←4) (2←3) (1←2) (0←1)
4←5 5←6 6←7 7←8 3←4 2←3 1←2 0←1 Gold recovered by
activated carbon at the exit of the adsorption circuit (kg)
7.469 8.817 8.817 8.820 8.820 8.821 8.828 7.466 8.817
Gold lost with the liquid at the adsorption circuit exit (kg)
0.2668 0.2529 0.2541 0.2528 0.2528 0.2520 0.2531 0.2583 0.2554 Gold lost with the ore at
the adsorption circuit exit (kg)
2.547 2.546 2.546 2.546 2.546 2.546 2.547 2.546 2.546 Gold accumulated in the
circuit (kg) 38.03 36.70 36.69 36.69 36.69 36.69 36.68 38.04 36.69 Gold that fed the circuit
(kg) 48.31 48.31 48.31 48.31 48.31 48.31 48.31 48.31 48.31
Free cyanide lost at the exit of the adsorption circuit (t)
6.488 6.488 6.488 6.488 6.488 6.488 6.488 6.488 6.488 Carbon added to the
adsorption circuit(kg) 634.4 634.4 634.4 634.4 634.4 634.4 634.4 634.4 634.4
In this case study the most important performance indices are the amount of gold recovered, the amount of gold lost in the liquid, and the amount of gold held in the circuit. By analyzing these indices one can observe that for strategy #1 the amount of gold recovered is very small, the amount of gold lost is very large, and a lot of gold is accumulated; on the other hand, for strategy #7 the amount of gold recovered is large, the amount of gold lost is small and less gold is accumulated than in strategy #1. These results indicate that strategy #1 can not be recommended and strategy #2 and its variants are the best.
Synchronization of carbon transfer pumps (strategies 4, 5, 6, 7, and 8) may give better results than the sequential strategy when the amount of carbon loaded in the first tank is larger (see strategies 2 and 4, 5 and 6); however, the performance of the process in the case where all pumps are transferring the carbon simultaneously (strategy #8) is as bad as that of strategy #1 because the residence time of the carbon in the rich solution in the first tank is very small. These results are in agreement with previous simulation studies performed for CIL and CIP processes (Stange, 1991).
Finally, one can observe that strategy 6 is the most effective in decreasing the gold loss in the liquid phase and increasing gold recovery with values larger than those for strategies 1 and 2. Note that as one increases the mixing in the circuit by turning on the transfer pumps simultaneously (strategies 4, 5, 6, 7, and 8), the gold recovery reaches a maximum value for strategy 7 and thereafter decreases, while the loss of dissolved gold reaches a minimum value for strategy 6 and thereafter increases again.
CONCLUSIONS
well the plant dynamics; also the kinetic parameters found are in agreement with those presented in the literature. The two sections of the plant were simulated together and several carbon transfer strategies were analyzed using as performance indicators, metallurgical indices. In spite of the fact that the simulated plant was not completely in a stable cyclic regime, the simulated results indicate that there are more appropriate strategies for enhancing the gold recovery in activated carbon and for reducing gold loss in the liquid phase, especially that in which an important amount of activated carbon is held in the first tank and the contact time between the carbon and the pulp is long.
ACKNOWLEDGMENTS
This research was supported by the Conselho
Nacional de Desenvolvimento Científico e Tecnológico (CNPq, Brazil). Daniel Hodouin (Laval University, Canada) and Ann Bax (Murdoch University, Australia) are gratefully acknowledged for the useful discussions and for providing the experimental data used in this work.
REFERENCES
Adams, M.D. (1990). The chemical behaviour of cyanide in the extraction of gold. 1. Kinetics of cyanide loss in the presence and absence of activated carbon, Journal of the South African Institute of Mining and Metallurgy, 90(2), 37-44. Bailey, P.R. (1987). Application of activated carbon
to gold recovery, In: The Extractive Metallurgy of Gold in South Africa, ed. Stanley, G.G., The South African Institute of Mining and Metallurgy, 379-614.
Bax, A. (1996), Personal Communication, Murdoch University, Australia.
Carrier, C., Hodouin, D., and Courchesne, M. (1987). Dynamic simulation of the CIP gold recovery process, In: Proceedings of the International Symposium on Gold Metallurgy, eds. R.S. Salter, D.M. Wyslouzil, and G.W. McDonald, Pergamon Press, 309-325.
Coetzee, J.W. and Gray, D.E. (1999). Counter-current vs co-Counter-current flow in carbon-in-pulp adsorption circuits, Minerals Engineering, 12(4), 415-422.
de Andrade Lima, L.R.P. (2001). Modeling, control, and optimization applied to the gold hydrometallurgy, Ph.D. Thesis, Laval University,
Canada.
de Andrade Lima, L.R.P., Hodouin, D., and Bax, A. (2002). Comparison of empirical and phenomenological approaches to the analysis of gold cyanidation plant performance. In: Laplante, A. (ed.), Proceedings of the International Symposium on Gold Recovery. CIM Special Volume, no. 51, pp. 45-55.
de Andrade Lima, L.R.P. and Hodouin, D. (2005). A lumped kinetic model for gold cyanidation, Hydrometallurgy, 79 (3-4), 121-137.
de Andrade Lima, L.R.P. and Hodouin, D. (2006). Simulation study of the optimal distribution of cyanide in a gold leaching plant, Minerals Engineering, 19(13), 1319-1327.
Dixon, S., Cho, E.H., and Pitt, C.H. (1978). The interactions between gold cyanide, silver cyanide and high surface area charcoal, AIChE Symposium Series, 74(173), 75-83.
Habashi, F. (1987). One hundred years of cyanidation, CIM Bulletin, 80, 108-114.
Liebenberg, S.P. and van Deventer, J.S.J., (1997a). The dynamic simulation of in-pulp sorption processes using the lumping of competitive and fouling phenomena, Minerals Engineering, 10(9), 959-972.
Liebenberg, S.P. and van Deventer, J.S.J. (1997b). The realistic simulation of CIP plants using practical measures of competitive adsorption and fouling, Proceedings of the XX International Mineral Processing Conference, Aachen, 381-389.
Marsden, J. and House, I. (1992). The Chemistry of Gold Extraction, Ellis Horwood,
McDougall, G.J. and Hancock, R.D. (1980). Activated carbon and gold – A literature survey, Minerals Science and Engineering, 12(2), 85-99. Nicol, M.J., Fleming, C.A. and Cromberge, G.
(1984). The adsorption of gold cyanide onto activated carbon. II: Applications of the kinetic model to multistage absorption circuits, Journal of the South African Institute of Mining and Metallurgy, 84, 50-54.
Rees, K.L. and van Deventer, J.S.J. (2001). Gold process modelling. I. Batch modelling of the processes of leaching, preg-robbing and adsorption onto activated carbon, Minerals Engineering, 14(8), 753-773.
Rees, K.L., van Deventer, J.S.J., and Dunne, R.C. (2001). Gold process modelling. II. The effect of ore type on leaching and adsorption dynamics at telfer gold mine, Minerals Engineering, 14(8), 887-900.
Dynamic Simulation of the Carbon-in-Pulp and Carbon-in-Leach Processes 635
the St Ives-Kambalda region. In: Hughes, F.E. (ed.), Geology and Mineral Deposits of Australia and Papua-New Guinea. The Australasian Institute of Mining and Metallurgy, Melbourne. pp. 479-491.
Rogans, E.J., MacIntosh, A.J., Morrison, N., and Schoeman, N. (1998). Carbon-in-pulp and carbon-in-leach adsorpion circuits – Optimization of design using the carousel system, In Proceedings of the Canadian Mineral Processing Conference, Ottawa, 639-663.
Schubert, J.H., Barker, I.J., and Swartz, C.L.E. (1993). Performance evaluation of a carbon-in-pulp plant by dynamic simulation, Journal of the South African Institute of Mining and Metallurgy, 93 (11-12), 293-299.
Stange, W. (1991). The optimization of the CIP process using mathematical and economic models, Minerals Engineering, 4(12), 1279-1295.
Stange, W. (1999). The process design of gold
leaching and carbon-in-pulp circuits, Journal of the South African Institute of Mining and Metallurgy, 99, 13-25.
Stange, W. and King, R.P. (1987). A population balance approach to the modeling of CIP process, In: Proceedings of the 20th International Symposium on the Application of Computers and Mathematics in the Mineral Industries, 209-221. Stange, W., King, R.P., and Woollacott, L. (1990a).
Towards more effective simulation of CIP and CIL processes. 2. A population-balance-based simulation approach, Journal of the South African Institute of Mining and Metallurgy, 90, 307-314. Stange, W., Woollacott, L., and King, R.P. (1990b).
Towards more effective simulation of CIP and CIL processes. 3. Validation and use of a new
simulator, Journal of the South African Institute of Mining and Metallurgy, 90, 323-331.
van Deventer, J.S.J. (1984). Kinetic models for the adsorption of gold onto activated carbon, In Proceedings of Mintek 50: International Conference on Mineral Science and Technology, South Africa, 487-494.
van Deventer, J.S.J. (1986). Competitive equilibrium adsorption of metal cyanides on activated carbon, Separation Science and Technology, 21(10), 1025-1037.
van Deventer, J.S.J. and Ross, V.E. (1991). The dynamic simulation of carbon-in-pulp systems: A review of recent developments, Minerals Engineering, 4(7-11), 667-681.
van Deventer, J.S.J., Lorenzen, L., van der Merwe, P.F., Morrison D.W., and van der Westhuysen, J.P.W. (1994). The fundamentals of unit operations in CIP plants: A progress report, Minerals Engineering, 7(2-3), 265-278.
van der Walt, T.J. and van Deventer, J.S.J. (1992). Non-ideal behaviour in counter-current in-pulp adsorption cascades, Minerals Engineering, 5(10-12), 1401-1420.
Williams, D.F. and Glasser, D. (1985). The modelling and simulation of processes for the absortion of gold by activated charcoal, Journal of the South African Institute of Mining and Metallurgy, 85(8), 237-243.
Woollacott, L., Stange, W., and King, R.P. (1990). Towards more effective simulation of CIP and CIL processes. 1. A modelling of adsorption and leaching, Journal of the South African Institute of Mining and Metallurgy, 90, 275-282.