ANATOMY OF SOLAR CYCLE
LENGTH AND SUNSPOT NUMBER:
DEPENDENCE OF AVERAGE GLOBAL
TEMPERATURE ON SOLAR ACTIVITY
A. B. BHATTACHARYA†
Department of Physics, University of Kalyani, Kalyani 741235, West Bengal, India
B. RAHA
Department of Physics, University of Kalyani, Kalyani 741235, West Bengal, India
T. DAS
Department of Physics, University of Kalyani, Kalyani 741235, West Bengal, India
M. DEBNATH
Department of Physics, University of Kalyani, Kalyani 741235, West Bengal, India [email protected]
D. HALDER
Department of Physics, University of Kalyani, Kalyani 741235, West Bengal, India
Abstract :
The paper examines thoroughly all the past 23 sunspot cycles and the associated 11 hale cycles. It is noticed that solar cycle 23 had a deep minimum with longest decline phase. When solar cycles 20 to 23 are compared with solar cycles 1 to 4, the forthcoming Dalton minimum can be expected. The predicted variation of sunspot number for the present solar cycle 24 is examined at length and it appears that the peak monthly sunspot number of the solar cycle 24 will be around 80. We have correlated the solar cycle length and peak sunspot number with a priority to the solar cycle 24. From an elaborate analysis it appears that the most common cycle length is around 10.5 years, with few cycles in the range 11.5 to 12.5 years. Global temperature depends upon the total solar irradiance which in turn depends on duration of solar cycle. Also cloud cover directly depends on the solar irradiance. Our analysis supports that the global temperature is governed by the length of the predicted cycle. From the increased length of solar cycle 23, we have estimated the temperature variation of cycle 24. The predicted result reassures that average global temperature will be decreased for next few solar cycles due to typical solar activity. The results have been interpreted emphasizing the formation of type III solar radio bursts caused by plasma excitation.
Keywords: Solar cycle length; Sunspot number; Global temperature.
1. Introduction
present century related to solar activity forecasts equivalent to a new Ice Age, with the minimum temperature achieved by the middle of this century and our society should prepare a response to deal with global cooling that will be occurring in the next decades. The paper re-looks the changing solar activity and examines the possibility of global fall of temperature under the prevailing condition. We have also considered the formation of type III solar radio bursts to examine the sunspot cycle length particularly the intervals between consecutive maxima and minima.
2. Solar variation
Out of the various solar activity events the most prominent one is the 11-year solar cycle. Fig. 1 shows the variation of average sunspot number and duration for sunspot cycles while Fig. 2 reveals the variation of those two parameters for the double sunspot cycles, technically named as Hale cycles [Bhattacharya et al. (2011a), Javaraiah et al. (2005)]. The peak and the minimum values of the parameters are evident from the figure.
Fig. 1. Variation of average sunspot number and duration (years) for sunspot cycles.
Fig. 2. Variation of average sunspot number and duration (years) of the Hale Cycle.
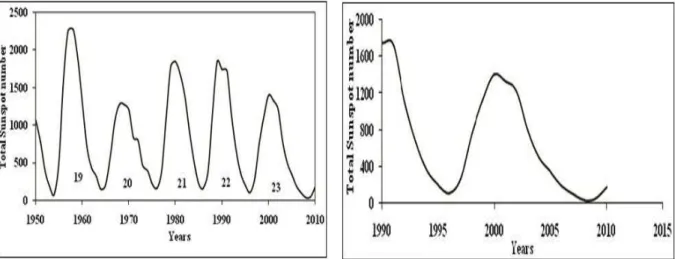
We next note the deep minimum of solar cycle 23, the deepest during the last 140 years. This cycle was started in May 1996 and had its peak in April 2000. The decline phase of this period extended from 2002 until December 2008 which is the longest decline phase in the last 23 solar cycles. On the other hand, solar cycle 24 started in December 2008; it was started at late about three and half years later than the average of the strong cycles in the last 20th century and almost three year later than the weak cycles of the late 19th century. Fig. 3 shows the variation of total sunspot numbers of the years 1950 to 2010 and Fig. 4 shows the longest decline phase of solar cycle 23.
3. Prediction of solar cycle 24
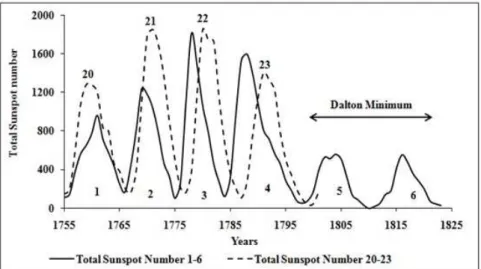
In Fig. 5 we have compared solar cycles 1-4 with solar cycle 20-23. Solar cycle 5 and 6 of the Dalton minimum have also presented in the same figure. It appears that the solar cycle 22 and 23 are very similar to solar cycle 3 and 4 which preceded the Dalton Minimum [http.//www.sidc.be/sunspot_data, Bhattacharya et al. (2011b)].
Fig. 5.Comparison of solar cycles 1 to 4 with solar cycle 20 to 23.
Fig. 6 shows the variation of sunspot number over the years 1990 to 2020 which predicts some important information regarding the solar cycle 24. From the figure, it is clear that the peak amplitude of monthly sunspot number for the cycle 24 will be less than 80. Also the cycle 24 may resemble the solar cycle 5 or 6, as evident from Fig. 5.
Fig. 6.Monthly sunspot number observed (black line) and predicted (dotted line).
4. Solar Cycle Duration and Sunspot Number
variation. It appears from the figure that the magnitude of the maximum sunspot number changes in an oscillatory fashion.
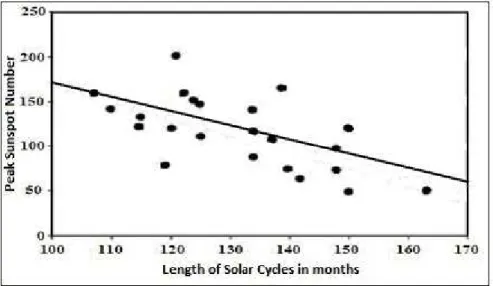
Fig. 7. Plot showing correlation between solar-cycle-length and peak sunspot number.
Fig. 8. Plot showing sunspot number vs. year. The dotted portion indicates the predicted sunspot number.
Fig. 9. Number of solar cycles of different duration.
5. Total Solar Irradiance and the Earth’s Atmosphere
Total solar irradiance becomes slightly lower during the periods of reduced sunspot activity and higher during periods of increased sunspot activity. The total effect of long solar cycles and low sunspot numbers offers in cumulatively more months on a decadal time scale with low average total solar irradiance as indicated in Fig. 10. The outcome is that weak and long solar cycles lead to cooling while intense and short cycles give rise to warming on a global basis. This can be re-confirmed from the consideration of Fig. 11.The behavior between solar activity and global basis temperature can be explained from the concept that sunspots are strong concentrations of magnetic flux at the surface of the sun. If the number of sunspot reduces, there is less solar wind allowing more galactic cosmic rays to enter into the earth’s atmosphere. This causes more cloud formation at low level and sunlight reflected by the cloud back into the space resulting less heating to the atmosphere of the earth.
Fig. 10. Plot of total solar irradiance vs. year [5,6]. Fig. 11. Same plot for the recent years [5, 6].
[http://lasp.colorado.edu/sorce/tsi_data/daily/sorce_tsi_L3_c24h_latest.txt].
6. Discussion
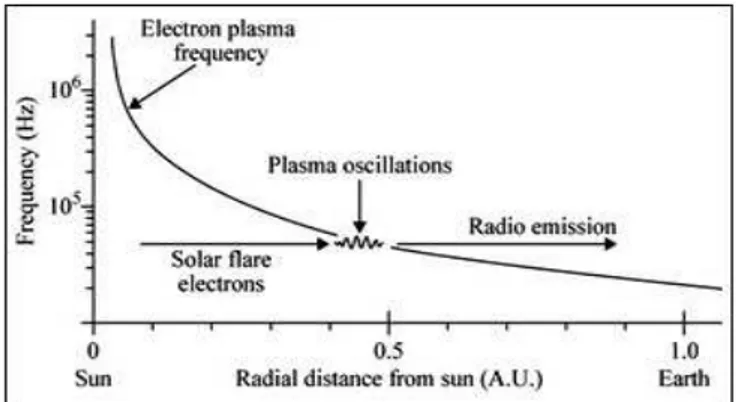
Astronomers believe that type III bursts are caused by plasma excitation from a stream of energetic electrons traveling upward in the corona of the sun [Friis-Christensen and Lassen (1991), Archibald (2009)]. Type III bursts can be observed where there is no activity at other wavelengths. It is a short-duration strong enhancement that drifts over a range of frequencies. Typically, the frequencies go from higher to lower over the course of the burst, which can be explained by the current theory of the creation of this type of activity. A beam-plasma system is unstable and tries to approach equilibrium by generating Langmuir waves, which are high frequency plasma waves at the local plasma frequency [Archibald (2006), Cairns et al. (2003)]. Langmuir waves scattered off ions and low-frequency turbulence which results in radiation at the fundamental or first harmonic of the local plasma frequency [Fig. 12.].
Fig. 12. The process of radio wave generation from solar flare electron in type III bursts.
Different spectral types of radio emissions are usually not used to define the solar cycles in relation to other solar parameters on the long term basis. Prediction of the solar activity is a complicated problem, resembling in some ways to terrestrial weather forecasting [Beckman and Mahoney (1998), http://www.nasa.gov/topics/solarsystem/features/spotless_sun.html]. The current Solar Cycle 24 is the cycle started in January 2008 and will peak in May 2013. There is a certain probability of the cycle to be a Dalton minimum as there are certain resemblance of cycles 1, 2, 3 and 4 with cycles 20, 21, 22 and 23. As cycles 5 and 6 have low activity so we can say that cycles 24 and 25 will be of very low sunspot activity [Bhattacharya et al.
(2008); Bhattacharya et al. (2010)].
Acknowledgments
We are thankful to the University Grants omission (UGC), India for financial support in this work (Sanction no. of the project F. No. 34-2/2008(SR), dated 31 Dec. 2008). B. Raha, a part time worker at present is thankful to the CSIR for awarding her a NET fellowship in which she will join from January 2012. D. Halder, a CSIR NET Fellow, expresses thanks to the funding agency for awarding him fellowship.
References
[1] Archibald, D. C. (2006): Solar cycles 24 and 25 and predicted climate response, Energy and Environment, 17(1), pp. 29-35. [2] Archibald, D. C. (2009): Solar cycle 24: Expectations and Implications, Energy and Environment, 20(1) , pp. 1-10.
[3] Beckman, J. E.; Mahoney, T. J. (1998): The Maunder Minimum and Climate Change: Have Historical Records Aided Current Research?, Library and Information Services in Astronomy III ASP Conference Series, 153, pp. 212-217.
[4] Bhattacharya, A. B.; Joardar, S.; Bhattacharya, R. (2008): Astronomy and Astrophysics, Infinity Science Press, Massachusetts, USA. [5] Bhattacharya, A. B.; Joardar, S.; Nag, A.; Halder, D.; Debnath, M. (2010): Wind-proof log periodic dipole Array for capturing solar
Radio bursts, International Journal of Engineering Science and Technology, 2(9), pp. 4213-4221.
[6] Bhattacharya, A. B.; Nag A.; Das, T. (2011): Variability of Sunspot Cycle and Hale Cycle in Relation to their Peak Activities over the Century, National Conference on Engineering Education in New Century (E2NC- 2011), Sygnus Publication, pp. 183-185.
[7] Bhattacharya, A. B.; Raha, B.; Tripathi, D. K.; Halder, D. (2011): Identification of Solar Bursts in the Tropics, International Journal of Advances in Science and Technology, 3(2), pp. 57-60.
[8] Cairns, I.H.; Knock, S.A.; Robinson, P.A.; Kuncic Z. (2003): Type II solar radio bursts: Theory and space weather implications, Space Sci. Rev., 107(1-2), pp. 27-34.
[9] Friis-Christensen, E.; Lassen, K. (1991): Length of the Solar Cycle: An Indicator of Solar Activity Closely Associated with Climate, Science, 254(5032), pp. 698-700.
[11] http://www.nasa.gov/topics/solarsystem/features/spotless_sun.html
[12] Javaraiah, J.; Bertelo, L.; Ulrich, R. K. (2005): Long-Term Variations in Solar Differential Rotation and Sunspot Activity, Solar Physics, 232, pp. 25-40.
[13] Monthly sunspot number data: http.//www.sidc.be/sunspot_data
![Fig. 10. Plot of total solar irradiance vs. year [5,6]. Fig. 11. Same plot for the recent years [5, 6]](https://thumb-eu.123doks.com/thumbv2/123dok_br/18340599.351939/5.892.115.780.743.1030/fig-plot-total-solar-irradiance-year-recent-years.webp)