AACL BI OFLUX
Aqu a cu lt u r e , Aqu a r iu m , Con se r va t ion & Le gisla t ion
I n t e r n a t ion a l Jou r n a l of t h e Bioflu x Socie t y
Pe r for m a n ce of a sm a ll- sca le m odu la r a qu a pon ic
sy st e m
1
Mariant hi Sim eonidou,
2I oannis Paschos,
2Evangelia Gouva,
3Mar kos Kolygas, and
4Cost as Perdikaris
1
Depart m ent of Vet erinary Medicine, Universit y of Thessaly and Depart m ent of Aquacult ure & Fisheries, Technological Educat ional I nst it ut e of Epirus, Greece;
2
Depart m ent of Aquacult ure & Fisheries, Technological Educat ional I nst it ut e of Epirus, I goum enit sa, Greece; 3 Depart m ent of Vet erinary Medicine, Univ ersit y of Thessaly , Kardit sa, Greece; 4 Depart m ent of Fisheries, Region of Epirus, I goum enit sa, Greece.
Corresponding aut hor: C. Perdik aris, cperdik 74@yahoo. gr
Abst r a ct. Aquaponic syst em s aim t o exploit t he advant ages of aquacult ur e and hydr oponic syst em s. A r easonable fish pr oduct ion can be sust ained and at t he sam e t im e a wide r ange of gr een plant s and veget ables will be beneffit ed fr om t he n ut r ient - r ich out flow of t he fish t anks, pr oviding nit r ificat ion ser vices t o r educe t he am m onia and nit r it e loads. I n t his paper , t he per for m ance of a sm all- scale m odular aquaponic syst em was assessed for t he crit ical init ial r unning period of 14 days dur ing Sept em ber 2011, using let t uce, basil and Nile t ilapia. I t was evident fr om t he r esult s t hat m id- r ange fish st ocking densit ies and accor dingly nut rient loads ar e able t o suppor t a plant har vest at a r at io of 1: 4 t o 1: 5 ( am ount of fish feed pr ovided: har vest able biom ass) in bot h species, depending on t he init ial size of t he plant s. Ver y sm all plant s wit h sensit ive r oot syst em should be avoided, as well as incr eased am m onia loads. Fur t her im pr ovem ent s could be achieved by fine- t unnin g of t he flow char act er ist ics of t he syst em , t he st andar dizat ion of wat er qualit y pr ofile, t he appr opr iat e select ion of subst r at e and t he addit ion of ext r a biofilt r at ion com par t m ent .
Ke y W or ds: aquaponics, hydr oponics, let t uce, basil, Or eochr om is nilot icus.
I n t r odu ct ion. Aquaponic sy st em s com bine t echnology and ideas from bot h aquacult ure
and hy droponic farm ing sy st em s. By such com binat ion, problem s arising in aquacult ure concerning solid rem ov al and t he requirem ent of st eady av ailabilit y of w at er rich in nut rient s in hy droponic syst em s can be effect iv ely t ackled ( Div er 2006; Nelson 2008) . Fish are grow n in freshw at er t ank s and t he out flow rich in m et abolic product s and uneat en food ( suspended solids, am m onia, nit rit e and nit rat e) are used as organic fert ilizers and nit rogen sources for t he cult iv at ion of v eget ables ( Seaw right et al 1998; Sav idov et al 2007) . By t his process, t he highly t ox ic subst ance t o fish ( i. e. t he am m onia) is conv ert ed by nit rificat ion bact eria in t he hy droponic subst rat e and assim ilat ed by t he plant s ( Tok uy am a et al 2004) . I n ot her w ords, t he hy droponic subst rat e m ay effect iv ely replace t he conv ent ional biofilt er in a closed- recirculat ion sy st em for fish product ion. Accordingly , fish and v eget ables can be produced in a m ut ually- benefit w at er- reuse schem e.
The aim of t he present st udy w as t o assess t he perform ance of a sm all- scale pilot m odular aquaponic sy st em for fish and green v eget ables during t he crit ical early phase of running.
M a t e r ial a n d M e t h od. The sy st em - bat t ery consist ed of t hree m ain fish t ank s each of
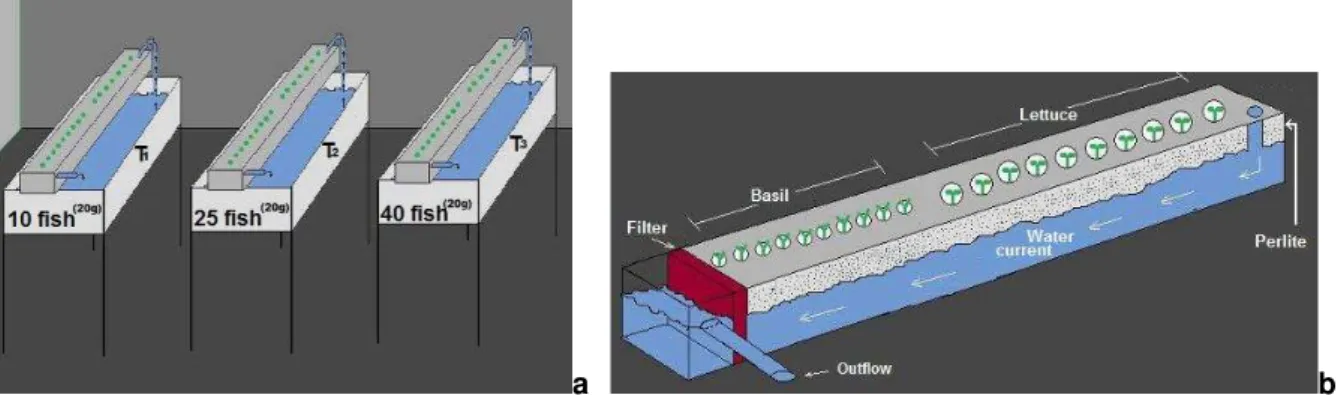
t hem of 200 L. A rect angular channel of 25 L w as m ount ed abov e each t ank , w here t he plant s w ere placed. A sm all elect rical pum p ( 2 L m in- 1) w as im m ersed in each t ank , supplying w at er t o t he channels and t he w at er w as ret urning by gravit y t o t he t ank s ( Figure 1a) . I n t he hy droponic com ponent ( i. e. in t he channels) , w at er w as flowing ov er t heir bot t om at a st eady rat e dict at ed by t he diam et er and t he posit ion of t he out flow hose. Perlit e w as used as cult iv at ion subst rat e and nit rificat ion bact eria subst rat e, float ing abov e t he w at er and green v eget ables were plant ed in holes on t he t op of t he channel ( Figure 1b) .
a
b
Figure 1. ( a) Design of sm all- scale experim ent al aqu aponic syst em ( wat er circulat ion is highlight ed by arrows) and ( b) t he hydropon ic com part m ent .
The ex perim ent al process last ed 14 day s on Sept em ber 2011 for each of t he t hree ex perim ent al groups. I n all of t hem , t en let t uce (Lact uca sat iv a Linnaeus, 1758) and t en basil (Ocim um basilicum Linnaeus, 1758) plant s w ere plant ed in each of t he t hree channels at different m ean w eight s: 0. 12 g and 0. 09 g ( gr oup 1) ; 0. 22 g and 0. 14 g ( group 2) ; 2. 47 g and 2. 1 g ( group 3) . Juv eniles of Nile t ilapia (Oreochrom is nilot icus
( Linnaeus, 1758) ) w ere st ock ed at different densit ies and biom asses ( show n t oget her w it h grow t h perform ance figures in Table 3) . Fish w ere daily fed wit h 1. 5% of body w eight t wice a day in equal m eals.
Am m onia, nit rit es, nit rat es, phosphat es, pH and t ot al hardness w ere m onit ored at a w eekly basis and fish t ank s w ere daily siphoned. I nit ially , only fish w ere st ock ed for a period of one m ont h in order t o balance t he sy st em and st abilise t he nit rificat ion abilit y of t he perlit e ( at lev els below 2 m g L- 1 for am m onia) . When am m onia and nit rit e lev els w ere st abilised, v eget ables w ere plant ed. Wat er w as part ially replaced w hen nit rat es ex ceeded 100 m g L- 1. Tot al m ean w eight gain, food conv ersion rat io ( FCR) and specific grow t h rat e
( SGR) w ere calculat ed for t ilapia and t ot al m ean w eight gain and m ean daily increase of biom ass were calculat ed for t he plant s.
St at ist ical differences bet w een t ank s in each ex perim ent al group w ere ex am ined by T- t est s ( P= 0. 05) . Poly nom ial dist ribut ion w as applied t o describe t he v eget at iv e m ass increases according t o Walk er et al ( 2001) , Broadley et al ( 2003) and Bor ouj erdnia & Ansari ( 2007) . Coefficient of v ariat ion for t he fish w eight w as calculat ed and ANOVA w as applied t o det ect differences in grow t h bet w een different fish t ank s. Single regression w as applied t o describe t he relat ionship bet ween feed and v eget at iv e grow t h. All t est s w ere perform ed by t he St at ist iX pack age and Microsoft Ex cel for Window s.
Re su lt s a n d D iscu ssion. Am m onia in all T3 t anks w as close t o t he 2 m g L- 1 lim it due t o
high fish st ocking densit y. I n t he rest of t he t ank s ( T1 & T2) am m onia nev er ex ceeded 0. 5 m g L- 1. The v alues of nit rit es, nit rat es, phosphat es and pH w ere alw ay s in accept able
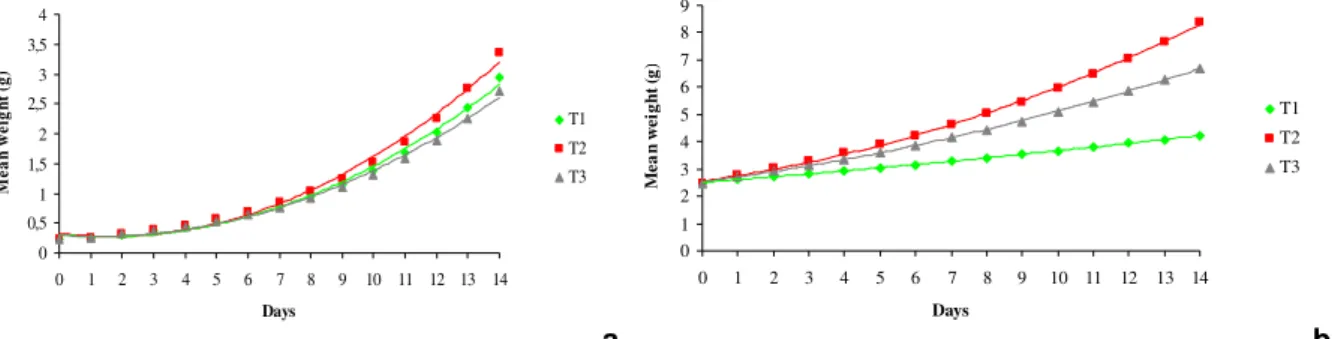
Bot h plant species failed t o grow in t he ex perim ent al group 1. I n t he rest of t he groups, grow t h of let t uce and basil w ere evident in all t ank s; how ev er T2 show ed t he best perform ance in all cases, alt hough no st at ist ical differences w ere det ect ed in all cases ( p > 0. 05) ( Figures 2- 3 and Tables 1- 2) .
The proj ect ed ( t heoret ical) growt h for a 90- day period for each species, ex perim ent al group and t ank w as est im at ed. Grow t h pot ent ial of let t uce for T2 w as higher com pared t o T1 and T3 in bot h ex perim ent al groups ( p < 0. 05) ( Figures 4a, b) . I n basil, t he sam e t rend w as evident only for t he ex perim ent al group 3, alt hough not support ed by st at ist ical t est ing ( p > 0. 05) ( Figures 5a, b) .
0 0,5 1 1,5 2 2,5 3 3,5 4
0 1 2 3 4 5 6 7 8 9 10 11 12 13 14
Days M e a n w e ig h t (g ) T1 T2 T3 a 0 1 2 3 4 5 6 7 8 9
0 1 2 3 4 5 6 7 8 9 10 11 12 13 14
Days M e a n w e ig h t (g ) T1 T2 T3 b
Figure 2. Mean weight of let t uce during t he 14- day cult ure period in each of t he t hree t anks ( a) in t he experim ent al group 2 and ( b) in t he experim ent al group 3.
0 0,5 1 1,5 2 2,5 3 3,5
0 1 2 3 4 5 6 7 8 9 10 11 12 13 14
Days M e a n w e ig h t (g ) T1 T2 T3 a 0 1 2 3 4 5
0 1 2 3 4 5 6 7 8 9 10 11 12 13 14
Days M e a n w e ig h t (g ) T1 T2 T3 b
Figure 3. Mean weight of basil during t he 14- day cu lt ure period in each of t he t hree t anks ( a) in t he experim ent al group 2 and ( b) in t he experim ent al group 3.
Table 1 Grow t h of let t uce in different ex perim ent al groups and t ank s of t he aquaponic sy st em
Ex perim ent al group 1 Ex perim ent al group 2 Ex perim ent al group 3
Tank T1 T2 T3 T1 T2 T3 T1 T2 T3
Num ber of plant s
10 10 10 10 10 10 10 10 10
Mean init ial biom ass ( g)
0. 12 0. 12 0. 12 0. 22 0. 22 0. 22 2. 47 2. 47 2. 47
Mean final biom ass ( g)
- - - 2. 94 3. 36 2. 71 4. 24 3. 36 6. 71
Mean net biom ass ( g)
- - - 2. 71 3. 13 2. 48 1. 77 5. 90 4. 24
Mean daily biom ass grow t h ( g)
- - - 0. 19 0. 22 0. 20 0. 12 0. 42 0. 30
Tot al net biom ass ( g)
Table 2 Grow t h of basil in different ex perim ent al groups and t ank s of t he aquaponic sy st em
Ex perim ent al group 1 Ex perim ent al group 2 Ex perim ent al group 3
Tank T1 T2 T3 T1 T2 T3 T1 T2 T3
Num ber of plant s
10 10 10 10 10 10 10 10 10
Mean init ial biom ass ( g)
0. 09 0. 09 0. 09 0. 14 0. 14 0. 14 2. 1 2. 1 2. 1
Mean final biom ass ( g)
- - - 3. 0 3. 2 2. 9 2. 92 4. 73 2. 68
Mean net biom ass ( g)
- - - 2. 86 3. 06 2. 76 0. 82 2. 63 0. 58
Mean daily biom ass grow t h
( g)
- - - 0. 20 0. 22 0. 20 0. 06 0. 18 0. 04
Tot al net biom ass ( g)
- - - 28. 6 30. 6 27. 6 8. 2 26. 3 5. 8
0 100 200 300 400 500 600 700 800 900
1 6 11 16 21 26 31 36 41 46 51 56 61 66 71 76 81 86
Days W e ig h t (g )
Tank 1 Tank 2 Tank 3
a 0 100 200 300 400 500
1 6 11 16 21 26 31 36 41 46 51 56 61 66 71 76 81 86
Days W e ig h t (g )
Tank 1 Tank 2 Tank 3
b
Figure 4. Proj ect ed m ean weight of let t uce during a t heorit ical 9 0- day cult u re period in each of t he t hree t anks ( a) in t he experim ent al group 2 and ( b) in t he experim ent al group 3.
0 200 400 600 800 1000 1200
1 6 11 16 21 26 31 36 41 46 51 56 61 66 71 76 81 86
Days W ei g h t (g )
Tank 1 Tank 2 Tank 3
a 0 50 100 150 200
1 6 11 16 21 26 31 36 41 46 51 56 61 66 71 76 81 86
Days W e ig h t (g )
Tank 1 Tanks 2 Tank 3
b
Figure 5. Proj ect ed m ean weight of basil dur ing a t heorit ical 90- day cu lt ure period in each of t he t hree t anks ( a) in t he experim ent al group 2 and ( b) in t he experim ent al group 3.
Table 3 Grow t h perform ance of Nile t ilapia in t he aquaponic sy st em
Ex perim ent al group 1 Ex perim ent al group 2 Ex perim ent al group 3
Tank T1 T2 T3 T1 T2 T3 T1 T2 T3
Num ber of fish 10 25 40 10 25 40 10 25 40 I nit ial m ean body
w eight ( g)
23 23 23 26. 8 25. 5 26 32. 2 30. 16 29
St ock ing densit y ( k g m- 3)
1 2. 5 4 1. 34 3. 18 5. 2 1. 6 3. 76 5. 8
Final m ean body w eight ( g)
26. 8 25. 5 26 32. 16 30. 1 29 33. 9 31. 2 32. 4
Tot al init ial biom ass ( g)
230 575 920 268 637. 5 1040 322 754 1160
Tot al final biom ass ( g)
268 637. 5 1040 321. 6 752. 5 1160 339 780 1296
Net biom ass ( g) 38 62. 5 120 53. 6 115 120 17. 4 27. 5 136 FCR 1. 36 2. 07 1. 73 1. 13 1. 25 1. 95 1. 53 1. 51 1. 55 SGR% 1. 02 0. 69 0. 82 1. 22 1. 11 0. 73 0. 92 0. 93 0. 90
Bot h plant species of t he ex perim ent al group 1 failed t o grow aft er t he 10t h day , probably due t o t he sensit ivit y of t he root sy st em in such w eight ( 0. 12 g) t o t he hy draulic charact erist ics of t he sy st em . I n aquaponic sy st em s, t he w at er flow in t he veget able com part m ent is affect ed by t he FCR of t he fish, as w ell as by t he grow t h rat e of t he plant ed m at erial ( Endut et al 2010) . I n our case, plant ing of t he perlit e at t his dev elopm ent al st age seem ed t o be det rim ent al t o t hem . On t he ot her hand, w hen bigger let t uce and basil plant s w ere used ( experim ent al groups 2 & 3) , grow t h w as sat isfact ory .
Grow t h rat e of bot h plant species w as affect ed by t he st ocking densit y of fish ( Tables 1 & 2) , indicat ing a st rong relat ion t o t he fish feed supply t o t he sy st em . Alt hough t here w as no st at ist ical evidence t o support t he abov e st at em ent for t he act ual 14- day ex perim ent al period, t his t rend becom es st at ist ically significant for let t uce w hen proj ect ed t o a 90- day t im e window .
Bot h let t uce and basil grew bet t er in m edium - range fish st ocking densit ies ( T2) in t he 2nd and 3rd ex perim ent al groups. Reduced grow t h rat e of plant s in T1 w as possibly due t o t he lack of t he required nut rient s due t o t he low fish feed input s. On t he ot her hand, reduced grow t h in T3 could be at t ribut ed t o t he increased am m onia lev els. High am m onia v alues are count erproduct ive in t he hy droponic cult iv at ion of green plant s and accordingly in aquaponic sy st em s ( Walk er et al 2001) and only w hen t he ionized form range bet w een 10 and 20% of t he t ot al nit rogen, it benefit s plant grow t h ( Racocy et al 1992) . Moreov er, t he frequent w at er replacem ent s in order t o k eep am m onia at low lev els, reduced nit rat e lev els as w ell w hich is t he predom inant nit rogen source for plant s ( Liedl et al 2004; Rak ocy et al 2006) . Therefore, in high fish st ocking densit ies, biofilt rat ion cannot be serv ed solely by t he perlit e subst rat e and t he addit ion of ex t ra biofilt er seem s t o be essent ial t o conv ert t he ex cess am m onia load and at t he sam e t im e t o k eep t he nit rit e levels at levels of 100- 200 m g L- 1.
I n t he 2nd ex perim ent al group, t ot al v eget at iv e harv est w as 55. 7 g ( 27. 1 g of let t uce and 28. 6 g of basil) for T1, 61. 9 g ( 31. 3 g of let t uce and 30. 6 g of basil) for T2 and 52. 4 g ( 24. 8 g of let t uce and 27. 6 g of basil) for T3. The t ot al fish feed provided w as 60. 3, 143. 25 g and 234 g, respect iv ely. Accordingly , in t he early st age of plant dev elopm ent ( plant s of 0. 2- 3 g) , t he opt im um rat io of fish feed per g of v eget able biom ass w as 1: 4. Rat ios of 1: 10 ( as in T1) and of 1: 3 ( as in T3) result ed in low er harv est s due t o t he lack of nut rient s and t he excess am m onia lev els, respect iv ely .
and only 5. 8 g of basil) . The t ot al fish feed provided w as 72. 36 g, 169. 25 g and 261 g, respect iv ely . Differences in t he early cult iv at ion st age ( 14 day s) w ere not st at ist ically significant , how ev er t hey were pronounced in t he m id- run ( up t o 90 day s) . Accordingly, for bigger plant s ( 3- 8 g) , t he opt im um rat io of fish feed per g of veget able biom ass w as 1: 5.
Con clusion s. The daily v eget at ive grow t h bot h in let t uce and basil is dependent on t he
am ount of feed prov ided t o t he fish t ank s and opt im um harv est ing m ay be up t o 5- fold, com pared t o t he am ount of feed. Sm all- scale aquaponic sy st em s are capable of producing green plant s or/ and v eget ables from fish feaces, ex cret ions and uneat en feed, if w at er qualit y is cont inuously m onit ored and plant sizes are appropriat ely select ed ( 0. 22 g and 0. 14 g f or let t uce and basil, respect iv ely ) . At t he sam e t im e if an appropriat e fish species is select ed, such as t he Nile t ilapia, growt h perform ance of fish is sat isfact ory in t he low - m id range st ocking densit ies ( e.g. 1. 0- 3. 76 k g m- 3) required t o balance t he aquaponic syst em .
Re fe r en ce s
Al- Hafedh Y. S. , Alam A. , Belt agi M. S. , 2008 Food product ion and w at er conserv at ion in a recirculat ing aquaponic sy st em in Saudi Arabia at different rat ios of fish feed t o plant s. J World Aquac Soc 39( 4) : 510- 520. doi: 10. 1111/ j . 1749- 7345. 2008. 00181. x. Borouj erdnia M. , Ansari N. A., 2007 Effect of different lev els of nit rogen fert ilizer and cult iv ars on grow t h, yield and yield com ponent s of Rom aine Let t uce (Lact uca sat iv a
L. ) . Middle East Rus J Plant Sci Biot ech 1( 2) : 47- 53.
Broadley M. R. , Seginer I . , Burns A. , Escobar- Gut ierrez A. J. , Burns I . G. , Whit e P. J., 2003 The nit rogen and nit rat e econom y of but t er head let t uce (Lact uca sat iv a v ar.
capit at a L. ) . J Ex p Bot 54( 390) : 2081- 2090. doi: 101093/ j x b/ erg222.
Div er S., 2006 Aquaponics- I nt egrat ion of Hy droponics wit h Aquacult ure. ATTRA- Nat ional Sust ainable Agricult ure I nform at ion Serv ice, Nat ional Cent er for Appropriat e Technology , Unit ed St at es Depart m ent of Agricult ure’s Rural Business- Cooperat ive Serv ice. < ht t p: / / back y ardaquaponics. com / Travis/ aquaponic. pdf> Dow nloaded on 5 April 2012.
Endut A. , Jusohb A. , Alib N., Nik c W. B. W. , 2011 Nut rient rem ov al from aquacult ure w ast ew at er by v eget able product ion in aquaponics recirculat ion sy st em . Desalin Wat er Treat 32( 1- 3) : 422- 430. doi: 10. 5004/ dw t . 2011. 2761.
Jorgensen B. , Meisel E., Schilling C. , Sw enson D. , Thom as B. , 2009 Dev eloping food product ion sy st em s in populat ion cent ers. Biocy cle 50( 2) : 27- 29.
Kot zen B. , Appelbaum S., 2010 An inv est igat ion of aquaponics using brackish w at er resources in t he Negev desert . J Appl Aquac 22( 4) : 297- 320. doi: 10. 1080/ 10454438. 2010. 527571.
Liedl B. E. , Cum m ins M. , Young A. , William s M. L. , Chat field J. M. , 2004 Hy droponic let t uce product ion using liquid effluent from poult ry w ast e biorem ediat ion as a nut rient source. Act a Hort ( I SHS) 659: 721- 728.
Nelson R. L., 2008 Aquaponics food product ion: Raising fish and plant s for food and profit. Mont ello: Nelson and Pade I nc. 218 pp.
Pade J. S. , Nelson R. L., 2007 Village Aquaponics. Act a Hort ( I SHS) 742: 197- 199.
Rak ocy J. E. , Masser M. P. , Losordo T. M. , 2006 Recirculat ing aquacult ure t ank product ion sy st em s: Aquaponics - I nt egrat ing fish and plant cult ure. Sout hern Regional Aquacult ure Cent er, Publication No. 454: 1- 16. < ht t p: / / w w w . ca. uk y .edu/ w k rec/ 454fs. PDF> . Dow nloaded on 5 April 2012.
Sav idov N. A. , Hut chings E. , Rak ocy J. E. , 2007 Fish and plant product ion in a recirculat ing aquaponic sy st em : a new approach t o sust ainable agricult ure in Canada. Act a Hort ( I SHS) 742: 209- 221.
Seaw right D. E., St ick ney R. R. , Walk er R. B. , 1998 Nut rient dy nam ics in int egrat ed aquacult ure- hy droponics syst em s. Aquacult ure 160( 34) : 215–237.
bact erium , isolat ed from t he reed rhizoplane in an aquaponics plant . J Biosci Bioeng 98( 4) : 309- 312.
Walk er R. L. , Burns I . G. , Moorby J., 2001 Responses of plant grow t h rat e t o nit rogen supply : a com parison of relat iv e addit ion and N int errupt ion t reat m ent s. J Ex p Bot 52( 355) : 309- 317. doi: 10. 1093/ j ex bot / 52. 355. 309.
Received: 26 Apr il 2012. Accept ed: 30 June 2 012. Published online: 10 July 20 12. Aut hor s:
Mar iant hi Sim eonidou, Univer sit y of Thessaly and Techn ological Educat ional I nst it ut e of Epir us, MSc cour se ‘Aquacult ur e’ j oint ly or ganised by t he Depar t m ent of Vet er inary Medicine and t he Depar t m ent of Aquacult ur e & Fisher ies, Gr eece, I goum enit sa, I r inis & Filias 1, 46 100, e- m ail: sim eonidou_m @yah oo. com
I oan nis Paschos, Technological Educat ional I nst it ut e of Epir us, Depar t m ent of Aquacult ur e & Fisher ies, Gr eece, I goum enit sa, I r inis & Filias 1, 461 00, e- m ail: paschosi@ot enet .gr
Evangelia Gouva, Techn ological Educat ional I nst it ut e of Epir us, Depar t m ent of Aquacult ur e & Fisher ies, Gr eece, I goum enit sa, I r inis & Filias 1, 461 00, e- m ail: lit sagouva@yahoo. gr
Mar kos Koly gas, Univer sit y of Thessaly, Depar t m ent of Vet er inar y Medicine, Gr eece, Kar dit sa, Tr ikalon 224, 4310 0, e- m ail: kolygasm ar kos@yahoo. gr
Cost as Per dikar is, Region of Epir us, Depar t m ent of Fisher ies, Gr eece, I goum enit sa, P. Tsaldar i 18, 4610 0, e- m ail: cper dik74@yahoo. gr
How t o cit e t his ar t icle: