Prevalence of Prostate Cancer Clinical States
and Mortality in the United States: Estimates
Using a Dynamic Progression Model
Howard I. Scher1*, Kirk Solo2, Jason Valant2, Mary B. Todd3, Maneesha Mehra3
1Genitourinary Oncology Service, Department of Medicine, Sidney Kimmel Center for Prostate and Urologic Cancers, Memorial Sloan Kettering Cancer Center, and Department of Medicine, Weill Cornell Medical College, New York, New York, United States of America,2Lexidyne, Colorado Springs, Colorado, United States of America,3Janssen Global Services, South Raritan, New Jersey, United States of America
Abstract
Objective
To identify patient populations most in need of treatment across the prostate cancer disease continuum, we developed a novel dynamic transition model based on risk of disease pro-gression and mortality.
Design and Outcome Measurements
We modeled the flow of patient populations through eight prostate cancer clinical states (PCCS) that are characterized by the status of the primary tumor, presence of metastases, prior and current treatment, and testosterone levels. Simulations used published US inci-dence rates for each year from 1990. Progression and mortality rates were derived from published clinical trials, meta-analyses, and observational studies. Model outputs included the incidence, prevalence, and mortality for each PCCS. The impact of novel treatments was modeled in three distinct scenarios: metastatic castration-resistant prostate cancer (mCRPC), non-metastatic CRPC (nmCRPC), or both.
Results and Limitations
The model estimated the prevalence of prostate cancer as 2,219,280 in the US in 2009 and 3,072,480 in 2020, and incidence of mCRPC as 36,100 and 42,970, respectively. All-cause mortality in prostate cancer was estimated at 168,290 in 2009 and 219,360 in 2020, with 20.5% and 19.5% of these deaths, respectively, occurring in men with mCRPC. The major-ity (86%) of incidence flow into mCRPC states was from the nmCRPC clinical state. In the scenario with novel interventions for nmCRPC states, the progression to mCRPC is reduced, thus decreasing mCRPC incidence by 12% in 2020, with a sustained decline in mCRPC mortality. A limitation of the model is that it does not estimate prostate cancer— specific mortality.
OPEN ACCESS
Citation:Scher HI, Solo K, Valant J, Todd MB, Mehra M (2015) Prevalence of Prostate Cancer Clinical States and Mortality in the United States: Estimates Using a Dynamic Progression Model. PLoS ONE 10(10): e0139440. doi:10.1371/journal.pone.0139440
Editor:Stephanie Filleur, Texas Tech University Health Sciences Center, UNITED STATES
Received:January 19, 2015
Accepted:September 14, 2015
Published:October 13, 2015
Copyright:© 2015 Scher et al. This is an open access article distributed under the terms of the Creative Commons Attribution License, which permits unrestricted use, distribution, and reproduction in any medium, provided the original author and source are credited.
Data Availability Statement:All relevant data are within the paper and its Supporting Information files.
Conclusion
The model informs clinical trial design for prostate cancer by quantifying outcomes in PCCS, and demonstrates the impact of an effective therapy applied in an earlier clinical state of nmCRPC on the incidence of mCRPC morbidity and subsequent mortality.
Introduction
Prostate cancer is a significant cause of morbidity and mortality in the United States. With an estimated incidence of 233,000 new cases and 29,480 deaths in 2014, it is the most frequently diagnosed cancer and second most frequent cause of cancer deaths in US males [1]. Prostate-spe-cific antigen (PSA)-based detection strategies are now widely used in the United States, with the result that most men are diagnosed with the disease clinically confined to the gland [2]. This has also led to earlier intervention and, in parallel, declining mortality, although the overall impact of early detection is controversial [3]. Additionally, for many men diagnosed with prostate cancer, the risk of cancer-related symptoms, metastases, and death from disease is low. A challenge in setting expectations for clinical outcome and reliably assessing prognosis is that prostate cancer is a dynamic disease that changes over time as a function of the intrinsic properties of the tumor, patient factors, and the specific therapies to which the tumor has been exposed.
Understanding the prognosis for patient populations at different points in the prostate cancer disease continuum is essential to guide management and improve patient outcomes, an issue not addressed by traditional staging systems or nomograms. In 2000, we proposed a dynamic progression model that partitioned both the untreated natural history and post-treatment history of the prostate cancer disease continuum from diagnosis to death into dis-tinct clinical states [4]. Each state represents a clinically significant milestone and key deci-sion point that is easily recognized by patients, physicians, and researchers. The dynamic progression of patients through these clinical states across the disease continuum has been described [4–6]. Here we present a dynamic model that quantifies the number of patients diagnosed with prostate cancer in each clinical state using published data on cumulative dis-ease incidence, progression, and mortality. The objective was to develop a disdis-ease progression model to identify patient populations most at risk of disease progression and/or mortality and to thus focus clinical research. Used to explore different clinical scenarios, the model can help clarify the impact of novel therapeutics/diagnostics on future prostate cancer disease outlook. In three distinct hypothetical scenarios, we illustrate the impact of introducing novel life-prolonging therapy for non-metastatic and metastatic disease states. We demonstrate that developing interventions for non-metastatic castration-resistant prostate cancer (nmCRPC) should be a priority for clinical research.
Methods
Prostate Cancer Clinical States and Data Sources
The eight prostate cancer clinical disease states were updated from the original published description [4] and aligned with treatment algorithms of current clinical practice guidelines based on therapeutic advances [2]. The clinical state definitions are based on the status of the pri-mary tumor, presence or absence of detectable metastases, prior and current treatment (includ-ing cytotoxic therapy), and serum testosterone levels (non-castrate/castrate). Individual trials were assigned to a specific state based on the study eligibility criteria. For systemic therapies, only Competing Interests:MT and MM are employees of
those that had received regulatory approval by 2009 (the final year of model inputs) were included. A detailed definition of each prostate cancer clinical state is provided inTable 1.
Results of selected phase III trials, meta-analyses, and observational studies designed to establish new standards of care for the respective state were also considered (Table 2). The data sources listed inTable 2focused on large, contemporary, pivotal studies that met level I evi-dence criteria and impacted current clinical practice in the United States; several of the data sources were cited in the 2015 National Comprehensive Cancer Network guidelines [2]. For early-stage disease, a recent large meta-analysis of pivotal trials in early-stage disease was used [9]. Since Kaplan-Meier curves of overall survival (OS) and progression-free survival (PFS) were required as data inputs for the model, publications that did not contain this information were not considered. Each identified publication was subsequently reviewed in depth and the final selection was determined by how closely the respective patient population matched the defined clinical state. A summary of each publication is provided (Table A inS1 File).
Model Summary
The prostate cancer clinical states progression model simulated patient flow through the eight distinct prostate cancer clinical states over time using a novel dynamic modeling framework. These models were custom programmed in the Java programming language (Java SE 6; Oracle Corporation, Redwood City, CA, USA). Additional details on the modeling methodology and the underlying mathematical approach is presented inS1 File.
The base-case model simulated the annual progression of prostate cancer patients through the eight clinical states from diagnosis to death over a 19-year period from 1990 to 2009
(Table 3). The simulation started in 1990 with the diagnosed incidence of prostate cancer
patients by stage (localized, locally advanced, and non-castrate metastatic disease); the annual incidence for each subsequent year by stage was then added. In addition, a forward-looking model was developed that used the Surveillance, Epidemiology and End Results Program (SEER) age-specific prostate cancer incidence rate data from 2008 to estimate prostate cancer incidence for each year from 2009 to 2020 (Table 3). To validate the model, the final results were compared with published estimates of prostate cancer incidence and prevalence in the United States for 2009 and 2020 [7,24].
The utility of the model as a scenario tool was tested in three hypothetical independent sce-narios that evaluated the potential impact of a new treatment in the early nmCRPC and/or mCRPC states. In the early nmCRPC scenario, the novel therapy for nmCRPC has the same OS relative to other nmCRPC therapies, but a 25% improvement in PFS. In the mCRPC sce-nario, the novel therapy for mCRPC has the same PFS as other mCRPC therapies, but a 25% improvement in OS. In the third scenario (combined), novel therapies were introduced in both nmCRPC and mCRPC states, with the aforementioned assumptions.
Results
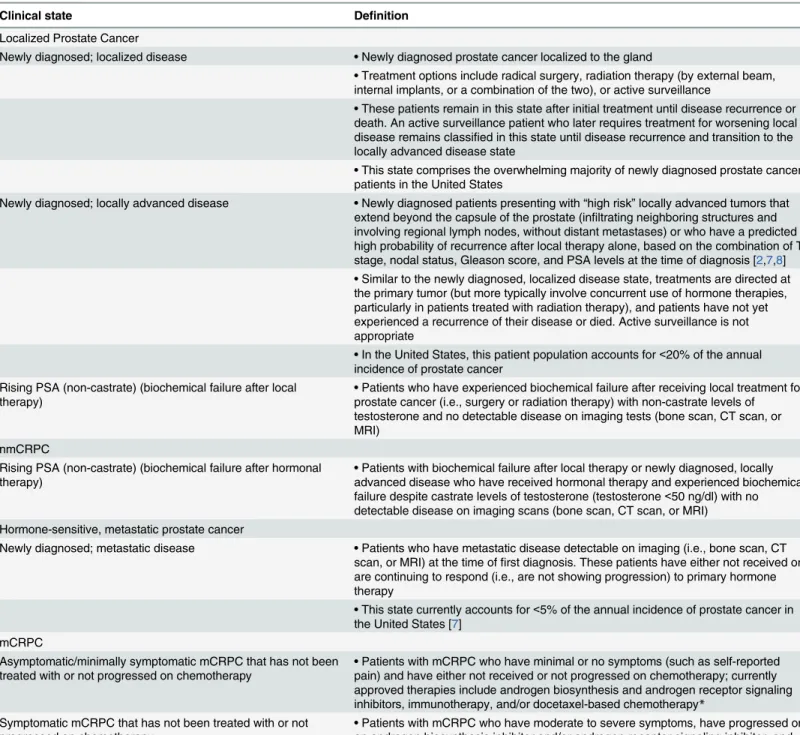
Table 1. Definitions of prostate cancer clinical states comprising the dynamic transition model.
Clinical state Definition
Localized Prostate Cancer
Newly diagnosed; localized disease •Newly diagnosed prostate cancer localized to the gland
•Treatment options include radical surgery, radiation therapy (by external beam, internal implants, or a combination of the two), or active surveillance
•These patients remain in this state after initial treatment until disease recurrence or death. An active surveillance patient who later requires treatment for worsening local disease remains classified in this state until disease recurrence and transition to the locally advanced disease state
•This state comprises the overwhelming majority of newly diagnosed prostate cancer patients in the United States
Newly diagnosed; locally advanced disease •Newly diagnosed patients presenting with“high risk”locally advanced tumors that extend beyond the capsule of the prostate (infiltrating neighboring structures and involving regional lymph nodes, without distant metastases) or who have a predicted high probability of recurrence after local therapy alone, based on the combination of T stage, nodal status, Gleason score, and PSA levels at the time of diagnosis [2,7,8]
•Similar to the newly diagnosed, localized disease state, treatments are directed at the primary tumor (but more typically involve concurrent use of hormone therapies, particularly in patients treated with radiation therapy), and patients have not yet experienced a recurrence of their disease or died. Active surveillance is not appropriate
•In the United States, this patient population accounts for<20% of the annual incidence of prostate cancer
Rising PSA (non-castrate) (biochemical failure after local
therapy) •
Patients who have experienced biochemical failure after receiving local treatment for prostate cancer (i.e., surgery or radiation therapy) with non-castrate levels of testosterone and no detectable disease on imaging tests (bone scan, CT scan, or MRI)
nmCRPC
Rising PSA (non-castrate) (biochemical failure after hormonal therapy)
•Patients with biochemical failure after local therapy or newly diagnosed, locally advanced disease who have received hormonal therapy and experienced biochemical failure despite castrate levels of testosterone (testosterone<50 ng/dl) with no detectable disease on imaging scans (bone scan, CT scan, or MRI) Hormone-sensitive, metastatic prostate cancer
Newly diagnosed; metastatic disease •Patients who have metastatic disease detectable on imaging (i.e., bone scan, CT scan, or MRI) at the time offirst diagnosis. These patients have either not received or are continuing to respond (i.e., are not showing progression) to primary hormone therapy
•This state currently accounts for<5% of the annual incidence of prostate cancer in the United States [7]
mCRPC
Asymptomatic/minimally symptomatic mCRPC that has not been treated with or not progressed on chemotherapy •
Patients with mCRPC who have minimal or no symptoms (such as self-reported pain) and have either not received or not progressed on chemotherapy; currently approved therapies include androgen biosynthesis and androgen receptor signaling inhibitors, immunotherapy, and/or docetaxel-based chemotherapy*
Symptomatic mCRPC that has not been treated with or not progressed on chemotherapy
•Patients with mCRPC who have moderate to severe symptoms, have progressed on an androgen biosynthesis inhibitor and/or androgen receptor signaling inhibitor, and have either not received or not failed a chemotherapy treatment
mCRPC that progressed on/afterfirst-line chemotherapy •Patients with metastatic disease who have failed at least one chemotherapy regimen
*Based on publications of trials focused on patients with or without symptoms.
PSA, prostate-specific antigen; CT, computed tomography; MRI, magnetic resonance imaging; nmCRPC, non-metastatic castration-resistant prostate cancer; mCRPC, metastatic castration-resistant prostate cancer.
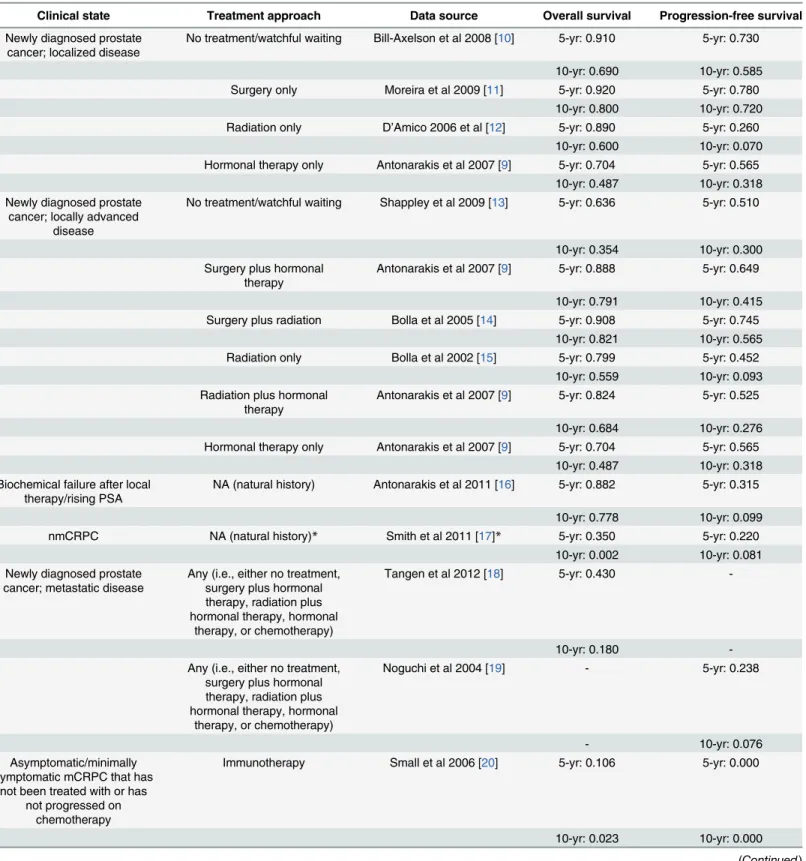
Table 2. Data sources used to determine the hazard rates for progression-free survival and overall survival associated with each clinical state, and the survival estimates derived from these publications for inclusion into the model.
Clinical state Treatment approach Data source Overall survival Progression-free survival
Newly diagnosed prostate cancer; localized disease
No treatment/watchful waiting Bill-Axelson et al 2008 [10] 5-yr: 0.910 5-yr: 0.730
10-yr: 0.690 10-yr: 0.585 Surgery only Moreira et al 2009 [11] 5-yr: 0.920 5-yr: 0.780
10-yr: 0.800 10-yr: 0.720 Radiation only D’Amico 2006 et al [12] 5-yr: 0.890 5-yr: 0.260
10-yr: 0.600 10-yr: 0.070 Hormonal therapy only Antonarakis et al 2007 [9] 5-yr: 0.704 5-yr: 0.565
10-yr: 0.487 10-yr: 0.318 Newly diagnosed prostate
cancer; locally advanced disease
No treatment/watchful waiting Shappley et al 2009 [13] 5-yr: 0.636 5-yr: 0.510
10-yr: 0.354 10-yr: 0.300 Surgery plus hormonal
therapy
Antonarakis et al 2007 [9] 5-yr: 0.888 5-yr: 0.649
10-yr: 0.791 10-yr: 0.415 Surgery plus radiation Bolla et al 2005 [14] 5-yr: 0.908 5-yr: 0.745
10-yr: 0.821 10-yr: 0.565 Radiation only Bolla et al 2002 [15] 5-yr: 0.799 5-yr: 0.452
10-yr: 0.559 10-yr: 0.093 Radiation plus hormonal
therapy
Antonarakis et al 2007 [9] 5-yr: 0.824 5-yr: 0.525
10-yr: 0.684 10-yr: 0.276 Hormonal therapy only Antonarakis et al 2007 [9] 5-yr: 0.704 5-yr: 0.565
10-yr: 0.487 10-yr: 0.318 Biochemical failure after local
therapy/rising PSA
NA (natural history) Antonarakis et al 2011 [16] 5-yr: 0.882 5-yr: 0.315
10-yr: 0.778 10-yr: 0.099
nmCRPC NA (natural history)* Smith et al 2011 [17]* 5-yr: 0.350 5-yr: 0.220
10-yr: 0.002 10-yr: 0.081 Newly diagnosed prostate
cancer; metastatic disease
Any (i.e., either no treatment, surgery plus hormonal therapy, radiation plus hormonal therapy, hormonal
therapy, or chemotherapy)
Tangen et al 2012 [18] 5-yr: 0.430
-10-yr: 0.180
-Any (i.e., either no treatment, surgery plus hormonal therapy, radiation plus hormonal therapy, hormonal
therapy, or chemotherapy)
Noguchi et al 2004 [19] - 5-yr: 0.238
- 10-yr: 0.076
Asymptomatic/minimally symptomatic mCRPC that has
not been treated with or has not progressed on
chemotherapy
Immunotherapy Small et al 2006 [20] 5-yr: 0.106 5-yr: 0.000
10-yr: 0.023 10-yr: 0.000
nmCRPC clinical state contributed heavily to the mCRPC states (86%), while the incidence flow from the non-castrate state to mCRPC was<15%. All-cause mortality in 2009 in the base-case model was estimated at 168,290 deaths, with 34,525 or 20.5% of these deaths in patients in mCRPC states.
The model estimates for the year 2020 are based on existing/current (2009) disease inci-dence, diagnosis, and treatment patterns, and reflect demographic changes in the US popula-tion over time (e.g., the impact of the baby boomer populapopula-tion) (Table 3). Corresponding estimates for each year between 2009 and 2020 are shown in Table B inS1 File. Notably, the total prevalence of patients with prostate cancer is estimated to increase to 3,072,480. In 2020, the model estimated mCRPC incidence at 42,970 cases. Similar to the base-case model, the majority of the mCRPC incidence was derived from the nmCRPC state (86%, or 36,870 cases), with<15% from the non-castrate state. All-cause mortality in 2020 in the base-case model was estimated at 219,360 deaths, with 19.5% (or 42,680) of deaths occurring in the mCRPC states. Table 2. (Continued)
Clinical state Treatment approach Data source Overall survival Progression-free survival
Symptomatic mCRPC that has not been treated with or has
not progressed on chemotherapy
Chemotherapy Petrylak et al 2004 [21] 5-yr: 0.054 5-yr: 0.000
10-yr: 0.003 10-yr: 0.000 mCRPC that progressed on/
afterfirst-line chemotherapy
NA (natural history) de Bono et al 2011 [22] 5-yr: 0.016 5-yr: 0.000
10-yr: 0.000 10-yr: 0.000
*The distribution of patientsflowing from nmCRPC to mCRPC that has not been treated with or not progressed on chemotherapy was determined based on Oudard et al 2009 [23].
PSA, prostate-specific antigen; nmCRPC, non-metastatic castration-resistant prostate cancer; mCRPC, metastatic castration-resistant prostate cancer; NA, not applicable.
doi:10.1371/journal.pone.0139440.t002
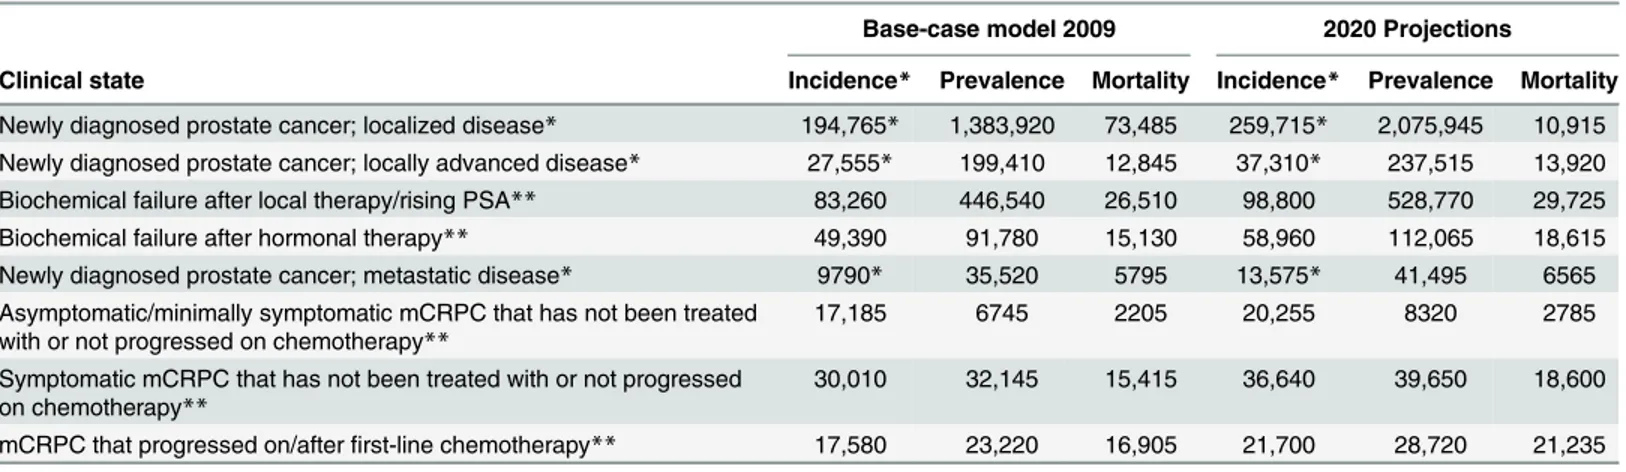
Table 3. Annual progression and mortality rates for the base-case model in 2009 and 2020 projections.
Base-case model 2009 2020 Projections
Clinical state Incidence* Prevalence Mortality Incidence* Prevalence Mortality
Newly diagnosed prostate cancer; localized disease* 194,765* 1,383,920 73,485 259,715* 2,075,945 10,915 Newly diagnosed prostate cancer; locally advanced disease* 27,555* 199,410 12,845 37,310* 237,515 13,920 Biochemical failure after local therapy/rising PSA** 83,260 446,540 26,510 98,800 528,770 29,725 Biochemical failure after hormonal therapy** 49,390 91,780 15,130 58,960 112,065 18,615 Newly diagnosed prostate cancer; metastatic disease* 9790* 35,520 5795 13,575* 41,495 6565 Asymptomatic/minimally symptomatic mCRPC that has not been treated
with or not progressed on chemotherapy**
17,185 6745 2205 20,255 8320 2785
Symptomatic mCRPC that has not been treated with or not progressed on chemotherapy**
30,010 32,145 15,415 36,640 39,650 18,600
mCRPC that progressed on/afterfirst-line chemotherapy** 17,580 23,220 16,905 21,700 28,720 21,235
*Incidence occurs with diagnosis of prostate cancer.
**Incidence is derived from progression from earlier clinical states as shown inFig 2. PSA, prostate-specific antigen; mCRPC, metastatic castration-resistant prostate cancer.
To illustrate the practical applicability of the model, we estimated the impact of novel treat-ments in three scenarios: improved PFS in early nmCRPC, improved OS in mCRPC, and a combined scenario with improvements in PFS and OS for nmCRPC and mCRPC, respectively. In the nmCRPC scenario, a novel therapeutic agent associated with improved PFS introduced in 2015 results in lowering mCRPC incidence by 11.7% (5061 patients less) in 2020 (Table 4) compared with the 2020 baseline mCRPC incidence of 43,211. This reduction in mCRPC Fig 1. Structure and results of the dynamic progression model depicting patient flow between the distinct prostate cancer clinical states in the base-case model from 1990 to 2009.The model highlights movement to clinical states that have higher mortality rates. Improvement in progression-free survival of men in the nmCRPC scenario reduces the number of patients transitioning from nmCRPC into the mCRPC population, where mortality risk is highest and, as such, has a more permanent impact on mCRPC mortality.*Weighted averages of patents diagnosed with localized, locally advanced, and metastatic disease.**Localized disease or locally advanced disease. nmCRPC, non-metastatic castration-resistant prostate cancer; mCRPC, metastatic castration-resistant prostate cancer.
doi:10.1371/journal.pone.0139440.g001
Table 4. Outcomes in hypothetical scenarios: novel therapy introduced in 2015 for early nmCRPC, mCRPC, or combined scenarios.
2017 2020
Baseline mCRPC scenario
nmCRPC scenario
Combined scenario
Baseline mCRPC scenario
nmCRPC scenario
Combined scenario
mCRPC incidence
41,721 NA 37,131 37,708 43,211 NA 38,150 39,327
mCRPC prevalence
72,677 75,132 68,837 72,115 76,431 89,879 67,796 80,894
mCRPC mortality
39,870 36,657 38,156 34,926 41,833 39,801 38,139 35,370
nmCRPC 107,124 NA 109,540 110,954 112,410 NA 126,332 126,744
mCRPC, metastatic castration-resistant prostate cancer; nmCRPC, non-metastatic castration-resistant prostate cancer; NA, not applicable.
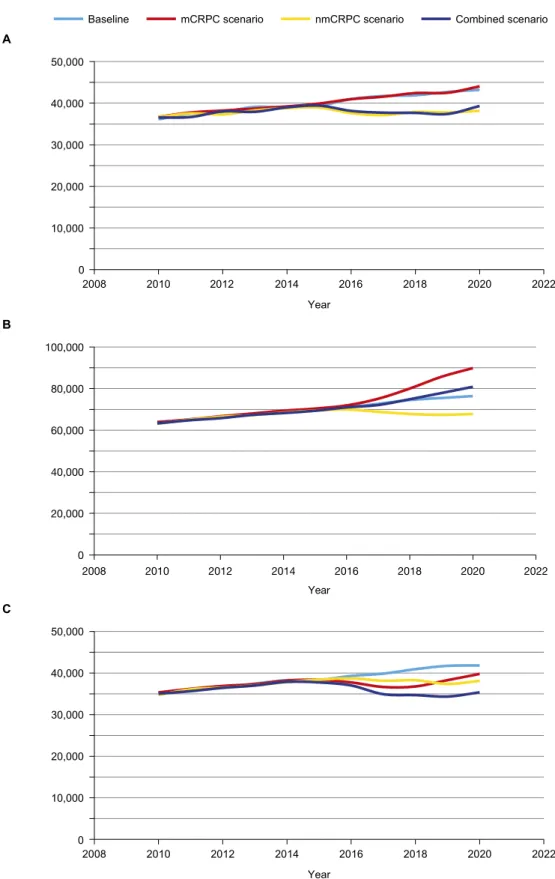
incidence leads to a lower mCRPC prevalence and, hence, a sustained decline in mCRPC mor-tality (Fig 2). With improved PFS, prevalence of nmCRPC will be greater by 12% (13,922 more patients) relative to the 2020 baseline prevalence (Table 4) of 112,410 patients. In the mCRPC scenario, a novel therapeutic introduced in 2015 associated with improved OS reduces mCRPC mortality, with 2032 fewer deaths in 2020 and a simultaneous increase in mCRPC prevalence of 13,448 patients (Table 4). With the increase in mCRPC prevalence over time (due to the reduction in annual mortality outflow rate from 54% to 44% from the mCRPC clinical state), the volume/number of deaths after an initial decline will subsequently increase (Fig 2C). Finally, the combined scenario (simultaneous introduction of novel therapy in clinical state nmCRPC and mCRPC) results in a reduction of more than 6000 deaths from mCRPC in 2020.
Discussion
This dynamic clinical states transition model for the United States estimated the point preva-lence of prostate cancer as 2.2 million in 2009, which will increase to 3.07 million in 2020. These prevalence totals are the cumulative result of the inflow of newly diagnosed patients and outflow of patients who succumb from 1990 onward. A change in the input variables for the purpose of calibration was avoided in order to maintain a purely data-driven model. To ensure the accuracy of the cumulative flow approach, the results were compared and validated against reported epidemiological prevalence and mortality data. The SEER reported complete preva-lence (>35 years’duration) for prostate cancer of 2.3 million in 2009 (vs. 2.2 million simulated) and the National Institutes of Health projected 3.11 million (vs. 3.07 million simulated) in 2020 in the trend incidence scenario [24]. The prevalence for 2009 was lower than that reported by SEER, in part because it did not account for prostate cancer incident cases diag-nosed prior to 1990 [7]. The all-cause mortality of 168,290 deaths in 2009, with 34,525 deaths in the mCRPC population, projected by the model approximates the annual prostate cancer mortality of 30,000 reported by the American Cancer Society [25].
Coupling (or using) the estimate of the number of patients at different points in the disease continuum along with what is known about the frequency of prostate cancer—specific morbid-ities that occur in a given state enables (i) a more global estimate of the morbidity and adverse impact of the disease, and (ii) the quantification of outcomes (mortality and progression) with the introduction of novel therapies for specific clinical states across the disease continuum. The information provides valuable insights into unmet needs short of an improvement in survival being the focus of future or new drug development efforts in a rapidly changing therapeutic landscape. The mCRPC state in which effective treatments were introduced with a targeted mortality reduction threshold of 25% in registration trials revealed a reduced mortality risk and substantially reduced mCRPC mortality, with ~2000 fewer deaths projected in 2020
(Table 4). The decline in mCRPC mortality was temporary until the model reached
equilib-rium, which occurred quickly given the survival benefit of only 4 months.
Fig 2. Impact of hypothetical novel treatment in 2015 for early-stage nmCRPC, mCRPC, and combined scenario. (A) mCRPC incidence, (B) mCRPC prevalence, and (C) mCRPC mortality.The reduction in mCRPC incidence would lead to lower mCRPC prevalence and a sustained decline in mCRPC mortality. nmCRPC, non-metastatic castration-resistant prostate cancer; mCRPC, metastatic castration-resistant prostate cancer.
ongoing (Clinical Trials.gov:NCT01946204,NCT02003924,NCT01046916,NCT01703065,
NCT01875250) and, once they are completed, their impact on disease mortality could be
esti-mated using this dynamic model.
As expected, the model also shows that all-cause mortality rates in prostate cancer patients increase with disease progression as defined by the clinical state. Patients with mCRPC in par-ticular have a high risk of mortality and progression. While prostate cancer—specific mortality is not specified in this model and this is a limitation, the increase in mortality rate reported in the 2009 base model can be attributed to the increasing proportion of deaths due to or attrib-uted to prostate cancer given the following reasoning: Based on US Census data, the all-cause mortality rate among males aged 65 and older was 5.67% in 2010 [26]. The average age of patients who are diagnosed with prostate cancer is 67 years [7] and, based on our 2009 model, the all-cause mortality rate among patients with prostate cancer is 7.6%. In the early stages of disease, the mortality rate of 5.7% is similar to the all-cause mortality rate in the US population aged 65 and older, indicating that only a small proportion (if any) of deaths in these clinical states is due to prostate cancer while the mortality rate of 55.3% for mCRPC is much higher (Figure B inS1 File). Applying the ratio of US all-cause mortality rate to the mCRPC mortality rate suggests that 90% (or ~31,000) of the 34,525 deaths in mCRPC patients can be attributed to prostate cancer, thus aligning with published estimates of annual prostate cancer—specific mortality in the United States. With regard to new prostate cancer therapies, OS will ultimately encompass both all-cause mortality rates and prostate cancer—specific mortality rates (with a delta between the two survival rates). In the model, the relationship between an improvement in PFS vs. OS is quantified and demonstrates the benefits and limitations of these two measures in the nmCRPC and mCRPC scenarios. Improvement in PFS of men in the nmCRPC scenario reduces the number of patients transitioning from nmCRPC into the mCRPC population, where mortality risk is highest. Thus, the ability to reduce patient transitions to a clinical state with higher mortality is based on the ability of new therapies to extend the duration of survival without disease progression (i.e., PFS). Improvements in PFS and OS in the mCRPC scenario essentially delay the inevitable, as following the initial reduction in mortality the levels rebound close to the base case. Thus, the nmCRPC scenario supports the use of PFS as an end point for trials in patient populations whose all-cause mortality outweighs prostate cancer—specific mortality, yet who have a higher risk of progression. These observations are consistent with the Prostate Cancer Clinical Trials Working Group recommendations [27].
The existing model framework can be adapted to quantify changes in disease mortality and morbidity as a result of novel treatments or interventions, such as screening and diagnostics or for specific countries and different timeframes. In Europe, for example, a much higher propor-tion of patients present with metastatic disease at the time of diagnosis and the time of progres-sion from the non-castrate state to mCRPC is generally much shorter [28]. Since this transition model quantifies the progression from early to more advanced disease states, it could help assess the overall impact of changes in routine PSA screening in Europe and the United States.
Conclusion
These results also provide a framework to validate and qualify PFS as an end point that can lead to regulatory approvals and accelerate drug development.
Supporting Information
S1 File. Additional details on modeling methodology.Summary of publications used as data sources for the clinical states model (Table A). Prevalence of clinical states, incidence flow, and patient flows between the clinical states for each year from 2010 to 2020 (Table B). Incidence of prostate cancer in the United States between 1990 and 2009. Grouped by clinical state at the time of diagnosis according to the Surveillance Epidemiology and End Results database (Figure A). Annual all-cause mortality by clinical state, base-case model in 2009 (Figure B). (DOCX)
Acknowledgments
Writing support was provided by Dominik Wolf, Hajira Koeller, and Ann Tighe of PAREXEL.
Author Contributions
Conceived and designed the experiments: HS, KS, JV, MT, MM. Performed the experiments: HS, KS, JV, MM. Analyzed the data: HS, KS, JV, MT, MM. Contributed reagents/materials/ analysis tools: HS, KS, JV, MM. Wrote the paper: HS, KS, JV, MT, MM.
References
1. American Cancer Society. Cancer Facts & Figures 2014. Atlanta: American Cancer Society; 2014.
2. Mohler JL, Armstrong AJ, Bahnson RR, Boston B, Busby JE, D'Amico AV, et al. NCCN clinical guide-lines in oncology—prostate cancer. Version I.2015. National Comprehensive Cancer Network Web site. Available:http://www.nccn.org/professionals/physician_gls/pdf/prostate.pdf.
3. Etzioni R, Tsodikov A, Mariotto A, Szabo A, Falcon S, Wegelin J, et al. Quantifying the role of PSA screening in the US prostate cancer mortality decline. Cancer Causes Control. 2008; 19(2): 175–81. PMID:18027095
4. Scher HI, Heller G. Clinical states in prostate cancer: toward a dynamic model of disease progression. Urology. 2000; 55(3): 323–7. PMID:10699601
5. Solo K, Mehra M, Dhawan R, Valant J, Scher HI. Prevalence of prostate cancer (PC) clinical states (CS) in the United States: estimates using a dynamic progression model. J Clin Oncol. 2011; 29 (Suppl). Abstract 4637.
6. Scher HI, Morris MJ, Basch E, Heller G. End points and outcomes in castration-resistant prostate can-cer: from clinical trials to clinical practice. J Clin Oncol. 2011; 29(27): 3695–704. doi:10.1200/JCO. 2011.35.8648PMID:21859988
7. U.S. National Institutes of Health. Surveillance Epidemiology and End Results. National Cancer Insti-tute website. Available:http://seer.cancer.gov/.
8. Yossepowitch O, Eggener SE, Bianco FJ Jr, Carver BS, Serio A, Scardino PT, et al. Radical prostatec-tomy for clinically localized, high risk prostate cancer: critical analysis of risk assessment methods. J Urol. 2007; 178(2): 493–9. PMID:17561152
9. Antonarakis ES, Blackford AL, Garrett-Mayer E, Eisenberger MA. Survival in men with nonmetastatic prostate cancer treated with hormone therapy: a quantitative systematic review. J Clin Oncol. 2007; 25 (31): 4998–5008. PMID:17971600
10. Bill-Axelson A, Holmberg L, Filen F, Ruutu M, Garmo H, Busch C, et al. Radical prostatectomy versus watchful waiting in localized prostate cancer: the Scandinavian prostate cancer group-4 randomized trial. J Natl Cancer Inst. 2008; 100(16): 1144–54. doi:10.1093/jnci/djn255PMID:18695132
12. D'Amico AV, Hui-Chen M, Renshaw AA, Sussman B, Roehl KA, Catalona WJ. Identifying men diag-nosed with clinically localized prostate cancer who are at high risk for death from prostate cancer. J Urol. 2006; 176(6 Pt 2): S11–5. PMID:17084157
13. Shappley WV III, Kenfield SA, Kasperzyk JL, Qiu W, Stampfer MJ, Sanda MG, et al. Prospective study of determinants and outcomes of deferred treatment or watchful waiting among men with prostate can-cer in a nationwide cohort. J Clin Oncol. 2009; 27(30): 4980–5. doi:10.1200/JCO.2008.21.2613PMID: 19720918
14. Bolla M, van PH, Collette L, van CP, Vekemans K, Da PL, et al. Postoperative radiotherapy after radical prostatectomy: a randomised controlled trial (EORTC trial 22911). Lancet. 2005; 366(9485): 572–8. PMID:16099293
15. Bolla M, Collette L, Blank L, Warde P, Dubois JB, Mirimanoff RO, et al. Long-term results with immedi-ate androgen suppression and external irradiation in patients with locally advanced prostimmedi-ate cancer (an EORTC study): a phase III randomised trial. Lancet. 2002; 360(9327): 103–6. PMID:12126818
16. Antonarakis ES, Chen Y, Elsamanoudi SI, Brassell SA, Da Rocha MV, Eisenberger MA, et al. Long-term overall survival and metastasis-free survival for men with prostate-specific antigen-recurrent pros-tate cancer after prospros-tatectomy: analysis of the Center for Prospros-tate Disease Research National Data-base. BJU Int. 2011; 108(3): 378–85. doi:10.1111/j.1464-410X.2010.09878.xPMID:21091976
17. Smith MR, Cook R, Lee KA, Nelson JB. Disease and host characteristics as predictors of time to first bone metastasis and death in men with progressive castration-resistant nonmetastatic prostate cancer. Cancer. 2011; 117(10): 2077–85. doi:10.1002/cncr.25762PMID:21523719
18. Tangen CM, Hussain MH, Higano CS, Eisenberger MA, Small EJ, Wilding G, et al. Improved overall survival trends of men with newly diagnosed M1 prostate cancer: a SWOG phase III trial experience (S8494, S8894 and S9346). J Urol. 2012; 188(4): 1164–9. doi:10.1016/j.juro.2012.06.046PMID: 22921015
19. Noguchi M, Noda S, Yoshida M, Ueda S, Shiraishi T, Itoh K. Chemohormonal therapy as primary treat-ment for metastatic prostate cancer: a randomized study of estramustine phosphate plus luteinizing hormone-releasing hormone agonist versus flutamide plus luteinizing hormone-releasing hormone agonist. Int J Urol. 2004; 11(2): 103–9. PMID:14706014
20. Small EJ, Schellhammer PF, Higano CS, Redfern CH, Nemunaitis JJ, Valone FH, et al. Placebo-con-trolled phase III trial of immunologic therapy with sipuleucel-T (APC8015) in patients with metastatic, asymptomatic hormone refractory prostate cancer. J Clin Oncol. 2006; 24(19): 3089–94. PMID: 16809734
21. Petrylak DP, Tangen CM, Hussain MH, Lara PN Jr., Jones JA, Taplin ME, et al. Docetaxel and estra-mustine compared with mitoxantrone and prednisone for advanced refractory prostate cancer. N Engl J Med. 2004; 351(15): 1513–20. PMID:15470214
22. de Bono JS, Logothetis CJ, Molina A, Fizazi K, North S, Chu L, et al. Abiraterone and increased survival in metastatic prostate cancer. N Engl J Med. 2011; 364(21): 1995–2005. doi:10.1056/
NEJMoa1014618PMID:21612468
23. Oudard S, Banu E, Medioni J, Scotte F, Banu A, Levy E, et al. What is the real impact of bone pain on survival in patients with metastatic hormone-refractory prostate cancer treated with docetaxel? BJU Int. 2009; 103(12): 1641–6. doi:10.1111/j.1464-410X.2008.08283.xPMID:19210673
24. Mariotto AB, Yabroff KR, Shao Y, Feuer EJ, Brown ML. Projections of the cost of cancer care in the United States: 2010–2020. J Natl Cancer Inst. 2011; 103(2): 117–28. doi:10.1093/jnci/djq495PMID: 21228314
25. American Cancer Society. Cancer facts & figures 2009. American Cancer Society website. Available: http://www.cancer.org/research/cancerfactsstatistics/cancerfactsfigures2009/index.
26. Murphy SL, Xu J, Kochanek KD. Deaths: final data for 2010. National Vital Statistics Reports. Centers for Disease Control and Prevention Web site. Available:http://stacks.cdc.gov/view/cdc/21508.
27. Scher HI, Halabi S, Tannock I, Morris M, Sternberg CN, Carducci MA, et al. Design and end points of clinical trials for patients with progressive prostate cancer and castrate levels of testosterone: recom-mendations of the Prostate Cancer Clinical Trials Working Group. J Clin Oncol. 2008; 26(7): 1148–59. doi:10.1200/JCO.2007.12.4487PMID:18309951