Evaluating the Photoprotective Effects of
Ochre on Human Skin by
In Vivo
SPF
Assessment: Implications for Human
Evolution, Adaptation and Dispersal
Riaan F. Rifkin1,2*, Laure Dayet3, Alain Queffelec3, Beverley Summers4, Marlize Lategan4, Francesco d’Errico3,2
1Institute for Archaeology, History, Culture and Religion, University of Bergen, Bergen, Norway, 2Evolutionary Studies Institute, University of the Witwatersrand, Johannesburg, South Africa,3Centre National de la Recherche Scientifique, Unité Mixte de Recherche, University of Bordeaux, Pessac, France, 4Photobiology Laboratory, Department of Pharmacy, University of Limpopo, Medunsa, South Africa
Abstract
Archaeological indicators of cognitively modern behaviour become increasingly prevalent during the African Middle Stone Age (MSA). Although the exploitation of ochre is viewed as a key feature of the emergence of modern human behaviour, the uses to which ochre and ochre-based mixtures were put remain ambiguous. Here we present the results of an exper-imental study exploring the efficacy of ochre as a topical photoprotective compound. This is achieved through thein vivocalculation of the sun protection factor (SPF) values of ochre
samples obtained from Ovahimba women (Kunene Region, Northern Namibia) and the Palaeozoic Bokkeveld Group deposits of the Cape Supergroup (Western Cape Province, South Africa). We employ visible spectroscopy, energy-dispersive X-ray fluorescence (ED-XRF), X-ray diffraction (XRD) and granulometric analyses to characterise ochre samples. The capacity of ochre to inhibit the susceptibility of humans to the harmful effects of expo-sure to ultraviolet radiation (UVR) is confirmed and the mechanisms implicated in the effi-cacy of ochre as a sunscreen identified. It is posited that the habitual application of ochre may have represented a crucial innovation for MSA humans by limiting the adverse effects of ultraviolet exposure. This may have facilitated the colonisation of geographic regions largely unfavourable to the constitutive skin colour of newly arriving populations.
Introduction
Climate exerts a significant influence on ecosystems, communities and populations [1–4]. Of the climate-driven selective pressures that operated during the evolutionary history of the genusHomo, negotiating the risks and benefits of persistent exposure to sunlight presented an enduring challenge. Sunlight is an essential environmental factor in nearly all ecosystems [5, OPEN ACCESS
Citation:Rifkin RF, Dayet L, Queffelec A, Summers B, Lategan M, d’Errico F (2015) Evaluating the Photoprotective Effects of Ochre on Human Skin by In VivoSPF Assessment: Implications for Human
Evolution, Adaptation and Dispersal. PLoS ONE 10 (9): e0136090. doi:10.1371/journal.pone.0136090
Editor:Michael D. Petraglia, University of Oxford, UNITED KINGDOM
Received:May 22, 2015
Accepted:July 29, 2015
Published:September 9, 2015
Copyright:© 2015 Rifkin et al. This is an open access article distributed under the terms of the
Creative Commons Attribution License, which permits unrestricted use, distribution, and reproduction in any medium, provided the original author and source are credited.
Data Availability Statement:All relevant data are within the paper. The dataset will also be made available on the lead authors ResearchGate account (https://www.researchgate.net/profile/Riaan_Rifkin).
6]. Most important in terms of human health are long-wave ultraviolet A (UVA) (315–400 nm) and medium-wave UVB (280–315 nm) radiation [7]. Whereas UVA causes DNA damage, skin aging and mild erythema in large doses, UVB is responsible for sunburn with subsequent DNA damage and skin cancers. Short-wave UVC (200–280 nm) is the most dangerous type of UVR but is largely absorbed by the ozone layer [6].
The beneficial effects of moderate sunlight exposure are numerous and several positive cor-relations exist between adequate UVR exposure, vitamin D synthesis and human fertility [8,9, 10]. Vitamin D (the active form being 1.25 dihydroxyvitamin D3or 1.25[OH]2D3) in turn reduces the incidence of rheumatoid arthritis, coronary heart disease, diabetes, multiple sclero-sis, rickets, schizophrenia, autoimmune disease and several types of cancer [11–14]. Con-versely, excessive UVR exposure frequently causes malignant skin diseases [11,15] and mitochondrial (mtDNA) and nuclear (nDNA) damage [16–18]. Quantitative (mtDNA copy number) and qualitative (mutations) alterations in mtDNA in turn result in neurodegenerative and metabolic diseases [19] and amplifies immune suppression [20]. Although UVR exposure is the foremost cause of skin cancers, it is also a primary source of vitamin D in light-skinned individuals. As vitamin D protects against cancer and many other diseases, there is some dis-agreement concerning the health benefits and risks associated with UVR [8].
It has also been proposed that excessive UVR may have had influenced evolutionary pro-cesses, including extinction events such as the disappearance of megafauna during the late Pleistocene [21–23] and the extinction of some hominin species [24,25]. It has been demon-strated that there is a correlation between hominin extinction events and the 41 ka orbital cycle attributable to change in our planets obliquity [25]. The first peaked 1.5 million years ago (mya) and closely followed the Olduvai (1.67 to 1.95 mya) and Gilsa (1.57 mya) geomagnetic excursions [26]. This event appears to coincide with the extinction ofParanthropus robustus, P.bosei,Homo ergaster,H.rudolfensisandH.habilis[25]. A second pulse of extinctions, affect-ingH.neanderthalensisandH.floresiensis, occurred during the last 120 ka and corresponds loosely with the Blake (138 ka to 100 ka) and Laschamp excursions [27–29]. The Laschamp excursion occurred at ~ 40 ka and has been cited as the most dramatic geomagnetic event to coincide with the extinction ofH.neanderthalensis[24,25,30,31]. Following the variable cli-mate experienced during Marine Isotope Stage (MIS) 3 between 60 ka and 40 ka, the clicli-mate began to cool and by 30 ka Neanderthals were extinct. Proposed reasons for their demise include climate change, catastrophic natural events, disease epidemics, food shortages and the inability to compete withH.sapiensor other predatory species [32–39]. Because Neanderthals have been shown to have had lightly pigmented skin [40,41], it has been suggested that increasing exposure to UVR may have been a factor in their disappearance [24,25,42].
These hypotheses are difficult to test because of the uncertainties concerning the dating of extinctions events and in calculating the impact of UVR changes at different latitudes and among different populations. Moreover, the absence of the MC1R gene variant (R307G) in Neanderthal and Denisovan genomes suggest that considerable variability in skin colour existed among archaic hominins, and that some Neanderthal and Denisovan groups had darker and therefore more UVR resistant skin tones [43,44]. Fluctuations in UVR intensity may nevertheless have generated a selective pressure on human populations that could have affected the life expectancy of portions of those populations.
During the Laschamp excursion, the dipole geomagnetic moment (the intensity of the mag-netic field currently expressed as 7.78 x 10²²A.m2), decreased by a factor of ~4 (from 10.5 x 10²²A.m2at 49 ka to 2.6 x 10²²A.m2at 41 ka), resulting in a twofold increase in cosmogenic nuclide deposition rates [45,46]. At the same time, the amount of solar-derived UVR reaching earth’s surface increased by>25% [47,48]. To put this surge in UVR into perspective, UVA
and UVB exposure in sub-Saharan Africa currently exceeds 250 watts (W) per active area (m2) Sefako Makgatho University of Health Sciences. The
authors also acknowledge assistance provided by the Namibian Ministry of Culture and the National Museum of Namibia.
and rarely falls below 175 W/m2[14]. UVR exposure levels>250 W/m2present extreme
expo-sure categories and are rated 10 (defined as posing a‘very high risk of harm from unprotected sun exposure’) to 11+ (‘extreme risk of harm from unprotected sun exposure’) [49]. Exposure levels raised by 25%, such as that brought on by the Laschamp event (at>300 W/m2), would
therefore have posed a sudden and severe health risk.
Strategies for dealing with increasing UVR exposure may have comprised both biological adaptations and behavioural advances [6,50]. The use of complex forms of clothing may have presented one option in terms of limiting the adverse effects of excessive UVR. The ability to transform animal hide into leather is one of the most important technological skills mastered by humans [34] and genetic research suggests that this may have occurred between 107 ka and 72 ka [51,52]. In lower latitudes characterised by high temperatures, clothing may have pre-sented a disadvantage, such as inducing increasing perspiration and diminishing thermal insu-lation due to evaporative cooling. In such regions, the topical application of ochre may have presented an important novel behavioural innovation. Resembling the positive impact of tech-nological innovation in enhancing human subsistence strategies [53–56], the topical applica-tion of ochre may therefore have served a significant funcapplica-tion in terms of limiting the adverse effects of UVR exposure.
In this paper we recall the physiological mechanisms involved in the UVR protection and skin pigmentation, identify viable ethnographic candidates for the photoprotective use of red ochre, summarize the archaeological evidence attesting such a use in the past and, more impor-tantly, experimentally test the efficacy of ochre as a topical photoprotective agent. As a result, we are able to demonstrate that certain types of iron-rich minerals, with or without binders, provide a perceptible degree of protection against UVR. We also evaluate the hypothesis that ochre may have been used as a sunscreen in the MSA and the Later Stone Age (LSA), discuss the advantages that such an innovation may have conveyed to our ancestors and propose a ten-tative scenario for its origin and geographic spread.
UVR Protective Mechanisms
Human skin derives most of its pigmentation from two types of melanin, a brownish-black eumelanin and a reddish-yellow pheomelanin. Whereas constitutive skin colour is the geneti-cally determined cutaneous melanin pigmentation generated without solar influence, faculta-tive skin colour is the short-lived tanning reaction elicited by exposure to UVR [57]. Many theories have been proposed to explain the variation in human skin pigmentation. For the development of skin darkening, examples include the shielding of sweat glands and blood ves-sels [58], protection from cancer and the overproduction of vitamin D [59], guarding against folate photodestruction [60] and defense against microorganisms [61] and infection [62]. Hypotheses for skin lightening comprise sexual selection, adaptation to cold UVR deficient cli-mates and the enhancement of vitamin D photoproduction [12]. An additional evolutionarily significant effect of UVR involves the metabolism of folate, a B vitamin essential for the modu-lation of gene expression and the production and repair of DNA [63]. Acute folate deficiencies result in male infertility and the increased prevalence of birth defects [64,65]. Maintaining ade-quate levels of folate is essential for human reproduction, and the evolution of dark skin pig-mentation was an effective means to achieve this [57,66].
from the equator to the poles being the product of two clines operating over a spatially varying optimum of UVR distribution [68,69]. The correlation between pigmentation in indigenous populations and latitude is therefore traceable to the correlation between skin colour and the intensity of UVR exposure [60,65,70–76] (Table 1).
Differences in skin pigmentation do not result from differences in the number of melano-cytes in the skin, but from differences in the melanogenic activity, the type of melanin pro-duced in melanosomes and the size, number and packaging of melanosomes, with melanin content of melanosomes ranging from 17.9% to 72.3%. While melanin content in the epidermis differs by two-fold in Asian, and white skin, dark skin contains higher levels of melanin (3 to 6 fold), has more eumelanin and larger melanosomes than white skin. As a result, and whereas a dark epidermis allows only 7.4% of UVR-B and 17.5% of UVR-A to penetrate the skin, 24% UVR-B and 55% UVR-A passes through white skin [77].
That darker pigmentation conferred significant adaptive benefits is shown by the conserva-tion of the MC1R, SLC45A2 and 70 other genetic loci involved in pigment producconserva-tion [78–80]. This indicates that there was strong evolutionary pressure to retain pigmentation among sub-Saharan Africa populations [62,65]. Unlike SLC45A2, which occurs only amongst Europeans, SLC24A5, TYRP1 and KITLG are present at low frequencies in some sub-Saharan populations [80]. While these alleles may have arisen in and spread out of Africa with the early migrations of modern humans, many may derive from a series of admixture events with groups containing Eurasian genetic ancestry [81].
Ethnographic Evidence
Ethnographic accounts illustrating the use of red ochre as a cosmetic are abundant and have been reported for San hunter-gatherers [82–89], Khoe pastoralists [90], and Tswana [91] and Xhosa [92] agro-pastoralists. Foremost examples of the habitual use of red ochre as a body cos-metic comprise the Cushitic-speaking Hamar in Southern Ethiopia [93,94] and the Ovahimba of Angola and Namibia [95–100]. The Ovahimba form part of a complex socio-economic assemblage of hunter-pastoralists who inhabit this region. They presumably represent a former Herero community who remained in the Kunene Region on a southward migration from the Central Lakes region into Namibia, or the final settlers in the terminal destination on a
Table 1. The classification of human skin types pertaining to responses to UVR exposure [70–75]. Constitutive values in brackets refer to the Von Lus-chan chromatic skin colour classification scale [76].‘Exposure’refers to the amount of time during which UVR exposure would not induce perceptible damage
to the skin. RSF is a factor characterizing the protective effect of a sunscreen against the generation of free radicals.
Skin type
Typical ethnicity Constitutive skin color Tanning ability Sunburn susceptibility Exposure (minutes) Cancer susceptibility Natural SPF RSF factor Recommended SPF
I Celtic White (1–5) Very poor High 5–10 High 1.0 <1.0 >30
II Northern European, Scandinavian
White (6–10) Poor High 10–20 High 1.8 1.0 30
III European, Caucasian
White (11–15) Good Moderate 20–30 Moderate 2.5 1.4 25
IV Asian, Inuit, San Bushmen, Mediterranean
Olive (16–21) Very good Low 40–60 Low 3.5 1.8 15–10
V Aboriginal, Papuan,
Amerindian, Indian
Brown (22–28) Very good Very low 60 Very low 9.0 2.5 10
VI African, Aboriginal,
South Indian Black (29–36) Very good Very low
>60 Very low 15.0 >2.5 <10
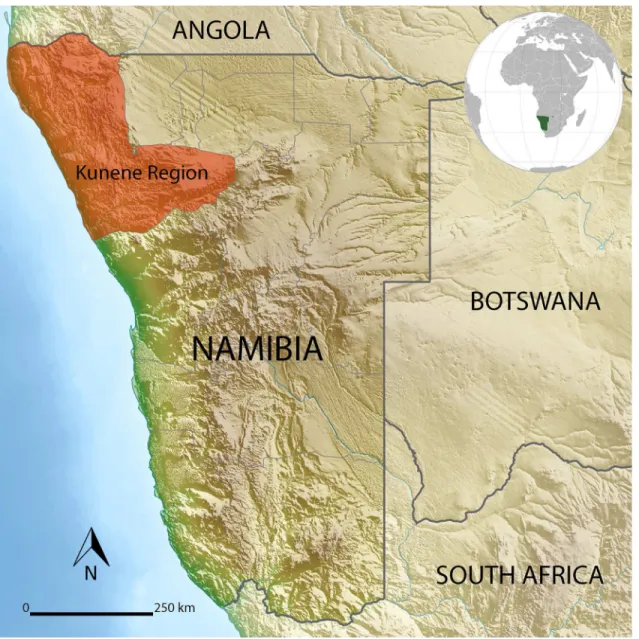
westward migration into the area after AD 1500 [99] (Fig 1). Recent archaeological excavations indicate that humans have inhabited the Kunene Region from at least 220 ka [101].
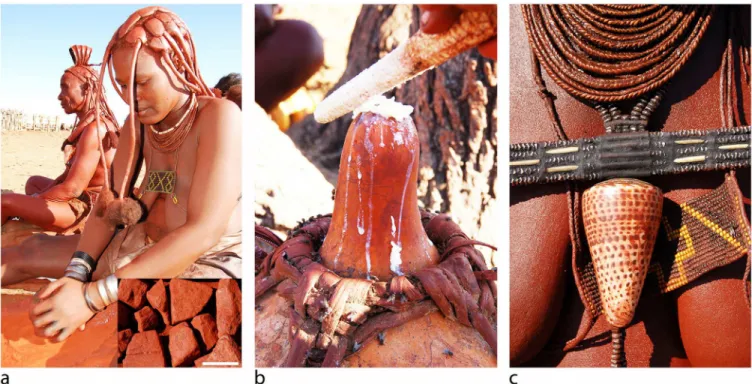
Ovahimba women are renowned for covering their bodies, hair and personal attire with a red ochre-based substance,‘otjise’, which consists of equal parts of milk-derived clarified butter and red ochre powder [100]. Alexander (1838) observed that both women and men are‘fond of greasing the skin’with otjise [102], and personal observations and ethnographic interviews conducted by two of us (RFR, FDE) confirm this statement. The habitual application of otjise by men only declined during the 1960s, largely as a result of the presence of the South African Defense Force in the region and the subsequent employment of some Ovahimba as soldiers (Hepuite Venjakera, Nakara Tjimbosi and Tharhirwa Shawari pers. comm. 2012 [103,104].
Clarified butter is produced by women and red ochre is mined or bought from Zemba land-owners or travelling merchants. While ochre processing occurs arbitrarily and forms part of the general sociable settings of daily life, the application of otjise occurs within the confines of women’s huts. Post menarche women mix roughly equal amounts of ochre powder and clari-fied butter together between the palms and apply 4.2mg of otjise per 1cm2of skin surface. Women therefore require 60g of red ochre powder to cover their bodies (every 2 to 3 days) and 320g to treat their hair (every 2 to 4 weeks) (Fig 2) [100]. Otjise features in initiation ceremo-nies, is applied by men when they are to be wed or when they undertake extensive journeys and used to cover human corpses prior to interment [95,97]. Personal belongings such as leather headdresses and aprons, wooden containers and jewellery are also covered with the compound, apparently for both symbolic and functional (preservative) purposes. Whereas infants are intentionally covered with the mixture, regular contact between women and children result in the substantial transfer of the red compound to toddlers. Ethnographic interviews conducted by two of us (RFR, FDE) (refer tohttp://www.canal-u.tv/video/cerimes/the_color_of_the_ ovahimba.15970) revealed that, besides the intrinsic symbolic significance of red ochre, it also fulfills several secondary functional roles, including that as a topical sun-protection element.
Archaeological Evidence
The exploitation of ochre of variable colour and geological origin is not restricted toHomo sapiens[105–107] and it does not reflect a sudden change signifying a shift away from archaic to modern and symbolic patterns of behaviour. Red ochre residues have been found inside per-forated shell beads from African and Near Eastern MSA and Levantine Mousterian sites dated from 92 ka to 60 ka [108–112]. Since strung beads were in all probability worn around the neck or wrists [113], these residues most likely transferred from human bodies onto the shells. But as direct evidence on how and why ochre was utilised during the MSA and LSA is not available, diverse interpretations for its usage have been proposed. Although the symbolic and functional significance of ochre is a hotly debated topic [114–123], these uses are not necessarily mutually exclusive.
played a key role in positively influencing human evolutionary outcomes [137,138]. Given that dark-skinned individuals are also subject to the harmful effects of UVR [68,69], the develop-ment of effective sun-protection strategies was essential. One solution may have entailed the topical application of organic or inorganic agents perceived to reduce the detrimental effects of UVR.
Materials and Methods
Permission to carry out the Namibian ethnographic research was provided by the Namibian Ministry of Culture and the Namibian Filming Authority. All individuals referred to and repre-sented in this manuscript have given written informed consent to publish case details, includ-ing data and photographs. Permission to collect ochre samples from the Palaeozoic Bokkeveld Group deposits was provided by private landowners. Informed consent forin vivoSPF
Fig 1. The location of the Kunene Region (red shaded area) in north-western Namibia (sourced fromhttps://en.wikipedia.org/wiki/Template: Location_map_Namibia/doc).
experiments was obtained in written form and approved by the Photobiology Laboratory of Medunsa Campus of the University of Limpopo (Sefako Makgatho University of Health Sci-ences) Research and Ethics Committee (Project Number MREC/H/158/2014). One of the authors (RFR) participated in thein vivoSPF trials.
Ochre
Thein vivoexperimental results reported here follows from an initialin vitroSPF assessment of 24 ochre samples derived from ethnographic sources and geological resources likely to have been exploited during the MSA [100,139]. Samples one to six derive from Okamanga, Ovin-jange and Otjongoro villages in the Kunene Region of Northern Namibia. These were acquired by Ovahimba women in Opuwo and derive from Ombumbuu red ochre mines near Ruacana. Red ochre derived this geological source appears to be particularly sought after by Ovahimba women across the Kunene Region. The samples were processed into powder by Ovahimba women by crushing and grinding ochre chunks between a round upper and a flat lower grind-stone. Samples 7 to 12 were acquired in Opuwo and were experimentally processed by direct grinding onto a coarse quartzite surface. This method resembles the techniques used to pro-duce ochre powder during the MSA [121]. An additional twelve samples, comprising yellow, grey and red specimens, were collected from the Palaeozoic Bokkeveld Group deposits of the Cape Supergroup [140]. These are mostly fissile shales and comprise the most likely source of ochre at Blombos Cave [133]. Six samples were processed into powder by direct grinding onto a coarse quartzitic sandstone surface, and six by way of the technique employed by Ovahimba women.Table 2presents information concerning the samples subjected to UVR during the experiments.
Fig 2. The production and application of otjise.(A) Red ochre powder is obtained by grinding chunks (inset—scale bar is 1cm) between a round upper and a flat lower grindstone, (B) after which it is mixed (at a 1:1 ratio between the palms) with milk-derived clarified butter and (C) applied to the hair, body and ornaments.
Binders
For the SPF assessments, ochre samples were mixed (at a 1:1 ratio) with two types of organic binders. Clarified butter was procured from Otjongoro village and subcutaneous fat from a kudu (Tragelaphus strepsiceros) antelope. As per the SANS 1557/ISO 24444in vivoSPF testing protocol [6], we applied 2mg of experimental materials per 1cm2of skin surface during the experiments. Although Ovahimba women typically apply 4.2mg otjise per cm2, we adhered to the standard 2mg/cm2ratio to acquire comparable SPF values. Given that Ovahimba women apply an additional 2.2mg per cm2, the actual SPF values are likely to be significantly higher than the results presented here.
Analytical methods
Ultraviolet radiation (UVR). The assessment of the efficiency of a sunscreen is based on the value of its‘sun protection factor’(SPF), which reflects the degree of protection against UVR-induced erythema. At a certain exposure dose of UVB, minimally detectable redness can be observed. This is referred to as the minimal erythema dose (MED). SPF is the ratio of MED after sunscreen application and baseline (untreated) MED. Whereas SPF values generally denote the efficiency of a sunscreen to protect the skin from medium-wave UVB (280–315 nm) radiation, UVA is also a component of the solar simulated radiation which forms part of thein vivoSPF test. UVAPF denotes its UVA or long-wave ultraviolet (315–400 nm) protec-tion factor. A sunscreen with an SPF of 2 filters out 50% of UV, an SPF of 15 filters out 93%
Table 2. Experimental ochre samples subjected to SPF, ED-XRF, XRD, granulometric, colorimetric and UVR analyses.
Sample Source Description Processing method
1 Okamanga Fine ground ochre powder Ethnographically ground (by Ovahimba)
2 Okamanga Fine ground ochre powder Ethnographically ground (by Ovahimba)
3 Okamanga Fine ground ochre powder Ethnographically ground (by Ovahimba)
4 Okamanga Fine ground ochre powder Ethnographically ground (by Ovahimba)
5 Ovinjange Fine ground ochre powder Ethnographically ground (by Ovahimba)
6 Otjongoro Fine ground ochre powder Ethnographically ground (by Ovahimba)
7 Opuwo Fine-grained red ochre chunk Experimentally ground onto quartzite slab
8 Opuwo Fine-grained red ochre chunk Experimentally ground onto quartzite slab
9 Opuwo Fine-grained red ochre chunk Experimentally ground onto quartzite slab
10 Opuwo Fine-grained red ochre chunk Experimentally ground onto quartzite slab
11 Opuwo Fine-grained red ochre chunk Experimentally ground onto quartzite slab
12 Opuwo Fine-grained red ochre chunk Experimentally ground onto quartzite slab
13 Napier Soft yellow limonite chunk Experimentally ground onto quartzite slab
14 Blombos Soft grey shale cobble Experimentally ground onto quartzite slab
15 Napier Medium hard red shale chunk Experimentally ground onto quartzite slab
16 Napier Medium hard red shale chunk Experimentally ground onto quartzite slab
17 De Hoop Soft light red shale chunk Experimentally ground onto quartzite slab
18 Cape Point Hard red shale ochre chunk Experimentally ground onto quartzite slab
19 Napier Soft yellow limonite chunk Experimentally ground (like Ovahimba)
20 Blombos Soft grey shale cobble Experimentally ground (like Ovahimba)
21 Napier Medium hard red shale chunk Experimentally ground (like Ovahimba)
22 Napier Medium hard red shale chunk Experimentally ground (like Ovahimba)
23 De Hoop Soft light red shale chunk Experimentally ground (like Ovahimba)
24 Cape Point Hard red shale ochre chunk Experimentally ground (like Ovahimba)
UV and an SPF of 50 filters out 98% UV [6,141]. In theory, the application of a product with SPF of 5 provides sun protection for five times longer than unprotected skin. Modern sun-screens typically comprise UVR absorbing chemicals that attenuate the amount of UVR reach-ing viable cells in the skin. Sunscreens contain chemical filters that absorb UVB radiation and physical filters that attenuate UVA and UVB radiation through reflection and scattering [6, 50]. Whereas organic molecules are selected for their UVR absorption capacity (cinnamates, benzophenone and butylmethoxy dibenzoyl methane), inorganic particles (zinc, titanium and iron oxides) are selected for their capacity to absorb, reflect or scatter UVR [142]. Sunscreens do not completely prevent photodamage but they do alter the UVR spectrum that reaches skin cells [7].
The UVR protection capacities (SPF and UVAPF values) of ochre samples were established by means of a series of initialin vitroandin vivoexperiments performed under controlled con-ditions at the Photobiology Laboratory, Medunsa Campus (Sefako Makgatho University), South Africa [143]. As an initial screening method, experimental samples were subjected toin vitroprotection tests [100]. The samples were applied to Transpore tape at a ratio of 2mg/cm2 and analysed according to the SANS 1557:1992 procedure. Critical Wavelength (CW) was determined using the Optometrics SPF 290 method. This method was chosen as there is unlikely to be photodegradation of the samples, hence the more recent ISO/SANS 24443 were not considered necessary. The CW is the wavelength below which 90% of the UV protection is situated. Accordingly, the higher the CW, the higher the UVA protection ranges of the products. Following the initialin vitroexperiments, the six ochre samples with the highest SPF values (red ochre samples 1, 5, 7, 10, 16 and 18) were selected forin vivoSPF assessment. Informed consent was obtained from all research participants and the principles of the Decla-ration of Helsinki were strictly adhered to. Thein vivoSPF test method followed the SANS 1557/ISO 24444 SPF test protocol. Tests were performed on three test subjects, designated A, B and C, with skin phototype II, and conducted using an application quantity of 2mg/cm2. The UV irradiation sources consisted of a calibrated Multiport Solar Simulator. An SPF 15 refer-ence standard was included in the test and erythema was assessed visually by two experirefer-enced assessors 24 hours after irradiation.
Visible spectroscopy. To determine whether colour played a role in the UVR reflectance and absorption capabilities of ochre, visible spectroscopy was employed to obtain Labvalues
for each sample. We used an Avantes AvaSpec2048 fibre optic spectrometer equipped with a 2048 pixel CCD detector set to operate in the retrodiffusion mode. This instrument is equipped with an optical fibre probe, which is set in contact with the powder samples stored in transpar-ent plastic bags. An AvaLight-HAL was used as an illumination source. The equipmtranspar-ent is cali-brated with a Halon D65 white reference sample in the same lighting conditions as for the archaeological samples. The colour parameters were obtained by Avasoft 7.5 software.
Particle size analyses. Since particle size distribution may play an important role in deter-mining the UVR protection capacities of clay minerals [144], ochre samples were subjected to particle size analyses. We used a Horiba LA950 (0.01μm—3000μm) laser micro-granulometer
the use of D10, D25 and D50 values, the size of the particles that represent the 10th, 25th and the 50th percentile of the cumulative granulometric distribution. A sample with a D10 value of 15μm is a sample in which 10% of the particles are smaller or equal to 15μm. For the ternary
plots, standard geological scales and terminologies were employed. Clay, silt and sand catego-ries comprise the amounts of particles smaller than 7μm, between 7μm and 63μm and between
63μm and 2mm, respectively. The limit of 7μm is based on the demonstration by Konert and
Vandenberghe (1997) [146] that this is the value that correlates better, when laser granulome-try is used, to the particle size value of the clay fraction (<2μm) of previous sedimentological
methods.
Energy dispersive X-ray fluorescence (ED-XRF). The ED-XRF measurements were car-ried out using a portable SPECTRO xSORT X-ray fluorescence spectrometer from AMETEK equipped with a silicon drift detector (SDD) and a low power W X-ray tube with an excitation source of 40 kV. Samples were positioned above a 7mm diameter spectrometer aperture and analysed from below for 60 seconds. For data treatment, we used the peak count rates of all detected elements and quantitative data for a selection of elements. The quantitative data were calculated according to a calibration operated with AMETEK X-LabPro software. This calibra-tion was constructed by using 12 certified and local references and allows for the semi-quantifi-cation of 7 major and trace elements among the most abundant in ferruginous rocks
(normalised concentrations are presented in oxide weight) [147].
X-ray diffraction (XRD). Ochre samples were analysed by way of X-ray diffraction using a silicon calibrated Panalytical diffractometer with a Bragg-Brentano (theta-theta) configura-tion. Data acquisition times of 30 minutes allowed an angle range of 8 to 80° with a resolution of 0.02°. The diffraction spectra were analysed using EVA application software coupled with the JCPDS-ICDD database. The mineral species were identified by their respective combina-tions of two or three characteristic peaks. This first qualitative determination was validated and quantified using TOPAS software. The best fit for each measure was determined using Riet-veld’s refinement method [148]. This procedure ensured that the determinations made with EVA did not overlook information masked by overlapping peaks and allowed precise quantifi-cation of the relative proportions of each mineral.
Results
Characterisation of ochre samples
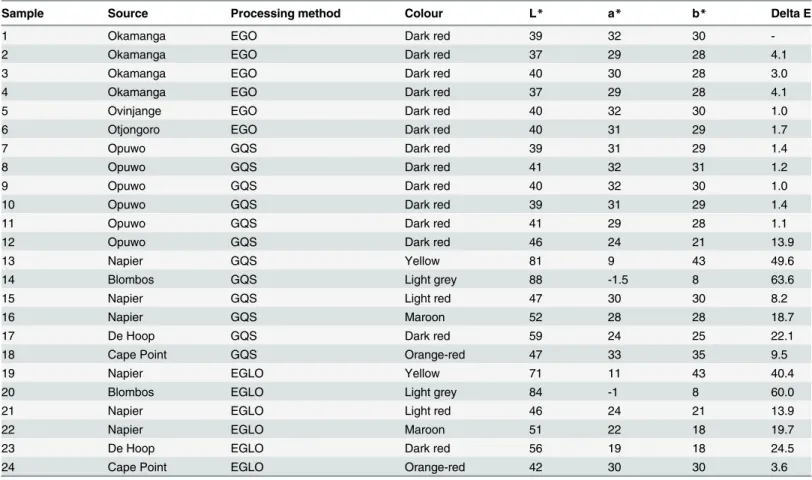
Colourimetry. The colorimetric values of samples are presented inTable 3. Pigment pow-der produced by Ovahimba women appear colorimetrically homogeneous and display differ-ences in Labcoordinates (ΔE) of less than 2.4. This is well below 5, the value generally
considered as the limit above which a significant colour difference can be perceived by humans [149]. The South African Bokkeveld Group red ochre samples display the same range of hue and chroma (similar aand bvalues) as the other red ochre samples. Only lightness (L)
val-ues are dissimilar, with Ovahimba red ochres being darker.
It has been shown that different ochre processing techniques result in differences in pigment powder consistency and colour [121]. In this study, ochre powder produced by direct grinding presents higher chroma (aand bvalues) than powder obtained by grinding with lower and
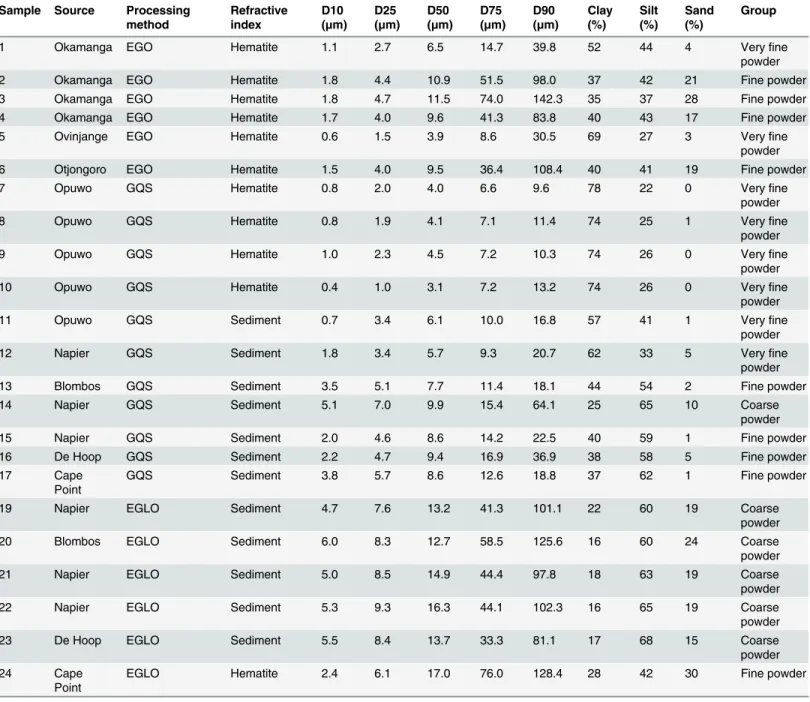
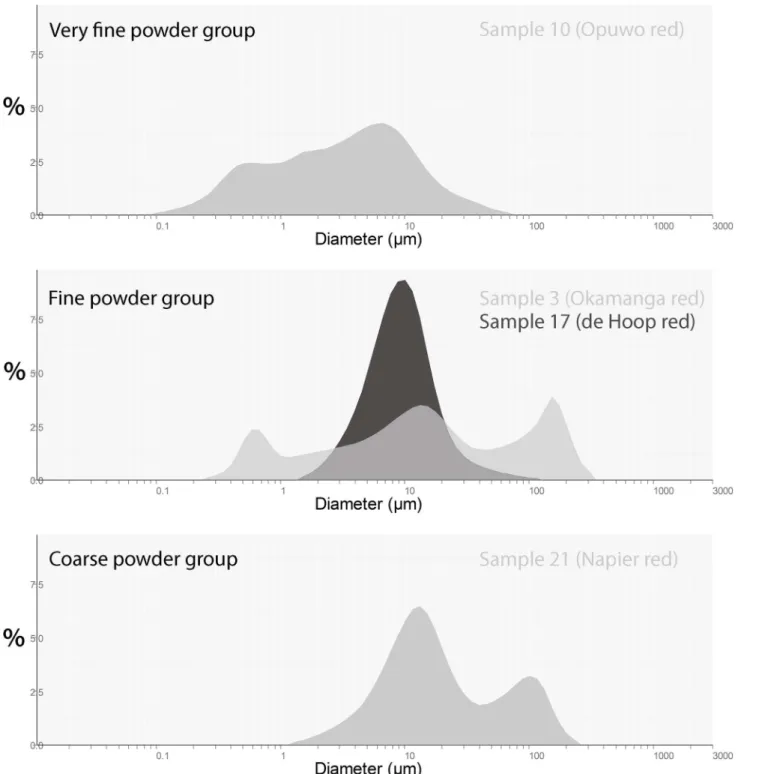
Granulometry. Grain size analysis identifies three broad groups of samples including 1) very fine powders, 2) fine powders and 3) coarse powders (Table 4). The first group has a D10 value close to 1μm and a clay-size proportion approximating or exceeding 60%. This is the case
for the samples from Opuwo which were ground directly onto quartzite surfaces. The fine pow-ders display D10 values ranging between 1.5μm and 4μm and a clay content<50%. Most of
the samples processed by Ovahimba women fall into this category. The third group is charac-terised by a D10 close to 5 or higher and a clay-sized content<30%. The samples
experimen-tally processed by way of the technique employed by the Ovahimba belong to this group. Differences in grain size between samples ground by the Ovahimba and experimentally by the authors are significant. Results suggest that, in order to be effective, the Ovahimba technique must be applied to fine-grained iron-rich sources. The application of this technique to process ochre with a high proportion of quartz, such as those from Cape Point, produces coarse-grained pigment powder (Table 4). Every sample shows multimodal grain size distribution (Fig 3) which is classical in grinding processes and especially in these materials comprised of multi-ple mineral phases of dissimilar hardness.
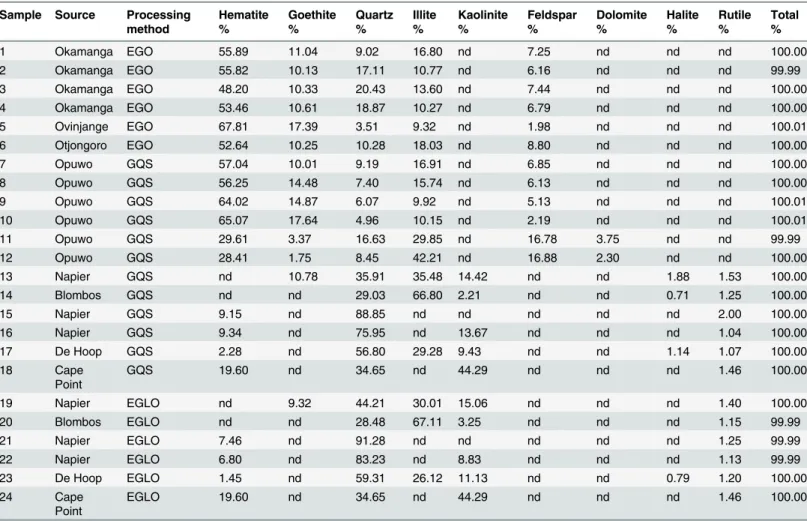
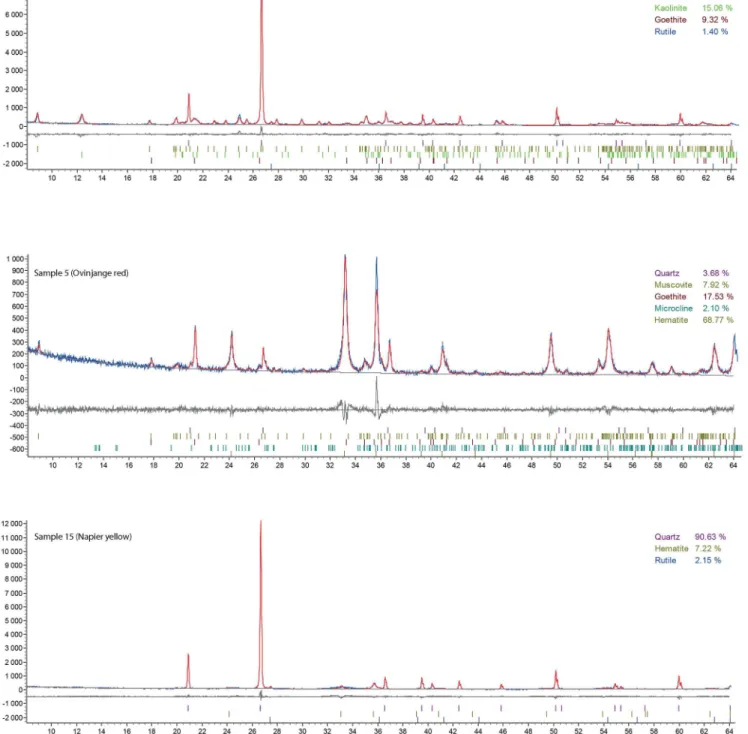
Mineralogical composition. Analysed samples comprise variable amounts of iron oxides, clays and quartz (Table 5). Goethite and hematite are present in almost all samples, with hema-tite being the primary constituent. No hemahema-tite is detected in the yellow (13 and 19) and grey
Table 3. L*a*b*colourimetric properties of ethnographic and experimental ochre samples with L*representing lightness (100 white / 0 black), a* indicating variations between red (+) and green (-), and b*representing variations between yellow (+) and blue components (-). The first sample was arbitrarily selected as the reference sample and the Delta E (ΔE) values calculated accordingly.
Sample Source Processing method Colour L* a* b* Delta E
1 Okamanga EGO Dark red 39 32 30
-2 Okamanga EGO Dark red 37 29 28 4.1
3 Okamanga EGO Dark red 40 30 28 3.0
4 Okamanga EGO Dark red 37 29 28 4.1
5 Ovinjange EGO Dark red 40 32 30 1.0
6 Otjongoro EGO Dark red 40 31 29 1.7
7 Opuwo GQS Dark red 39 31 29 1.4
8 Opuwo GQS Dark red 41 32 31 1.2
9 Opuwo GQS Dark red 40 32 30 1.0
10 Opuwo GQS Dark red 39 31 29 1.4
11 Opuwo GQS Dark red 41 29 28 1.1
12 Opuwo GQS Dark red 46 24 21 13.9
13 Napier GQS Yellow 81 9 43 49.6
14 Blombos GQS Light grey 88 -1.5 8 63.6
15 Napier GQS Light red 47 30 30 8.2
16 Napier GQS Maroon 52 28 28 18.7
17 De Hoop GQS Dark red 59 24 25 22.1
18 Cape Point GQS Orange-red 47 33 35 9.5
19 Napier EGLO Yellow 71 11 43 40.4
20 Blombos EGLO Light grey 84 -1 8 60.0
21 Napier EGLO Light red 46 24 21 13.9
22 Napier EGLO Maroon 51 22 18 19.7
23 De Hoop EGLO Dark red 56 19 18 24.5
24 Cape Point EGLO Orange-red 42 30 30 3.6
EGO: ground by Ovahimba; GQS: Experimentally ground onto quartzite slab; EGLO: Experimentally ground (like Ovahimba)
ochre samples (14 and 20), the former containing only goethite and the latter being the only sample in which iron oxide could not be detected. In comparison with other red samples, Ova-himba red ochre typically contains less quartz and clay minerals (illite and kaolinite) and more iron oxides (Fig 4). Most of the Ovahimba samples are composed of more than 60% iron oxides/oxy-hydroxides. In the samples derived from Cape Point, the concentration in iron oxide/oxy-hydroxide does not exceed 20%.
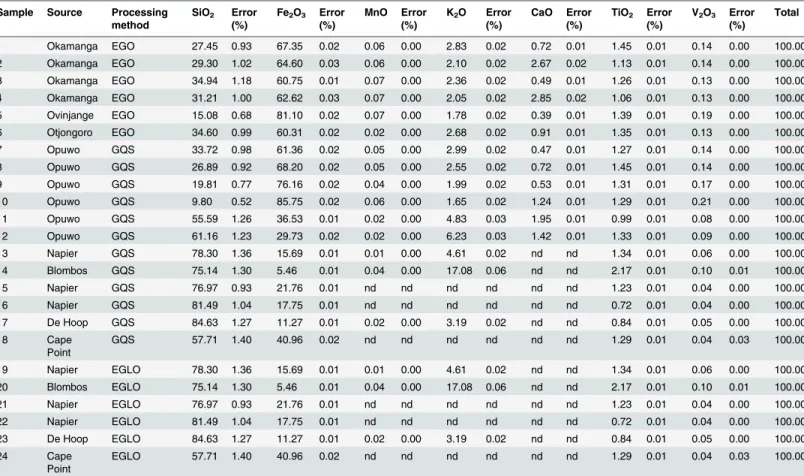
Elemental composition. Fe and Si are the two major elements detected by ED-XRF (Table 6). The relative contents of Fe (Fe2O3), Si (SiO2) and other minor elements were
Table 4. Results for particle size analyses of ochre samples.
Sample Source Processing method
Refractive index
D10 (μm)
D25 (μm)
D50 (μm)
D75 (μm)
D90 (μm)
Clay (%) Silt (%) Sand (%) Group
1 Okamanga EGO Hematite 1.1 2.7 6.5 14.7 39.8 52 44 4 Veryfine
powder
2 Okamanga EGO Hematite 1.8 4.4 10.9 51.5 98.0 37 42 21 Fine powder
3 Okamanga EGO Hematite 1.8 4.7 11.5 74.0 142.3 35 37 28 Fine powder
4 Okamanga EGO Hematite 1.7 4.0 9.6 41.3 83.8 40 43 17 Fine powder
5 Ovinjange EGO Hematite 0.6 1.5 3.9 8.6 30.5 69 27 3 Veryfine
powder
6 Otjongoro EGO Hematite 1.5 4.0 9.5 36.4 108.4 40 41 19 Fine powder
7 Opuwo GQS Hematite 0.8 2.0 4.0 6.6 9.6 78 22 0 Veryfine
powder
8 Opuwo GQS Hematite 0.8 1.9 4.1 7.1 11.4 74 25 1 Veryfine
powder
9 Opuwo GQS Hematite 1.0 2.3 4.5 7.2 10.3 74 26 0 Veryfine
powder
10 Opuwo GQS Hematite 0.4 1.0 3.1 7.2 13.2 74 26 0 Veryfine
powder
11 Opuwo GQS Sediment 0.7 3.4 6.1 10.0 16.8 57 41 1 Veryfine
powder
12 Napier GQS Sediment 1.8 3.4 5.7 9.3 20.7 62 33 5 Veryfine
powder
13 Blombos GQS Sediment 3.5 5.1 7.7 11.4 18.1 44 54 2 Fine powder
14 Napier GQS Sediment 5.1 7.0 9.9 15.4 64.1 25 65 10 Coarse
powder
15 Napier GQS Sediment 2.0 4.6 8.6 14.2 22.5 40 59 1 Fine powder
16 De Hoop GQS Sediment 2.2 4.7 9.4 16.9 36.9 38 58 5 Fine powder
17 Cape
Point
GQS Sediment 3.8 5.7 8.6 12.6 18.8 37 62 1 Fine powder
19 Napier EGLO Sediment 4.7 7.6 13.2 41.3 101.1 22 60 19 Coarse
powder
20 Blombos EGLO Sediment 6.0 8.3 12.7 58.5 125.6 16 60 24 Coarse
powder
21 Napier EGLO Sediment 5.0 8.5 14.9 44.4 97.8 18 63 19 Coarse
powder
22 Napier EGLO Sediment 5.3 9.3 16.3 44.1 102.3 16 65 19 Coarse
powder
23 De Hoop EGLO Sediment 5.5 8.4 13.7 33.3 81.1 17 68 15 Coarse
powder
24 Cape
Point
EGLO Hematite 2.4 6.1 17.0 76.0 128.4 28 42 30 Fine powder
EGO: ground by Ovahimba; GQS: Experimentally ground onto quartzite slab; EGLO: Experimentally ground (like Ovahimba)
calculated following calibration and normalization to 100%. CaO and K2O are only present as minor components, except in the sample from Blombos (sample 14) which contain higher pro-portions of K. TiO2is also present as a minor constituent. Compared to samples collected from the Bokkeveld shales, the ratio of Fe2O3to SiO2is significantly higher in most of the Ovahimba samples. Two samples from Opuwo (11 and 12) present lower Fe contents and lower ratio of
Fig 3. Representative grain size distributions for each group.
Fe2O3to SiO2than the other Ovahimba samples. This is consistent with the XRD results. Only the samples from Cape Point (18 and 24) present Fe2O3to SiO2ratios as high as those recorded for the Opuwo samples.
XRD and ED-XRF data are in general agreement with regards the iron oxide content of the samples. Significant discrepancies between the calculated Fe2O3and hematite and goethite concentrations concern the samples from Napier (15 and 16) and Cape Point (18 and 24), where the former is twice as high as the latter. This could be explained by a low degree of goe-thite and hematite crystallinity, leading to an underestimation of their concentration by the Rietveld refinement technique. XRD and ED-XRF are also concordant for K2O and illite/mus-covite or microcline content respectively for Cape Point and Ovahimba samples.
SPF values. Thein vitroSPF of the samples range from 1.9 (± 0.1) to 13.1 (± 1.1) (Table 7). Pigment powder produced by Ovahimba women consistently exhibit SPF values higher than those recorded for specimens processed experimentally by the authors. Given their highin vitroSPF and UVAPF values, samples 1, 5, 7, 10, 16 and 18 were subjected toin vivo SPF analysis. Thein vivoSPF of the samples, applied to human skin after being mixed with clarified butter, range from 3.5 to 10.7 (Table 8). As indicated by the results obtained for sub-jects A, B and C, actual and average SPF values are not markedly divergent and experimental
Table 5. Results of XRD analyses of ethnographic and experimental ochre samples.
Sample Source Processing method Hematite % Goethite % Quartz % Illite % Kaolinite % Feldspar % Dolomite % Halite % Rutile % Total %
1 Okamanga EGO 55.89 11.04 9.02 16.80 nd 7.25 nd nd nd 100.00
2 Okamanga EGO 55.82 10.13 17.11 10.77 nd 6.16 nd nd nd 99.99
3 Okamanga EGO 48.20 10.33 20.43 13.60 nd 7.44 nd nd nd 100.00
4 Okamanga EGO 53.46 10.61 18.87 10.27 nd 6.79 nd nd nd 100.00
5 Ovinjange EGO 67.81 17.39 3.51 9.32 nd 1.98 nd nd nd 100.01
6 Otjongoro EGO 52.64 10.25 10.28 18.03 nd 8.80 nd nd nd 100.00
7 Opuwo GQS 57.04 10.01 9.19 16.91 nd 6.85 nd nd nd 100.00
8 Opuwo GQS 56.25 14.48 7.40 15.74 nd 6.13 nd nd nd 100.00
9 Opuwo GQS 64.02 14.87 6.07 9.92 nd 5.13 nd nd nd 100.01
10 Opuwo GQS 65.07 17.64 4.96 10.15 nd 2.19 nd nd nd 100.01
11 Opuwo GQS 29.61 3.37 16.63 29.85 nd 16.78 3.75 nd nd 99.99
12 Opuwo GQS 28.41 1.75 8.45 42.21 nd 16.88 2.30 nd nd 100.00
13 Napier GQS nd 10.78 35.91 35.48 14.42 nd nd 1.88 1.53 100.00
14 Blombos GQS nd nd 29.03 66.80 2.21 nd nd 0.71 1.25 100.00
15 Napier GQS 9.15 nd 88.85 nd nd nd nd nd 2.00 100.00
16 Napier GQS 9.34 nd 75.95 nd 13.67 nd nd nd 1.04 100.00
17 De Hoop GQS 2.28 nd 56.80 29.28 9.43 nd nd 1.14 1.07 100.00
18 Cape
Point GQS 19.60 nd 34.65 nd 44.29 nd nd nd 1.46 100.00
19 Napier EGLO nd 9.32 44.21 30.01 15.06 nd nd nd 1.40 100.00
20 Blombos EGLO nd nd 28.48 67.11 3.25 nd nd nd 1.15 99.99
21 Napier EGLO 7.46 nd 91.28 nd nd nd nd nd 1.25 99.99
22 Napier EGLO 6.80 nd 83.23 nd 8.83 nd nd nd 1.13 99.99
23 De Hoop EGLO 1.45 nd 59.31 26.12 11.13 nd nd 0.79 1.20 100.00
24 Cape
Point EGLO 19.60 nd 34.65 nd 44.29 nd nd nd 1.46 100.00
EGO: ground by Ovahimba; GQS: Experimentally ground onto quartzite slab; EGLO: Experimentally ground (like Ovahimba); nd: not detected
samples do display a degree of consistency in terms of their respective SPF values. Sample 18 (Cape Point—hard shale-derived red ochre) provides the highest SPF values, followed by sam-ple 16 (Napier—medium hard shale-derived red ochre) and sample 10 (Opuwo—fine-grained red ochre).
Fig 4. XRD spectra recorded for ochre samples 5 (Ovinjange fine ground ochre powder), 15 (Napier medium hard red shale chunk) and 19 (Napier soft yellow limonite chunk).
SPF values obtained byin vivoassessment for red ochre samples mixed with both clarified butter and with animal fat on test subject A range from 4.5 to 10.0. When mixed with animal fat, SPF values range from 5.4 to 9.8. The type of binder used, whether it is dairy derived clari-fied butter or subcutaneous animal fat, appears to have no marked effects on the SPF capacity of ochre. A comparison of average SPF values obtained for samples applied in dry form and with binders (clarified butter and animal fat), indicates that dry ochre powder provides a degree of protection against UVR similar to ochre powder mixed with clarified butter and with animal fat. This suggests that it is not necessary to mix ochre powder with a binder to achieve satisfactory SPF values.
Correlations between SPF and chemical and structural characteristics
A positive correlation is observed betweenin vitroSPF values and the proportion of particles
<2μm, hematite and goethite content and Fe2O3and V2O3normalised percentages (p =<0.05)
(Table 9). A negative correlation is observed between SPF values and the granulometric data D10 to D50, clay mineral content and SiO2. Similar trends are observed for thein vitroUVAPF values.
Figs5and6explore the relationship between SPF and grain size composition (Fig 5A and 5B), mineral content (Fig 5C and 5D), elemental composition (Fig 5E and 5F) and colour (Fig 6A and 6B). The ternary diagram correlating grain size and SPF (Fig 5A) reveals that the finer the ochre powder, the higher the photoprotective effect (SPF values). This effect becomes
Table 6. Results of ED-XRF analyses of ethnographic and experimental ochre samples.
Sample Source Processing method
SiO2 Error (%)
Fe2O3 Error (%)
MnO Error (%)
K2O Error (%)
CaO Error (%)
TiO2 Error (%)
V2O3 Error (%)
Total
1 Okamanga EGO 27.45 0.93 67.35 0.02 0.06 0.00 2.83 0.02 0.72 0.01 1.45 0.01 0.14 0.00 100.00
2 Okamanga EGO 29.30 1.02 64.60 0.03 0.06 0.00 2.10 0.02 2.67 0.02 1.13 0.01 0.14 0.00 100.00
3 Okamanga EGO 34.94 1.18 60.75 0.01 0.07 0.00 2.36 0.02 0.49 0.01 1.26 0.01 0.13 0.00 100.00
4 Okamanga EGO 31.21 1.00 62.62 0.03 0.07 0.00 2.05 0.02 2.85 0.02 1.06 0.01 0.13 0.00 100.00
5 Ovinjange EGO 15.08 0.68 81.10 0.02 0.07 0.00 1.78 0.02 0.39 0.01 1.39 0.01 0.19 0.00 100.00
6 Otjongoro EGO 34.60 0.99 60.31 0.02 0.02 0.00 2.68 0.02 0.91 0.01 1.35 0.01 0.13 0.00 100.00
7 Opuwo GQS 33.72 0.98 61.36 0.02 0.05 0.00 2.99 0.02 0.47 0.01 1.27 0.01 0.14 0.00 100.00
8 Opuwo GQS 26.89 0.92 68.20 0.02 0.05 0.00 2.55 0.02 0.72 0.01 1.45 0.01 0.14 0.00 100.00
9 Opuwo GQS 19.81 0.77 76.16 0.02 0.04 0.00 1.99 0.02 0.53 0.01 1.31 0.01 0.17 0.00 100.00
10 Opuwo GQS 9.80 0.52 85.75 0.02 0.06 0.00 1.65 0.02 1.24 0.01 1.29 0.01 0.21 0.00 100.00
11 Opuwo GQS 55.59 1.26 36.53 0.01 0.02 0.00 4.83 0.03 1.95 0.01 0.99 0.01 0.08 0.00 100.00
12 Opuwo GQS 61.16 1.23 29.73 0.02 0.02 0.00 6.23 0.03 1.42 0.01 1.33 0.01 0.09 0.00 100.00
13 Napier GQS 78.30 1.36 15.69 0.01 0.01 0.00 4.61 0.02 nd nd 1.34 0.01 0.06 0.00 100.00
14 Blombos GQS 75.14 1.30 5.46 0.01 0.04 0.00 17.08 0.06 nd nd 2.17 0.01 0.10 0.01 100.00
15 Napier GQS 76.97 0.93 21.76 0.01 nd nd nd nd nd nd 1.23 0.01 0.04 0.00 100.00
16 Napier GQS 81.49 1.04 17.75 0.01 nd nd nd nd nd nd 0.72 0.01 0.04 0.00 100.00
17 De Hoop GQS 84.63 1.27 11.27 0.01 0.02 0.00 3.19 0.02 nd nd 0.84 0.01 0.05 0.00 100.00
18 Cape
Point
GQS 57.71 1.40 40.96 0.02 nd nd nd nd nd nd 1.29 0.01 0.04 0.03 100.00
19 Napier EGLO 78.30 1.36 15.69 0.01 0.01 0.00 4.61 0.02 nd nd 1.34 0.01 0.06 0.00 100.00
20 Blombos EGLO 75.14 1.30 5.46 0.01 0.04 0.00 17.08 0.06 nd nd 2.17 0.01 0.10 0.01 100.00
21 Napier EGLO 76.97 0.93 21.76 0.01 nd nd nd nd nd nd 1.23 0.01 0.04 0.00 100.00
22 Napier EGLO 81.49 1.04 17.75 0.01 nd nd nd nd nd nd 0.72 0.01 0.04 0.00 100.00
23 De Hoop EGLO 84.63 1.27 11.27 0.01 0.02 0.00 3.19 0.02 nd nd 0.84 0.01 0.05 0.00 100.00
24 Cape
Point
EGLO 57.71 1.40 40.96 0.02 nd nd nd nd nd nd 1.29 0.01 0.04 0.03 100.00
EGO: ground by Ovahimba; GQS: Experimentally ground onto quartzite slab; EGLO: Experimentally ground (like Ovahimba), nd: not detected
particularly intense when the mean size of the particles, at the first 25 centiles (D25) of the pig-ment grain size distribution, ranges between 1μm and 5μm (Fig 5B). SPF values derived from
samples that were processed by way of different techniques are also of interest. SPF values tend to be higher when the grinding process resulted in the incidence of smaller particle sizes. Results also indicate that, when abraded directly on coarse grindstone surfaces, less homoge-neous specimens, such as those from the Bokkeveld Group, can generate SPF values compara-ble to those obtained from homogeneous specimens, such as the Kunene Region (Ombumbuu) samples.
The ternary diagram and biplot (Fig 5C and 5D) illustrate the relationship between SPF and mineralogical composition and confirm the positive correlation between iron-rich minerals and higher SPF values. This is further supported by the results obtained for samples 11 and 12. Despite deriving from the Kunene Region, both exhibit low SPF values. This is largely due to their low hematite and goethite content. These diagrams furthermore show that samples in which iron-rich minerals are represented solely by goethite possess comparable SPF values to those in which hematite or hematite and goethite are present in the same quantities. Elemental analyses reveal a similar pattern. The correlation between the bulk normalised Fe2O3content andin vitroSPF is shown to be significant, but not linear (Fig 5E and 5F). SPF is positively cor-related with ochre samples in which Fe2O3contents range between 5% and 50%, but is not fur-ther influenced once this element constitutes>60% of the sample. Conversely, TiO2does not Table 7. In vivoSPF andin vitroUVAPF values and critical wavelengths (CW) of ethnographic and experimental ochre powder samples.
Sample Source Processing method Colour SPF SD UVAPF SD CW SD
1 Okamanga EGO Dark red 13.1 1.1 4.0 0.3 389.2 0.1
2 Okamanga EGO Dark red 8.6 0.6 8.0 2.7 389.1 0.1
3 Okamanga EGO Dark red 6.8 0.5 3.5 0.4 389.6 0.0
4 Okamanga EGO Dark red 7.0 0.9 3.4 0.4 389.6 0.3
5 Ovinjange EGO Dark red 12.4 2.6 13.7 2.8 389.4 0.0
6 Otjongoro EGO Dark red 6.3 1.3 6.3 1.3 389.5 0.1
7 Opuwo GQS Dark red 10.5 3.9 11.5 3.7 389.4 0.2
8 Opuwo GQS Dark red 7.3 3.2 8.8 3.5 389.7 0.1
9 Opuwo GQS Dark red 5.5 0.9 6.3 0.9 389.8 0.2
10 Opuwo GQS Dark red 8.3 1.0 10.3 1.0 389.8 0.2
11 Opuwo GQS Dark red 4.0 0.5 4.7 0.4 390.0 0.0
12 Opuwo GQS Dark red 3.8 0.3 3.3 0.3 388.2 0.3
13 Napier GQS Yellow 6.4 2.2 5.9 1.9 387.7 0.3
14 Blombos GQS Light grey 2.4 0.3 2.1 0.2 387.5 0.1
15 Napier GQS Light red 4.1 0.3 4.0 0.3 389.2 0.1
16 Napier GQS Maroon 7.7 3.1 8.0 2.7 389.1 0.1
17 De Hoop GQS Dark red 3.0 0.5 2.9 0.4 389.1 0.0
18 Cape Point GQS Orange-red 7.5 0.4 7.9 0.5 389.4 0.0
19 Napier EGLO Yellow 5.6 0.2 5.4 0.2 388.4 0.1
20 Blombos EGLO Light grey 1.9 0.1 1.8 0.1 388.4 0.2
21 Napier EGLO Light red 3.3 0.4 3.5 0.4 389.6 0.0
22 Napier EGLO Maroon 3.2 0.4 3.4 0.4 389.6 0.3
23 De Hoop EGLO Dark red 2.6 0.1 2.7 0.1 389.5 0.2
24 Cape Point EGLO Orange-red 4.6 0.3 5.2 0.3 389.7 0.1
EGO: ground by Ovahimba; GQS: Experimentally ground onto quartzite slab; EGLO: Experimentally ground (like Ovahimba)
Table 8. SPF ratings of ochre samples 1, 5, 7, 10, 16 and 18, mixed with clarified butter, and obtained byin vivoassessment on three test subjects (A, B and C).
Subject Skin type Sample Source Colour Processing SPF
1 Okamanga Dark red Ovahimba 7.9
II 5 Ovinjange Dark red Ovahimba 5.1
A 6–10 7 Opuwo Dark red Experimental 4.5
White 10 Opuwo Dark red Experimental 8.8
16 Napier Maroon Experimental 7.8
18 Cape Point Orange-red Experimental 10.0
1 Okamanga Dark red Ovahimba 7.0
II 5 Ovinjange Dark red Ovahimba 5.3
B 6–10 7 Opuwo Dark red Experimental 4.5
White 10 Opuwo Dark red Experimental 8.4
16 Napier Maroon Experimental 8.8
18 Cape Point Orange-red Experimental 10.4
1 Okamanga Dark red Ovahimba 7.7
II 5 Ovinjange Dark red Ovahimba 5.7
6–10 7 Opuwo Dark red Experimental 3.5
C White 10 Opuwo Dark red Experimental 9.6
16 Napier Maroon Experimental 9.6
18 Cape Point Orange-red Experimental 10.7
doi:10.1371/journal.pone.0136090.t008
Table 9. Pearson’s correlation table indicating the relationship between SPF values on the one hand and the granulometric, mineralogical and elemental composition of the pigment samples on the other hand.Data in bold emphasize prominent positive or negative correlations.
Methods Variables SPF UVAPF
Grain size D10 -0.71 -0.60
D25 -0.74 -0.66
D50 -0.51 -0.57
D75 -0.30 -0.40
D90 -0.29 -0.41
<2μm 0.72 0.76
XRD Goethite 0.74 0.68
Hematite 0.74 0.63
Quartz -0.51 -0.41
Illite/Muscovite -0.39 -0.39
Kaolinite -0.22 -0.12
Goethite/Hematite 0.76 0.66
Quartz/Feldspar -0.52 -0.45
Clays -0.47 -0.42
XRF SiO2(%) -0.72 -0.62
Fe2O3(%) 0.75 0.66
MnO (%) -0.25 -0.13
K2O (%) -0.30 -0.18
CaO (%) -0.62 -0.47
TiO2(%) -0.07 -0.09
V2O3(%) 0.63 0.57
appear to influence thein vitroSPF values, although this element is known for its photoprotec-tive capacity [142,144]. This may be due to its low concentration within the analysed samples (<2%). Finally, the colorimetric properties of the samples are variably correlated with SPF
val-ues (Fig 6A and 6B). SPF is negatively correlated with lightness (L) and positively correlated
with increasing a(red) and bvalues. Samples with the brightest red hues, reflecting
substan-tial hematite content, consistently display the highest SPF values. Goethite-rich yellow samples, and samples that have been ground directly onto coarse stone surfaces, appear to provide increased protection from UVR. This also seems to correlate with intensified aand bvalues
and greater brightness, which results from this processing technique.
Iron oxide concentration and particle sizes elucidate most, but not all, of the variations observed in SPF and UVAPF values obtained byin vitroexperiments. In many instances, other minerals appear to also influence the photoprotective efficacy of powdered ochre. A case in point involves the sample from Napier (13 and 19) which present higher SPF values than sam-ples with similar particle size distribution (15 and 16 and 21 and 22). They differ from the latter examples in terms of higher clay mineral content, lower quartz concentration and the predomi-nance of goethite as opposed to hematite. This suggests that variations in mineral composition do influence the overall photoprotective capacity of ochre. Sample 16 presents a similar particle size distribution and fall within the same range of Fe2O3content than most Bokkeveld ochre samples processed experimentally using the direct method (sample 15). Nevertheless, this sam-ple exhibits a significantly higher SPF value, which could be explained in terms of the higher concentration of kaolinite present. Whereas directly ground Ovahimba samples (7 to 10) exhibit similar particle size distribution (Fig 5A) and minor variations in mineral composition, they exhibit a surprisingly broad range of SPF values. Other variables, such as iron oxide/oxy-hydroxide crystal size and shape may also play a role in SPF value. It has been shown that crys-tal shape influences the optical properties of Fe oxides [150], and it is therefore predictable that it also affects the photoprotective properties of Fe-rich ochres.
Discussion and Conclusion
Our experiments demonstrate that red ochre holds significant photoprotective capacities under bothin vitroandin vivoconditions. High iron oxide content and smaller grain sizes
correlate with greater photoprotective capacity (SPF). Results also confirm that it is not essen-tial to combine powdered ochre with an organic binder to achieve optimal UVA and UVB pro-tection. The use of binders may nevertheless be advantageous in terms of fixing ochre particles to the skin surface and therefore extending the duration of protection. The high photoprotec-tive effect of the single yellow ochre sample was unexpected. Samples from the same location (Napier) present variable photoprotective (SPF) values which does not fit the general pattern we observe for the other samples [100,142,144]. Because this represents a minor proportion of the analysed instances, our discussion will focus on the broader results which suggest that the finer the ochre powder and the higher its hematite content the higher the photoprotective effect.
Although the influence of regional availability on ochre procurement strategies has been highlighted by Watts (2002) [114] and Dayet et al. (2013) [123], it is clear that MSA and LSA people deliberately selected ochre depending on its properties, and not only on its ease of acquisition. Colourimetric properties appear to have also been significant in terms of LSA and MSA ochre selection strategies. Several MSA specimens exhibit what may represent traces of streak-testing [133,151], suggesting that ochre was consciously selected according to specific criteria. At Klasies River in South Africa, dark red ochre with unique colourimetric and miner-alogical properties and therefore different from samples that were ground to extract powder, was selected for engraving purposes at 100 ka [135]. At 90 ka at Qafzeh Cave in Israel, local ochre sources were ignored in favour of more remote, but finer-grained, red sedimentary shales some 60 km from the site [152]. At 65 ka at Diepkloof Rock Shelter, and even though red ochre occurs inside the shelter, ochre from sources more than 20 km away from the site were prefer-entially processed [123].
Because the colour of ochre is generally indicative of elemental content and mineral compo-sition [150], colour may have been a key criterion for ochre selection, depending on the intended purpose or applications in mind. At 100 ka, the Mousterian and Middle Palaeolithic inhabitants of the Es-Skhul (Israel) collected yellow goethite-rich ochre from 80 km away. These specimens were subsequently heated to induce colour transformations to red [153]. Based on our experimental results, one should, in addition to yellow examples, therefore expect to find substantial amounts of dark red shale-derived ochres in southern African MSA con-texts. Ochre with a strong red hue does in fact appear to predominate in MSA contexts from 130 ka [114,115,133]. But colour-based selection does not necessarily imply a preference based on aesthetic or symbolic considerations. In addition to colour, ochre may have been selected for other physical and chemical characteristics such as grain size, processability and surface covering capacity. Cultural reasons, such as symbolic connotations to particular geolog-ical resources, may have also played a role. The widespread preference for and use of Ombum-buu red ochre, amongst the Ovahimba, suggest that colour-independent properties may also play an important role in the selection and preference of red ochre from this source.
ka to 95 ka, respectively [159], appears to both precede and coincide with the increasing preva-lence of red ochre exploitation at Blombos Cave and at Klasies River Cave 1 after 120 ka [117, 133,135]. Increased cosmogenic nuclide deposition rates, indicated by long lasting relative paleointensity records associated with full geomagnetic polarity reversals, are confirmed for both the Blake and the post-Blake events [159]. There is currently limited evidence for increas-ing or declinincreas-ing ochre exploitation followincreas-ing the Laschamp excursion after 40 ka. This is because we have very little information concerning the amounts and types of ochre exploited in southern Africa between 40 ka and 20 ka [160]. It is therefore difficult to assess the relation-ship, if any, between the suite of adaptations recorded before 60 ka and those that emerged with the LSA. Although a linear relationship between ochre frequency and insolation cannot be demonstrated at this point, the initial large-scale exploitation of red ochre does seem to coincide with the Blake excursion event after 120 ka. However, and in order to determine the exact time period in which the use of ochre was uniquely due to a cultural adaptation against insolation, one should probably consider much earlier periods, perhaps from 300 ka or more. The precise motivation for this increasing focus on red ochre is unclear. It might represent both an expansion and an exaptation of various former functions fulfilled by this material. Sig-nificantly, recent evidence derived from Sibudu Cave [161] indicate that a mixture of red ochre and casein from milk, possibly obtained from hunted lactating wild bovids, was produced by the inhabitants at 49 ka. This liquid mixture, consisting of powdered red ochre and milk, was in all probability used as a paint-like medium that could have been applied to human skin.
phenomenon at a stage when the various symbolic functions of ochre were not yet in place. While it is difficult to establish a precise scenario for the emergence of such an innovation, one could envision a situation in which the habitual use of red ochre as a sunscreen may have origi-nally arisen locally, perhaps in response to changing UVR exposure rates produced by orbital climatic cycles, and subsequently provided an adaptive advantage for migrating populations. It is likely that the use of ochre as a sunscreen emerged repeatedly and that this innovation peri-odically vanished and reoccurred, a hypothesis consistent with the chronological and geo-graphic discontinuity in ochre occurrences during this time span. We do not know, at present, whether such applications may have facilitated the latitudinal displacement of populations and whether it coincided with symbolic connotations. It can, however, be argued that the increase in ochre use corresponding to the beginning of the last interglacial in all probability reflects a gradual, albeit significant, change of magnitude in the role of ochre in human culture, which has not come to an end since it emerged [139].
Combined with experimental replication and multi-proxy analyses, ethnographic examples of red ochre exploitation enabled the identification of noteworthy ancestral functions, while also revealing the extraordinary degree of social complexity that it has contributed to since its initial exploitation. Although the transition in archaeology from data to social interpretation is challenging, the importance of ochre exploitation during the MSA can only be expressed in terms of complex multi-functional explanations. This is so because the advantages offered by the habitual exploitation of ochre during the evolution ofHomo sapienswere numerous. Although exclusively functional uses of ochre are rare, it can be argued that they may have been more common in the past and that the use of ochre for symbolic purposes in ethno-graphic contexts does not imply similar use by early MSA humans. Ochre could also have func-tioned symbolically before the emergence of anatomically modernHomo sapiensafter 195 ka [164]), but it may in fact have had several functional uses early on which subsequently evolved to comprise both symbolic significance and functional value. The hypothesized and confirmed functional applications of red ochre should not therefore be viewed as in contradiction with a symbolic use of ochre, but instead as indicative of the possible exploitation and extensive appli-cation of a raw material with remarkable colourimetric, structural and chemical properties dur-ing the MSA.
Acknowledgments
We thank the Ovahimba participants, in particular Nakara, Mokadera, Bendokarampi and Tharhirwa (Otjongoro, Ovinjange and Oukongo villages) for sharing their knowledge with us. We thank the Namibian Ministry of Culture, the director of the National Museum of Namibia (Ester Moombolah-Goagoses), Eugene Marais (National Museum of Namibia) and Luc Fabre (French Embassy in Namibia) for supporting our research. Anzel Veldman (National Museum of Namibia) and Sennobia Katjiuongua (National Heritage Council of Namibia) are thanked for their support in the field. Renata Garcia Moreno Mazel (CNRS UMR PACEA, University of Bordeaux) is thanked for preliminary analyses.
Author Contributions
References
1. Blome MW, Cohen AS, Tryon CA, Brooks AS, Russell J (2012) The environmental context for the ori-gins of modern human diversity: A synthesis of regional variability in African climate 150,000–30,000
years ago. J Hum Evol 62 (5): 563–592. doi:10.1016/j.jhevol.2012.01.011PMID:22513381 2. Nyman T, Linder HP, Pen C, Malm T, Wahlberg N (2012) Climate-driven diversity dynamics in plants
and plant-feeding Insects. Ecol Lett 14: 1–10.
3. Condamine FL, Rolland J, Morlon H (2013) Macroevolutionary perspectives to environmental change. Ecol Lett 16: 72–85.
4. Ziegler M, Simon MH, Hall IR, Barker S, Stringer C, Zahn R (2013) Development of Middle Stone Age innovation linked to rapid climate change. Nat Commun 4 (1905): doi:10.1038/ncomms2897 5. Paul ND, Gwynn-Jones D (2003) Ecological roles of solar UV radiation: Towards an integrated
approach. Trends Ecol Evol 18 (1): 48–55.
6. Lautenschlager S, Wulf HC, Pittelkow MR (2007) Photoprotection. Lancet 370: 528–537. PMID: 17693182
7. Gasparro FP (2000) Sunscreens, skin photobiology and skin cancer: The need for UVA protection and evaluation of efficacy. Environ Health Perspect 108 (1): 71–78.
8. Moan J, Porojnicu AC, Dahlback A, Setlow RB (2007) Addressing the health benefits and risks, involv-ing vitamin D or skin cancer, of increased sun exposure. Proc Natl Acad Sci U S A 105 (2): 668–673. 9. Reichrath J (2007) Vitamin D and the skin: An ancient friend, revisited. Exp Dermatol 16: 618–625.
PMID:17576242
10. Yuen AWC, Jablonski NG (2010) Vitamin D: In the evolution of human skin colour. Med Hypotheses 74: 39–44. doi:10.1016/j.mehy.2009.08.007PMID:19717244
11. Reichrath J (2006) The challenge resulting from positive and negative effects of sunlight: How much solar UV exposure is appropriate to balance between risks of vitamin D deficiency and skin cancer? Prog Biophys Mol Biol 92: 9–16. PMID:16603232
12. Juzeniene A, Setlow R, Porojnicu A, Hykkerud Steindal A, Moan J (2009) Development of different human skin colours: A review highlighting photobiological and photobiophysical aspects. J Photo-chem Photobiol B B: Biology 96: 93–100. doi:10.1016/j.jphotobiol.2009.04.009PMID:19481954
13. Shoenfeld N, Amital H, Shoenfield Y (2009) The effect of melanism and vitamin D synthesis on the incidence of autoimmune disease. Nat Clin Pract Rheumatol 5 (2): 99–105. doi:10.1038/ ncprheum0989PMID:19182816
14. Wright CY, Norval M, Summers B, Davids L, Coetzee G, Oriowo MO (2012) The impact of solar ultra-violet radiation on human health in sub-Saharan Africa. South Afr J Sci 108 (11–12): 1–6.
15. Biniek K, Levi K, Dauskardt RH (2012) Solar UV radiation reduces the barrier function of human skin. Proc Natl Acad Sci U S A 109 (42): 17111–17116. doi:10.1073/pnas.1206851109PMID:23027968 16. Krishnan KJ, Harbottle A, Birch-Machin MA (2004) The use of a 3895 bp mitochondrial DNA deletion
as a marker for sunlight exposure in human skin. J Investig Dermatol 123: 1020–1024. PMID: 15610508
17. Kadekaro AL, Kavanagh R, Kanto H, Terzieva S, Hauser J, Kobayashi N, et al. (2005)α-Melanocortin
and endothelin-1 activate antiapoptotic pathways and reduce DNA damage in human melanocytes. Cancer Res 65 (10): 4292–4299. PMID:15899821
18. Gendron SP, Bastien N, Mallet JD, Rochette PJ (2013) The 3895-bp mitochondrial DNA deletion in the human eye: a potential involvement in corneal ageing and macular degeneration. Mutagen 28 (2): 197–204.
19. Chen TC, Lu Z, Holick MF (2010) Photobiology of vitamin D. Holick, Springer NY.
20. Ullrich SE, Kripke ML, Ananthaswamy HN (2002) Mechanisms underlying UV-induced immune sup-pression: Implications for sunscreen design. Exp Dermatol 11 (1): 1–4.
21. Knudsen MF, Riisager P, Donadini F, Snowball I, Muscheler R, Korhonen K, et al. (2008) Variations in the geomagnetic dipole moment during the Holocene and the past 50 kyr. Earth Planet Sci Lett 272 (1–2): 319–329.
22. Faith JT, Surovell TA (2009) Synchronous extinction of North America’s Pleistocene mammals. Proc
Natl Acad Sci U S A 106 (49): 20641–20645. doi:10.1073/pnas.0908153106PMID:19934040 23. LaViolette PA (2011) Evidence for a solar flare cause of the Pleistocene mass extinction Radiocarbon
53 (2): 303–323.
25. Grove M (2012) Amplitudes of orbitally induced climatic cycles and patterns of hominin speciation. J Archaeol Sci 39: 3085–3094.
26. Laj C, Channell JET (2008) Geomagnetic excursions. Kono, Elsevier, Amsterdam.
27. Thouveny N, Carcaillet J, Moreno E, Leduc G, Nérini D (2004) Geomagnetic moment variation and palaeomagnetic excursions since 400 kyr BP: A stacked record from sedimentary sequences of the Portuguese margin. Earth Planet Sci Lett 219: 377–396.
28. Bourne M, Niocaill CM, Thomas AL, Knudsen MF, Henderson GM (2012) Rapid directional changes associated with a 6.5 kyr-long Blake geomagnetic excursion at the Blake-Bahama Outer Ridge. Earth Planet Sci Lett 333–334: 21–34.
29. Osete M, Martın-Chivelet J, Rossi C, Edwards RL, Egli R, Muñoz-García MB, et al. (2012) The Blake
geomagnetic excursion recorded in a radiometrically dated speleothem. Earth Planet Sci Lett 353–
354: 173–181.
30. Guillou H, Singer BS, Laj C, Kissel C, Scaillet S, Jicha BR (2004) On the age of the Laschamp geo-magnetic excursion. Earth Planet Sci Lett 227: 331–343.
31. Plenier G, Valet J-P, Guérin G, Lefèvre JC, Carter-Stiglitz B (2007) Origin and age of the directions
recorded during the Laschamp event in the Chaîne des Puys (France). Earth Planet Sci Lett 259: 414–431.
32. Finlayson C, Carrión JS (2007) Rapid ecological turnover and its impact on Neanderthal and other human populations. Trends Ecol Evol 22 (4): 213–222. PMID:17300854
33. Banks WE, d'Errico F, Peterson AT, Kageyama M, Sima A, Sánchez-Goñi M-F (2008) Neanderthal
extinction by competitive exclusion. PLOS ONE doi:10.1371/journal.pone.0003972
34. Gilligan I (2008) Neanderthal extinction and modern human behaviour: The role of climate change and clothing. World Archaeology 39 (4): 499–514.
35. Dennell RW, Martinón-Torres M, Bermúdez de Castro JM (2011) Hominin variability, climatic instabil-ity and population demography in Middle Pleistocene Europe Quaternary Science Reviews 30: 1511–1524.
36. Mellars P, French JC (2011) Tenfold population increase in Western Europe at the Neanderthal-to-modern human transition. Science 333: 623–627. doi:10.1126/science.1206930PMID:21798948
37. Müller UC, Pross J, Tzedakis PC, Gamble C, Kotthoff U, Schmiedl G, et al. (2011) The role of climate in the spread of modern humans into Europe. Quat Sci Rev 30: 273–279.
38. Sørensen B (2011) Demography and the extinction of European Neanderthals. J Anthropol Archaeol
30: 17–29.
39. Discamps E (2013) Ungulate biomass fluctuations endured by Middle and Early Upper Paleolithic societies (SW France, MIS 5–3): The contributions of modern analogs and cave hyena paleodemo-graphy. Quat Int 337: 64–79.
40. Lalueza-Fox C, Römpler H, Caramelli D, Stäubert C, Catalano G, Hughes D, et al. (2007) A melano-cortin 1 receptor allele suggests varying pigmentation among Neanderthals. Science 318: 1453–
1455. PMID:17962522
41. Robinson KC, Fisher DE (2009) Specification and loss of melanocyte stem cells. Semin Cell Dev Biol 20: 111–116. doi:10.1016/j.semcdb.2008.11.016PMID:19124082
42. Mitra D, Luo X, Morgan A, Wang J, Hoang MP, Lo J, et al. (2012) An ultraviolet-radiation-independent pathway to melanoma carcinogenesis in the red hair/fair skin background. Nature 15 (7424):449–
453.
43. Cerqueira CC, Pãixa-Côrtes VR, Zambra FM, Salzano FM, Hünemeier T, Bortolini C (2012) Predicting Homopigmentation phenotype through genomic data: From Neanderthal to James Watson. Am J
Hum Biol 24: 705–709. doi:10.1002/ajhb.22263PMID:22411106
44. Meyer M, Kircher M, Gansauge M, Li H, Racimo F, Mallick S, et al. (2012) A high coverage genome sequence from an archaic Denisovan individual. Science 338 (6104): 222–226. doi:10.1126/science.
1224344PMID:22936568
45. Ménabréaz L, Thouveny N, Bourlès DL, Deschamps P, Hamelin B, Demory F (2011) The Laschamp
geomagnetic dipole low expressed as a cosmogenic 10Be atmospheric overproduction at ~ 41 ka. Earth Planet Sci Lett 31 (4–5): 305–317.
46. Nowaczyk NR, Arz HW, Frank U, Kind J, Plessen B (2012) Dynamics of the Laschamp geomagnetic excursion from Black Sea sediments. Earth Planet Sci Lett 351–352: 54–69.
![Table 1. The classification of human skin types pertaining to responses to UVR exposure [70 – 75]](https://thumb-eu.123doks.com/thumbv2/123dok_br/18324687.350163/4.918.53.868.162.432/table-classification-human-skin-types-pertaining-responses-exposure.webp)