Body size of Chrysomelidae (Coleoptera, Insecta)
in areas with different levels of conservation
in South Brazil
Adelita M. Linzmeier1, Cibele S. Ribeiro-Costa1
1 Laboratório de Sistemática e Bioecologia de Coleoptera (Insecta), Departamento de Zoologia, Universidade Federal do Paraná, Caixa Postal 19020, 81531–980 Curitiba-PR, Brazil. Fellowships CNPq.
Corresponding author:Adelita M. Linzmeier ([email protected])
Academic editor:Michael Schmitt | Received 14 February 2011 | Accepted 2 May 2011 | Published 21 December 2011
Citation: Linzmeier AM, Ribeiro-Costa CS (2011) Body size of Chrysomelidae (Coleoptera, Insecta) in areas with diferent levels of conservation in South Brazil. In: Jolivet P, Santiago-Blay J, Schmitt M (Eds) Research on Chrysomelidae 3. ZooKeys 157: 1–14. doi: 10.3897/zookeys.157.1083
Abstract
Body size is correlated with many species traits such as morphology, physiology, life history and abun-dance as well; it is one of the most discussed topics in macroecological studies. he aim of this paper was to analyze the body size distribution of Chrysomelidae, caught with Malaise traps during two years in four areas with diferent levels of conservation in the Araucaria Forest, Paraná, Brazil, determining if body size is a good predictor of abundance, and if body size could be used to indicate environmental quality. Body size was considered the total length of the specimen from the anterior region of head to the apex of abdomen/elytron. Measurements were taken for up to ten specimens of each species for each area and for all specimens of those species represented by fewer than ten individuals. he highest abundance and richness of Chrysomelidae were obtained in the lowest body size classes. his herbivorous group showed a trend toward a decrease in body size with increasing abundance, but body size was not a good predictor of its abundance. here was a trend toward a decrease in body size from the less to the most conserved areas; however, the deinition of a pattern in successional areas not seems to be entirely clear.
Keywords
Abundance, biodiversity, body length, macroecology, Neotropical region, richness
www.zookeys.org
Copyright AM Linzmeier, CS Ribeiro-Costa. This is an open access article distributed under the terms of the Creative Commons Attribution License
3.0 (CC-BY), which permits unrestricted use, distribution, and reproduction in any medium, provided the original author and source are credited.
Introduction
Potential ecological relationships between body size and structure of animal communi-ties have been one of main focuses in ecological studies (Braun et al.2004). Body size is correlated with many morphologic, physiologic, behavioral and ecologic traits, such as dispersal capacity, metabolic and digestive eiciency, reproduction rate, and genera-tion time, as well as species abundance (Siemann et al.1999, Brown 2003, White et al. 2007). In macroecological studies, the relationship between body size and abundance is one of the most studied topics, and reports mainly concern vertebrates (Krüger and McGavin 2000).
he relationship between body size and abundance is an essential link between individual and population level traits and the structure and dynamics of ecological communities (Woodward et al.2005). According to White et al. (2007), there are four distinct, but interrelated, relationships between body size and abundance, which are generated by diferent combinations of processes and routinely confused. he relation-ships are: i) local size-density relationrelation-ships which relect processes inluencing resource allocation among species; ii) individual size distributions which result from processes governing the distribution of individual sizes; iii) cross-community scaling relation-ships which are generated by general constraints, such as resource limitation, on the community as a whole; and iv) global size-density relationships which relect ecological and evolutionary processes on large spatio-temporal scales.
Controversy has arisen regarding how body size and abundance are related, and concerning the ecological and evolutionary implications of these relationships. In this way, an early step in elucidating the factors that structure animal assemblages may be to understand how the body sizes of their component species are distributed (Black-burn and Gaston 1994, 1997). Hutchinson and MacArthur (1959) suggested that within a taxon there are more species of intermediate size than very large or very small ones, because they would be relatively more specialized and would utilize their re-sources better, since they would have a larger number of niches available. Following the energetic equivalence rule (EER) proposed by Damuth (1981, 1991) the amount of energy that a population of a species uses in the community is independent of its body size. Damuth (1981) found a slope of -0.75 for the relationship between population density and body size, and since body size scales with metabolic rate to the 0.75 power, the population density would compensate for the body size.
spe-cies would be beneited in initial stages of succession while the small and specialized ones would be beneited in inal stages of succession. In this way changes in species body size over the succession could be another important indicator of environmental changes and quality.
Phytophages represent about 45% of all described insect species (Frenzel and Brän-dle 2001). Among them, Chrysomelidae is one of the most diverse groups with more than 36,000 described species (Bouchard et al. 2009) and its body size has never been the focus of study. hus, the irst aim of this paper was to analyze the relationship be-tween body size and abundance and bebe-tween body size and richness in a Chrysomeli-dae community, to determine how these variables are related. Two applicable relation-ships proposed by White et al. (2007) were tested: the individual size distributions, regardless of the identity of species, and the local size-density relationships, since cross-community scaling relationships are more often used in studies of sessile communities and global size-density relationships needs, where data are generally on a wide geo-graphic scale and from a larger number of groups. he second aim was to determine if there are diferences in body size between areas at diferent levels of succession and if so how great.
Material and methods
he data came from the project Vila Velha (PROVIVE), which was developed in the Parque Estadual of Vila Velha (25°13'5.0"S; 50°2'26.9"W).his park is a conservation unit in the state of Paraná with an area of 3.122 ha, mainly covered by natural ields (steppe, grassy-woody) (Ziller2000) associated with the Araucaria Forest at diferent levels of anthropic interference. he park is located in Ponta Grossa at an altitude of 880 m.
Of the ive areas sampled during the PROVIVE project, the material from four areas was used in this study, one edge area and three with increasing conservation level. A brief description of these areas is as follows. More information could be found in Ganho and Marinoni (2003): a) Border, an edge area of transition between ield and Araucaria Forest in intermediate stage of succession, maintained by mowing; b) Phase 1, area of about 15 ha, previously used for seasonal crops such as corn and beans, in natural regeneration since 1984. It was at an initial to intermediate level of succession; c) Phase 2, primary forest, changed by the removal of various plant species such as
Araucaria angustifolia (Bert.) O. Ktze (Araucariaceae), Ocotea porosa (Nees & C. Mart.) Barroso (Lauraceae) and some Myrtaceae. Plant succession is at an intermediate to advanced stage; d) Phase 3, primary forest changed by selective cutting. It is the best preserved of all, showing a very similar lora to Phase 2 area, but with higher density of araucarias, epiphytes and lianas.
from ground to 2m high and, because of the sampling efort, it was assumed that this trap sampled all species that occur in each sampling area.
he Coleoptera were mounted, labeled, and the chrysomelids identiied to the low-est taxonomic level possible. he material is deposited in the Coleção de Entomologia Pe. J. S. Moure, Departamento de Zoologia, Universidade Federal do Paraná (DZUP).
All Chrysomelidae species sampled in each area were measured. he size was con-sidered the total length of the specimen from the anterior region of the head (excluding antennae) to the apex of the abdomen or elytra (Morse et al. 1988). herefore, the head (superior margin of eyes to the apical margin of labrum, in frontal view), the pronotum (in central region) and elytra/abdomen (sutural margin, in dorsal view) were measured separately. hese three measures were summed, resulting in the length of each speci-men. Measurements were made with a Wild-M5 stereomicroscope using an adjusted ocular micrometer.
According to Morse et al. (1988), the length of most beetle species varies little; the diference between the largest and the smallest specimen does not exceed 10%. hus, following the methodology proposed by these authors, measurements were taken from a maximum of ten specimens of each species for each area or all specimens for those species represented by fewer than ten individuals.
he length values were grouped in arbitrarily established size classes (class 1: 1.0 to 2.99 mm, class 2: 3.0 to 4.99 mm, class 3: 5.0 to 6.99 mm and so on) and adjusted on a logarithmic scale, following Morse et al. (1988). his was done for all Chrysomelidae data and for each examined area separately. To determine the distribution of abun-dance of individuals, the identity of species was not taken into account, so one species may have individuals of more than one size class. he average size of each species was used to treat the distribution of species.
Correlation analyses were performed between size classes and abundance and, be-tween size classes and richness.
A regression analysis was performed to determine the inluence of body size on the abundance of Chrysomelidae. he dependent variable was the abundance of each species and the independent variable its average size. he slope obtained was visually compared to that proposed by Damuth (1981). his analysis was performed for each area separately and subsequent for all areas combined.
To examine if there were diferences in body size of the Chrysomelidae community in each area, ANOVA (5% signiicance) was performed based on all measured values. his analysis was also used only for those species recorded in all areas.In addition, ANOVA was used to determine if the size of species varied in areas with diferent suc-cession levels. For this, species that occurred at least in two areas and that had at least six specimens sampled were selected. Each species was analyzed separately, totaling 15 species that met these prerequisites.
Results
During the two years 2,650 specimens of 254 Chrysomelidae species were sampled and, 1,217 specimens were measured (Table 1).
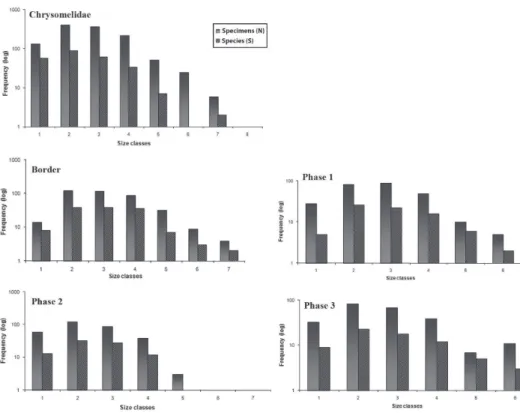
he Chrysomelidae size class histogram showed a tendency toward a decrease in abundance with increase in body size (Fig. 1), where the pattern of Chrysomelidae dis-tribution of abundance was a polygonal type with a tail to the right. he same pattern was observed for the richness distribution. he highest frequencies of both abundances and richness were in class 2, with chrysomelids measuring from 3.0 to 4.99 mm.
he distribution of abundance in each area also showed a tendency toward a de-crease in abundance with increasing body size, with the highest frequencies in class 2. However, in Phase 1 a higher abundance of Chrysomelidae was in class 3, from 5.0 to 6.99 mm and, in Phase 3, unlike the other, showed the highest abundance in class 6, from 11.0 to 12.99 mm (Fig. 1).
Regarding species richness, this followed the distribution pattern of abundance, with the largest number of species occurring in smaller size classes. Border area had the same number of species in classes 2 and 3. Notice that class 6 to all Chrysomelidae and class 5 of Phase 2 (Fig. 1) there are no values of richness. It happened because there are no species that it in these size classes, i.e., the average species size itted in other size class. However, as the specimens have a range of size, some values itted in diferent size classes.
table 1. Body size (mm) (mean ± SD) of the Chrysomelidae community, trapped with Malaise in four areas with diferent conservation levels, in Ponta Grossa, Paraná, Brazil. Values followed by the same letter
do not difer signiicantly (P < 0.05). (n) number of specimens measured, (S) richness and (N) abundance.
Body size n S N
Border 6.23 ± 2.42a 391 134 484
Phase 1 5.63 ± 2.86b 267 78 742
Phase 2 4.75 ± 1.94c 317 88 1010
Phase 3 5.38 ± 2.50b 242 70 414
Total - 1,217 254 2,650
table 2. Correlation between size class and abundance (N) and between size class and richness (S) of Chrysomelidae trapped with Malaise in four areas with diferent conservation levels, in Ponta Grossa,
Paraná, Brazil. Values followed by * showed signiicant correlation (P < 0.05).
Areas N S
Border -0,47 -0,49
Phase 1 -0,70* -0,67*
Phase 2 -0,67* -0,64*
In all areas, there was a negative correlation between body size and abundance and between body size and richness, but only in Phase 1 and Phase 2 these correlations were signiicant (Table 2).
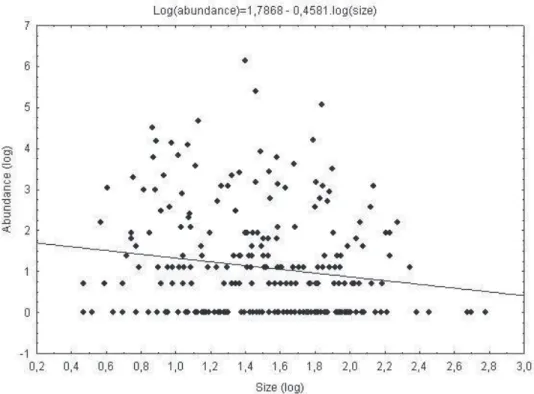
Studying the inluence of body size on abundance, it was possible to show that the model was signiicant (b = -0.46, r = 0.16, P < 0.01) only when data from all areas are included (Fig. 2). Even so, body size explained only 2.56% of Chrysomelidae abun-dance. Moreover, the slope was -0.46.
he Border area, which is an ecotone between a ield and Araucaria Forest and which is inluenced more by human activity, was the place where the species reached the highest body sizes, 6.23 mm on average, and it was the only area with size class 7, with chrysomelids measuring from 13.0 to 15.0 mm. In this same area was sampled the higher number of species. In contrast, Phase 2 which is an intermediate stage of conservation, showed the smallest size, 4.75 mm on average, with the maximum size occurring in class 5 and, where was registered the higher abundance. he lowest rich-ness as well as the lowest abundance was in Phase 3 (Table 1).
did not difer signiicantly from that of Phase 1. here was no diference in body size of the Chrysomelidae community when only the species common to all areas were analyzed.
While determining if species common to at least two of the studied areas showed variation in body size, it was found that of the 15 species examined, eight had an increase in body size from an area less conserved to one better conserved, but for only two of them, Trichaltica elegantula Baly, 1876 and Hispini sp.9, this increase was signiicant. Four species showed a decrease in body size from an area less conserved to a better conserved, but this diference was not signiicant in any of the cases. Acantho-nycha costatipennis Jacoby, 1905 and Eumolpinae sp.1 showed a signiicant increase in body size from the edge area to an area of intermediate level of conservation, followed by a signiicant decrease in size in the most conserved area, Phase 3, regarding to com-pared to the edge (Table 3).
Discussion
(Fig. 1). his value was very near to that found for Chrysomelidae fauna by diferent authors using diferent collecting methods and in diferent habitats. Basset and Samu-elson (1996), in studying the arboreal community in Papua New Guinea using several collecting methods, recorded the majority of species ranging from 2.8 to 3.3 mm. Pinheiro et al. (1998) who carried out their study in the Brazilian savanna using nets, found the highest frequencies at the same body size class interval as observed here. hese authors also recorded a negative correlation between body size and abundance and between body size and richness for Coleoptera, similar to the results obtained here for the Chrysomelidae.
According to Blackburn and Gaston (1997) there are three diferent species distri-bution patterns, linear negative, non-linear negative and polygonal. he Chrysomel-idae exhibited a polygonal distribution of abundance. Similar results were obtained by Krüger and McGavin (2000), analyzing a local community of insects collected from Acacia. hey also found a negative relationship between size and abundance as in this paper.
In fact, according to Blackburn and Gaston (1997), distribution patterns of abundance are strongly inluenced by the scale of study. Polygonal relations are usu-ally obtained when unique areas are sampled trying to estimate the abundance of all species of a taxon that occur there, usually using a single and consistent method. In contrast, a negative linear relationship is obtained from compiled data from a great variety of published papers, which generally deal with one or a few species that oc-cupy large geographic areas and whose density is estimated using a wide range of methods. hese patterns, according to the authors, are not mutually exclusive and table 3. Body size (mm) (mean ± SD) of Chrysomelidae species common to at least two of the four areas with diferent levels of conservation and which have at least six specimens collected in Ponta Grossa,
Paraná, Brazil. Averages followed by the same letter in line do not difer signiicantly (P < 0.05).
Border Phase 1 Phase 2 Phase 3
Acanthonycha chloroptera 5,19±0,80a 5,65±0,46a
Acanthonychacostatipennis 4,96±0,72a 5,84±0,28b 5,07±0,59b
Dinaltica gigia 5,15±0,31a 4,89±0,29a
Heikertingerella ferruginea 3,74±0,36a 3,68±0,21a 3,78±0,16a
Monoplatus ocularis 3,92±0,25a 3,82±0,22a 3,72±0,14a
Neothona prima 2,20±0,13a 2,33±0,11a
Omophoita octoguttata 10,11±0,77a 10,41±0,62a
Phyllotrupes violaceomaculatus 7,80±0,52a 7,96±0,64a
Trichalticaelegantula 2,40±0,18a 2,65±0,15b
Hispini sp.7 6,90±0,44a 7,04±0,41a
Hispini sp.9 5,97±0,30a 6,25±0,19b
Eumolpinae sp.1 5,00±0,40a 5,80±0,31b 5,47±0,25b
Eumolpinae sp.6 4,88±0,33a 5,05±0,40a
Eumolpinae sp.14 8,29±0,52a 8,22±0,53a
may indicate a clear relationship between abundance and body size at diferent spa-tial scales.
According to Morse et al. (1985), an inverse relationship between size and abun-dance, especially for herbivorous insects, would be linked to the fractal structure of plants. he fractal theory predicts that area or length becomes disproportionately large with a decrease in the unit of measure. hus, the consequence of the fractal nature of the environment for the species body size distribution occurs due the existence of a more usable space for smaller animals, so species of smaller size should be more repre-sented in nature, as they could subdivide the habitat and coexist in greater numbers.
However, the fractal structure of environment cannot alone explain the shape of the size distribution, since the smallest size class is not always the most numerous, but this may be a mechanism that accounts for the shape of distribution (Kozlowski and Gawelczyk 2002). Although, the distribution pattern of Chrysomelidae abundance is in accordance with those found for other local insect communities, their explanation in terms of ecological processes involved is complex and cannot be summarized in a simple cause and efect relationship.
Size is a poor predictor of Chrysomelidae abundance. Other variables such as avail-ability and quality of food resources, presence of predators/parasitoids, intra- and in-terspeciic competition and climatic factors should have a greater inluence on the abundance of this group.
Several authors have found that body size is a poor predictor of population densi-ties on a local scale (Morse et al. 1988, Blackburn et al. 1993, Blackburn and Gas-ton 1997, White et al. 2007). Furthermore, data obtained here did not support the EER, indicating that larger species use the most available resources. Brown and Maurer (1986) also showed that the greater abundance of small-sized species is not suicient to compensate for their lower rates of energy use per individual.
It is important to stress that EER as calculated here is not recommended by White et al. (2007). According to these authors, data obtained on a local scale represent a small portion of data needed to test EER, and consequently, only the lower limits of species distribution would be included in the calculations. EER provides global pat-terns, which are not strictly ecological, but has an important evolutionary component. On the other hand, processes at local scales are more inluenced by the partition of resources within the community (Allen et al. 2006, White et al. 2007).
second richest value was found, the spectrum has no inluence since it was found the smallest size. Furthermore, we could not methodologically limit the number of species to eliminate some possible spectrum efect because it would change the composition of the local fauna and, although it seems to have a gradient relating the number of species with body size, the higher number of species alone does not explain the size found.
In the literature, there are diferent results, some of them show the same tendency as in this study, such as those of Siemann et al. (1999) andBraun et al. (2004). Sie-mann et al. (1999) studied the dynamic of arthropods in areas with diferent succes-sion stages and found that, among the analyzed guilds (parasites, predators, herbivores and detritivores), only the herbivores had a signiicant decrease in body size with in-crease in age of area. According to these authors, the explanation for decreasing body size of herbivores is the tradeof between eiciency and specialization.
here are environmental changes that could favor diferent species at diferent stages of succession. In early succession, plants have few defenses, high growth rates and low proportion of carbon and nitrogen in their tissues (Tilman 1990). As large animals have greater digestive and absorption eiciency due to larger guts, they may be able to overcome the small herbivores. In later succession, plants are less palatable, have lower growth rates and higher proportion of carbon and nitrogen in their tissues. Since smaller species may perceive greater levels of heterogeneity, small herbivoresmay be ablest to specialize on certain plants or parts of plants such as growing leaf tips or phloem cells, which have better nutritional quality, prevailing over the large and ef-icient herbivores (Siemann et al. 1999).
Braun et al. (2004) also found larger body sizes in less conserved areas, even working on a Coleoptera predator group. hey studied the Carabidae fauna of areas in regeneration after the closure of a fertilizer factory. According to them, before the factory closure, there were few herbivorous species, which were large and general-ists, and thus prey for large Carabidae. With the factory closure, there was a reduc-tion of local pollureduc-tion, allowing a recovery of vegetareduc-tion. hus, with the increase in primary production, there was an increase in immigration of herbivores expanding the food availability for carabids. Furthermore, the authors suggested that habitat structure must have also inluenced the Carabidae body size, interfering with forag-ing eiciency. Early stages of succession and more open areas favored large species which are more eicient at traveling over larger distances in a patchy environment compared to later stages with denser vegetation, where smaller and more agile spe-cies may be favored.
As these results conlict with those obtained here and mainly do not deal with her-bivorous insects but predators, it appears that the eiciency-specialization hypothesis proposed by Siemann et al. (1999) seems to be the most consistent explanation for the decrease in body size of Chrysomelidae in the most conserved areas, at least for this data set.
Among the 15 species examined, only four showed signiicant variations in body size among the diferent areas, and consequently, it was not possible to establish a con-sistent pattern between body size and level of conservation when species were analyzed separately. However, interesting information was obtained. Unlike what was deter-mined for the entire Chrysomelidae community where the edge area had the highest average body size, for three species that showed signiicant diferences in body size among areas (A. costatipennis, Hispini sp.9 and Eumolpinae sp.1), the Border was the area where these species had the smallest body size. hese species did not contribute to explaining the Chrysomelidae pattern, where it was not possible to know which species most inluenced the pattern.
Conclusions
he Chrysomelidae, an essentially phytophagous group, showed a trend toward a de-crease in abundance with increasing body size, in a negative polygonal relation. Fur-thermore, a greater number ofchrysomelid species collected by Malaise traps occurred in smaller body size classes; species ranged from 1.0 to 15.0 mm in length and most of them measured between 3.0 and 4.99 mm.
he results presented here seem to follow the pattern found for several animal groups, where body size is a poor predictor of abundance. Other factors such as avail-ability of food, metabolic eiciency, host plant speciicity and/or parts of the plant, predation, parasitism and climate should act more on the Chrysomelidae community determining the size of species populations.
It was demonstrated that there is a change in body size of Chrysomelidae com-munities in areas with diferent levels of conservation. here was a trend toward a decrease in body size of the less to the most conserved areas. he Border area, which is an ecotone and more inluenced by human activity, had larger chrysomelid body sizes. However, the deinition of a pattern in successional areas did not seem to be entirely clear, due to signiicant increase in body size of a later succession stage in relation to one of the others areas in an intermediate successional stage. Nevertheless, the results suggest that degrading the habitats, the small and specialized species would be at risk of disappearing.
Acknowledgments
We would like to thank Conselho Nacional de Desenvolvimento Cientíico e Tec-nológico, for the Doctoral Fellowship awarded to the irst author and the Research Fellowship to the second author. his research represents contribution Nº 1.834 from the Departamento de Zoologia, Universidade Federal do Paraná, Curitiba, Brazil. We are also grateful to Dr Luciano de Azevedo Moura for providing valuable suggestions and Dr A. Leyva for English editing of the manuscript.
References
Allen CR, Garmestani AS, Havlicek TD, Marquet PA, Peterson GD, Restrepo C (2006) Pat-terns in body mass distributions: shifting among alternative hypotesis. Ecology Letters9: 630–643. doi: 10.1111/j.1461-0248.2006.00902.x
Basset Y, Samuelson GA (1996) Ecological characteristics of an arboreal community of Chrysomelidae in Papua New Guinea. In: Jolivet P, Cox ML (Eds) Chrysomelidae Biol-ogy:EcologicalStudies. Academic Publishing, Amsterdam, he Netherlands, 243–262. Blackburn TM, Brown VK, Doube BM, Greenwood JJD, Lawton JH, Stork NE (1993) he
relationship between abundance and body size in natural animal assemblages. Journal of Animal Ecology 62: 519–528. doi: 10.2307/5201
Blackburn TM, Gaston KJ (1994) Animal body size distributions: patterns, mechanisms and implications. Trends in Ecology and Evolution 9: 471–474. doi: 10.1016/0169-5347(94)90311-5
Blackburn TM, Gaston KJ (1997) A critical assessment of the form of the interspeciic rela-tionship between abundance and body size in animals. Journal of Animal Ecology 66: 233–249. doi: 10.2307/6025
Blake S, Foster GN, Eyre MD, Luf ML (1994) Efects of habitat type and grassland manage-ment practices on the body size distribution of carabid beetles. Pedobiologia 38: 502–512. Bouchard P, Grebennikov VV, Smith ABT, Douglas H (2009) Biodiversity of Coleoptera. In:
Foottit RG, Adler PH (Eds) Insect biodiversity: science and society. Blackwell Publishing, Oxford, 265–301. doi: 10.1002/9781444308211.ch11
Brändle M, Durka W, Altmoos M (2000) Diversity of surface dwelling beetle assemblages in open-cast lignite mines in Central Germany. Biodiversity and Conservation9: 1297–1311. Braun SD, Jones TH, Perner J (2004) Shifting average body size during regeneration after
pollution - a case of study using ground beetle assemblages. Ecological Entomology 29: 543–554. doi: 10.1111/j.0307-6946.2004.00643.x
Brown JH (2003) Macroecología. Fondo de Cultura Económica, Mexico, 397p.
Brown JM, Maurer B (1986) Body size, ecological dominance and Cope’s rule. Nature324: 248–250. doi: 10.1038/324248a0
Damuth J (1981) Population density and body size in mammals. Nature290: 699–700. doi: 10.1038/290699a0
Frenzel M, Brändle R (2001) Hosts as habitats: faunal similarity of phytophagous in-sects between host plants. Ecological Entomology 26: 594–601. doi: 10.1046/j.1365--2311.2001.00355.x
Ganho NG, Marinoni RC (2003) Fauna de Coleoptera no Parque Estadual de Vila Velha, Ponta Grossa, Paraná, Brasil. Abundância e riqueza das famílias capturadas através de ar-madilhas armadilha Malaise. Revista Brasileira de Zoologia20: 727–736. doi: 10.1590/ S0101-81752003000400028
Gaucherel C, Burel F, Baudry J (2007) Multiscale and surface pattern analysis of the efect of landscape pattern on carabid beetles distribution. Ecological Indicators7: 598–609. doi: 10.1016/j.ecolind.2006.07.002
Hutchinson GE, MacArthur RH (1959) A theoretical ecological model of size distributions among species of animals. he American Naturalist93: 117–125. doi: 10.1086/282063 Kozlowski J, Gawelczyk AT (2002) Why are species’ body size distributions usually skewed
to the right? Functional Ecology16: 419–432. doi: 10.1046/j.1365-2435.2002.00646.x Krüger O, McGavin GC (2000) Macroecology of local insect communities. Acta Oecologica
21: 21–28. doi: 10.1016/S1146-609X(00)00112-0
Linzmeier AM, Ribeiro-Costa CS (2009) Spatio-temporal dynamics of Alticini (Coleoptera, Chrysomelidae) in a fragment of Araucaria Forest in the state of Parana, Brazil. Revista Brasileira de Entomologia 53: 294–299. doi: 10.1590/S0085-56262009000200013 Linzmeier AM, Ribeiro-Costa CS, Marinoni RC (2006) Fauna de Alticini (Newman)
(Cole-optera, Chrysomelidae, Galerucinae) em diferentes estágios sucessionais na Floresta com Araucária do Paraná, Brasil: diversidade e estimativa de riqueza de espécies. Revista Bra-sileira de Entomologia50: 101–109. doi: 10.1590/S0085-56262006000100015
Morse DR, Lawton JH, Dodson MM, Williamson MH (1985) Fractal dimension of veg-etation and the distribution of arthropod body lengths. Nature 314: 731–733. doi: 10.1038/314731a0
Morse DR, Stork NE, Lawton JH (1988) Species number, species abundance and body length relationships of arboreal beetles in Bornean lowland rain forest trees. Ecological Entomo-logy13: 25–37. doi: 10.1111/j.1365-2311.1988.tb00330.x
Pinheiro F, Diniz IR, Kitayama K (1998) Comunidade local de Coleoptera em Cerrado: Di-versidade de espécies e tamanho do corpo. Anais da Sociedade Entomológica do Brasil27: 543–550. doi: 10.1590/S0301-80591998000400006
Siemann E, Haarstad J, Tilman D (1999) Dynamics of plant and arthropod diversity during old ield succession. Ecography 22:406–414. doi: 10.1111/j.1600-0587.1999.tb00577.x StatSoft, Inc. (2007) STATISTICA (data analysis software system), version 8.0. www.statsoft.
com
Tilman D (1990) Constraints and tradeofs: toward a predictive theory of competition and succession. Oikos58: 3–15. doi: 10.2307/3565355
Woodward G, Ebenman B, Emmerson M, Montoyas JM, Olesens JM, Valido A, Warren PH (2005) Body size in ecological networks. Trends in Ecology and Evolution20: 402–409. doi: 10.1016/j.tree.2005.04.005