(Annals of the Brazilian Academy of Sciences) ISSN 0001-3765
www.scielo.br/aabc
Riparian forest potential to retain sediment and carbon evaluated
by the
137Cs fallout and carbon isotopic ratio techniques
LUIZ F. PIRES1,2, OSNY O.S. BACCHI2, VLADIA CORRECHEL3, KLAUS REICHARDT2 and JOSELINE FILIPPE2
1Laboratório de Física Aplicada a Solos e Ciências Ambientais
Universidade Estadual de Ponta Grossa, UEPG, Av. Gen. Carlos Cavalcanti, 4748 84030-900 Ponta Grossa, PR, Brasil
2Laboratório de Física dos Solos, Centro de Energia Nuclear na Agricultura, USP/CENA
Caixa Postal 96, 13400-970 Piracicaba, SP, Brasil
3Universidade Federal de Goiás, UFG, Caixa Postal 131, 74001-970 Goiânia, GO, Brasil
Manuscript received on April 10, 2008; accepted for publication on November 11, 2008; contributed byKLAUSREICHARDT*
ABSTRACT
Riparian forests can provide an important service for aquatic ecosystems by sequestering hillslope-derived sediments. However, the width of a riparian buffer zone required to filter sediments is not yet well-understood. Here are used two
complementary tracers to measure sediment retention. The137Cs technique and the soil carbon isotopic ratios(δ13C)
are utilized to investigate sediment deposition and erosion rates on a slope transect cultivated with sugarcane followed
by a secondary riparian forest zone in Iracemápolis, State of São Paulo, Brazil. The137Cs technique and theδ13C
analysis showed that the width of a riparian vegetation in accordance to a Brazilian Environmental Law (N◦4.771/65)
was not sufficient in trapping sediments coming from agricultural lands, but indicated the importance of these forests
as a conservation measure at the watershed scale. The complementaryδ13C analysis together with soil morphology
aspects allowed a better interpretation of the sediment redistribution along the sugarcane and riparian forest transects.
Key words:erosion,δ13C, sugarcane, C3and C4plants, carbon.
INTRODUCTION
Riparian zones are the ecotons located between aquatic and terrestrial systems, considered as key areas for the stability of the global biodiversity, serving as protection niches for wildlife, and acting as ecological corridor be-tween forest fragments (Kajeyama et al. 2002, Rodrigues and Gandolfi 2001). Besides their ecological function, these “buffer zones” are considered important for water-way protection, being responsible for improving surface water quality. The main mechanisms involved on this function are the filtering and trapping of sediments which result from erosion on upland agricultural fields. These
*Member Academia Brasileira de Ciências Correspondence to: Luiz Fernando Pires E-mail: [email protected]; [email protected]
mechanisms are related to changes in surface roughness, water infiltration rates into litter layers, the presence of roots, and the improved structure of soil matrix caused by intense microbiologic activity in the soil (Ampontuah et al. 2006, Izidorio et al. 2005).
(mainly Phosphorus and Nitrogen) and sediments car-ried from agricultural lands (Sparovek et al. 2001).
Erosion and sediment deposition studies that inte-grate agricultural systems and riparian forests are es-sential for the understanding of the functional aspects of complex landscapes, as the watersheds, which con-tain both elements. This understanding is useful to im-prove the related environmental legislation and to in-crease the probability of success on public intervention in restoring riparian systems located in private lands, opening the possibility of a link between environmen-tal and agricultural production programs. Difficulties in carrying such an approach are the choice and con-fidence on methodologies to predict soil loss and sedi-ment deposition in complex areas. The137Cs technique aided by the soil carbon isotopic ratio(δ13C)analysis is
a sound alternative to investigate the processes involved in such systems.
Caesium-137 is an artificial radionuclide with a half-life of 30.17 years produced by thermonuclear ex-plosions made in the atmosphere and by nuclear reactor accidents. The global fallout of 137Cs began in 1954, with peak values during 1963 and 1964, and decreasing from this maximum to below detection levels since the mid-1980s.137Cs has been transported to the earth’s sur-face as fallout, which is more abundant in the northern hemisphere than in the southern. Due its relatively long half-time, its strong adsorption on fine soil particles and its low mobility in the soil profile,137Cs has been used with success as a tracer to make measurements of soil loss and deposition, mainly on the north hemisphere due to its greater abundance (Ritchie and Ritchie 2001, Walling and Quine 1993). Caesium-137 reaches the soil surface by dry deposition and precipitation and it is strongly adsorbed by fine soil particles. Its concentration increases with the increase of the specific surface area of soil particles and its translocation from the surface layer downwards is very slow. Its vertical movement or leach-ing is a result of soil physical and chemical phenomena and the horizontal movement is related to runoff (He and Walling 1996, Livens and Loveland 1988).
The assessment of137Cs redistribution is based on a comparison of measured inventories at individual sam-pling points with an equivalent estimate of the inventory of a representative site of the cumulative fallout input,
which was not been subject to soil erosion or deposi-tion. The sampling points with lower inventories than the reference site are taken as locations of soil loss and, therefore, erosion may be inferred. Similarly, sampling points with inventories in excess of the reference level are taken as sediment deposits. Quantitative estimates of erosion and deposition rates from137Cs measurements are made through conversion models that relate the ero-sion or deposition rate to the magnitude of the reduction or increase in the137Cs inventory (Zapata 2003).
The use of the soil carbon isotopic ratio technique in soil research increased in the last years (SIBAE-BASIN 2004), and is based on the differences of the photosyn-thetic pathways of C3and C4plants, which cause distinct δ13C values in their tissues (Farquhar et al. 1989).
Dur-ing carbon fixation from the atmosphere, C3plants give preference to the lighter C isotopes, resulting more en-riched compounds in12C and consequently lowerδ13C values in relation to C4 plants. These isotopic differ-ences allow the differentiation of the carbon of C3and C4 plants in a simple way (Martinelli et al. 1991, Vitorello et al. 1989). Since sugarcane is a C4plant and the ripar-ian forest is composed mainly of C3plants it is possible to identify and quantify in the forest soil the contribution of both the carbon derived from the upland sugarcane crop and the carbon derived from the immediate forest (in situcarbon).
The main objective of this study is to check the effi-ciency of a riparian forest in trapping sediments coming from an upland sugarcane field, using the 137Cs tech-nique aided by soil carbon isotopic ratio analysis.
MATERIALS AND METHODS CHARACTERISTICS OF THESTUDYAREA
The selection of the study area was based on the need to find field situations, which present conditions for abrupt changes between soil loss and sediment deposition, in order to allow the analysis of the sensibility of both the 137Cs technique and the soil carbon isotopic ratio
secondary riparian forest were selected in Iracemápo-lis, State of São Paulo, Brazil (22◦35′S and 47◦33′W). According to Köppen’s classification, the climate is of the type Cwa, with an annual mean temperature of 21◦C and a mean precipitation of 1,360 mm per year. The mean altitude is 610 m (a.s.l.) and the predominant soil is classified as a Rhodic Hapludox according to Soil Taxonomy (Soil Survey Staff 1993). The main crop of region is sugarcane, which has been continuously culti-vated over more than 50 years. Soil samples were taken and analyzed in 2006.
137CSTECHNIQUE
Before Cs analysis, the soil samples were oven dried at 105◦C, gently disaggregated, passed through a 2 mm sieve and homogenized. A representative fraction of each sample (an amount of approximately 1.5 kg) was placed into Marinelli beakers for 137Cs activity deter-mination. The137Cs activities of each 20 cm soil layer expressed in Bq.kg–1 were then converted to Bq.m–2 taking into account the auger diameter and the soil bulk density. The Cs inventory (Bq.m–2) for each profile was taken as the sum of the activities of the analyzed soil layers.
For the 137Cs determination, points were located on the transect at the following positions: a) five points along the sugarcane transect (ST) segment, spaced 10 m from each other (points –50, –40, –30, –20, –10); and b) twelve points in the riparian forest transect (FT) seg-ment spaced 5 m from each other (points 5 and 10) and 10 m from each other (points from 10 to 110). The tran-sition zone between the ST and FT segments is repre-sented by a 5 m width dusty road. Based on a local in-spection of the road cross section, it is assumed that this road did not interfere significantly on the erosion and deposition processes, and also not as a sediment source. For each transect point a composite sample was obtained from five samples collected on contour lines (5 m distant from each other), perpendicularly to the transect. There-fore each composite sample of each soil layer and of each point of the transect represents an average of a 20 m wide down slope land strip.
A HPGE Coaxial Detector (GEM-20180P, PopTop) with an absolute detection efficiency of 0.7% (Wallbrink et al. 2002) for the adopted geometry (1 L Marinelli
Beaker) was used for the analysis of samples from the reference site and from the transect points. The above mentioned efficiency was determined experimentally us-ing a standard soil sample with a known Cs activity supplied by the International Atomic Energy Agency (IAEA), Vienna, Austria. Due to the very low 137Cs activity of our soil samples and the very low detection efficiency, the counting time for each sample varied from 24 to 72 hours.
The reference site was chosen in a 20,000 m2 flat grass land area of an old garden, located at the Cam-pus of São Paulo State University (ESALQ), Piracicaba, SP, Brazil (22◦40′ S; 47◦38′ W; 580 m a.s.l.), 25 km far from the experimental site. More than 40 years ago the area was embanked in order to establish a very flat grass (Paspalum notatumFlugge) field to be used only for recreation. The soil is an embankment with 18% sand, 39% clay, and 43% silt. The climate is very similar to that of Iracemápolis. The reference site being located close to the experimental site was considered adequate as a reference for the fallout deposition in the region. A more complete characterization of the reference site and procedures used for the determination of the reference site inventory can be found in Correchel et al. (2005).
The results of137Cs loss or gain were calculated by comparison of each inventory point with the reference site inventory according to:
Csred =
Cs
p−Csref Csref
(1)
where Csred is the fraction of distributed 137Cs, loss if negative and gain if positive; Csp and Csref are the
137Cs inventories at each sampled point and at the
refer-ence site, respectively.
The proportional model (Walling and He 1997) was used to convert the values of Csred(%) into soil erosion or deposition rates E (Mg.ha–1.year–1):
E=
Cs
redρbD TP100
10 (2)
deter-mined dividing the dry soil mass by the correspondent auger hole volume of each 20 cm soil layer. The plough depth was taken as 20 cm depth. The time lapse since fallout peak occurrence and the sampling date was taken as 43 years.
STABLEISOTOPE(δ13C)TECHNIQUE
Carbon (C) stable isotopes present 6 protons and 6 (12C) or 7 (13C) neutrons in their nuclei. The carbon isotopic composition of a given sample δ13C can be expressed
in relative terms by the ratios between the abundance of 13C and12C (Vitorello et al. 1989):
δ13C◦/◦◦ (sample)
=
13C12
C(sample)
13C12
C(std)
−1
!
1000 (3)
where the standard (std) ratio13C/12C value is that ob-tained with the international standard Pee Dee Belem-nite, and to determine the relative contribution of sug-arcane plant C to the forest total soil C, the following equation was used:
fc= δ 13C
OM-SAMPLE−δ13COM-forest
δ13COM-sugarcane−δ13COM-forest (4) where fc represents the sugarcane C fraction;
δ13COM-SAMPLE is the mean value of δ13C for the or-ganic matter (OM) of samples; andδ13COM-sugarcaneand
δ13COM-forestare the mean values ofδ13C for sugarcane
(C4-plant) and the specific forest species (C3-plants), re-spectively. The referenceδ13C value for the sugarcane
OM (δ13COM-sugarcane) determined according to equa-tion 3 was taken as –13.0◦/◦◦ and for the specific forest species OM as –26.5◦/
◦◦.
Isotopic determinations of soil samples were made using a Thermo Quest-Finnigan Delta Plus isotope ratio mass spectrometer (Finnigan-MAT – USA) interfaced to an Elemental Analyzer (Carla Erba model 1110 – Italy). Beforeδ13C analysis, the soil samples were oven
dried at 40◦C, passed through a 2 mm sieve, ground to a fine powder using a cleaned laboratory mill, and then weighted and loaded into tin capsules. Values of fc ac-cording to equation 4 were determined for 24 superficial soil samples (0–5 cm) collected along the FT and ST segments.
SOILMORPHOLOGYANALYSIS
Detailed soil morphological descriptions were carried out for the FT segment taking samples from points lo-cated at each 10 meters from the upper border of the forest down-slope to the reservoir margin, and at 0–5, 0–10, 10–20, 20–40, 40–60, 60–80, and 80–100 cm depth from three pits located at 5, 10, and 20 m from the forest border. The geometrical distribution of the soil horizons and sediments was established using the methodology developed by Boulet et al. (1982). For mi-cromorphological observations and image analysis, thin sections of 5 by 7 cm were prepared from blocks im-pregnated with a non-saturated polyester resin diluted with styrene monomer. A fluorescent dye allows dis-tinguishing the pores when illuminated with UV light (Cooper et al. 2005). Digital images were acquired from the thin sections and impregnated blocks using a color CCD camera with a resolution of 1024×768 pixels (area of 156µm2.pixel–1). Images were processed using the
Noesis Visilogrimage analysis software. Particle size distribution was determined by sieving and the Boyou-cus method, using a hydrometer, after dispersion with a sodium hydroxide and sodium hexametaphosphate solu-tion (Camargo et al. 1986).
RESULTS AND DISCUSSION
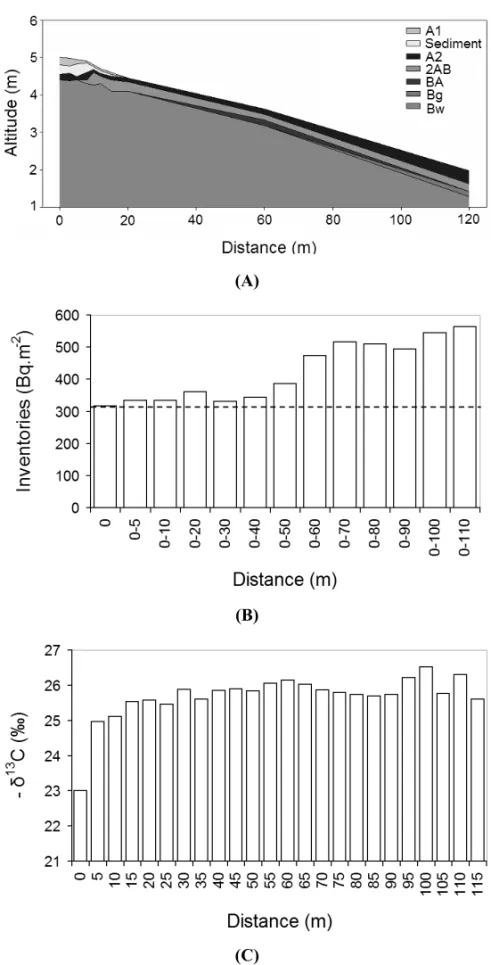
The soil distribution of horizons obtained with the aid of morphological and micro-morphological analysis, the137Cs inventories, and the soil carbon isotopic ratio within the riparian forest transect segment, are shown in Figure 1.
morphology description and their main difference in re-lation to the original soil is the aggregation and porosity (Cooper et al. 2005, Boulet et al. 1982).
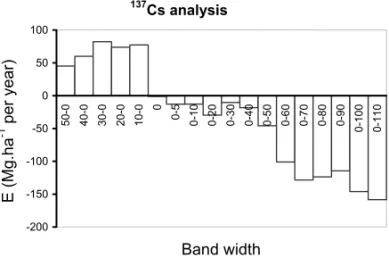
A qualitative analysis of the inventories of both transect segments allows to note that most of the sugar-cane points were eroded profiles (137Cs inventories less than the reference) and all the riparian forest points were profiles of sediment deposition (137Cs inventories higher than the reference). Figure 2 presents the estimated ero-sion (+) and sediment deposition rates (–) determined by the137Cs technique along the ST and FT segments.
-200 -150 -100 -50 0 50 100 5 0 -0 4 0 -0 3 0 -0 2 0 -0 1 0
-0 0 0-5
0 -1 0 0 -2 0 0 -3 0 0 -4 0 0 -5 0 0 -6 0 0 -7 0 0 -8 0 0 -9 0 0 -1 0 0 0 -1 1 0 Band width E (Mg .h a
-1 p
e
r
ye
a
r)
Fig. 2 – Average soil erosion (E) (+) and deposition (D) (–) rates as a function of band widths (ST – sugarcane and FT – riparian forest segments) obtained using the137Cs technique.
A significant increase of137Cs inventories was ob-served along the FT segment down to the last sampled point which is 110 m distant from the upper edge the for-est (Fig. 1B). However, the quantification of sediment redistribution inside the FT segment is not as simple as in cultivated soils where the137Cs fallout inputs can be assumed to be uniformly mixed within the cultivation layer. The increase in the inventories along the forest transect could be attributed to a selective redistribution of fine sediment as well as due to the exponential de-cline of137Cs concentrations with depth in the original undisturbed soil profile of the forest. Samples taken from the upper 5 cm soil profile of the FT segment down to 80 m did not show important textural differences or trends that could explain the selective transport of fine sediments along the transect. Due to the exponential de-cline of the137Cs concentrations with depth in the orig-inal undisturbed soil profile of the forest, the gain of a
given amount of137Cs in relation to the reference inven-tory would correspond to a lower deposition rate if com-pared to a same137Cs gain in a cultivated soil. For undis-turbed soils alternative approaches are then required to derive erosion and deposition rates like empirical or other theoretical models based on the137Cs distribution in soil profiles (Wallbrink et al. 2002). However, in the present study, the riparian forest is adjacent to an upland sug-arcane crop which is clearly the source of the sediment deposited in the forest. Besides the sediments coming from the upland field some small amount could also be deposited just in the lower strip edge of the forest sit-uated 50 m distant from the last sampling point of the FT segment. However, the lower forest border contour level is in a much higher level than the drainage ditch of a large downstream water reservoir borderlined by the forest. Therefore, considering that the forest would be trapping most part of the sediment delivered by the upland sugarcane crop, it is reasonable to consider that the deposition rate occurred in the forest is of the same order of magnitude of the upland sugarcane sediment delivery rate.
The137Cs technique was sensitive to the presence of the riparian forest (Fig. 2). The technique indicates a predominant occurrence of erosion process in the ST segment (inventories lower than the reference site) and sediment deposition in the FT segment (inventories higher than the reference site). The magnitude of the sediment deposition rate in the FT segment was than calculated using equation 2.
According to Correchel et al. (2005), the invento-ries at the reference site varied from 277 to 367 Bq.m–2, resulting an average reference value of 314±34 Bq.m–2. The137Cs activities decreased in depth from 302 Bq.m–2 for the upper 15 cm of the soil profile to 11 Bq.m–2for the 15-25 cm layer. No significant 137Cs activity was detected below this layer. The randomic spatial vari-ability of the data of the reference site presented a CV of 11%.
of the thirteen137Cs inventories of the FT segment was 564 Bq.m–2 and the correspondent estimated sediment deposition rate was –158 Mg.ha–1.yr–1. Using the same proportional model, the erosion rates estimated for the five upland sugarcane points of the same transect are of the order of 45 Mg.ha–1.yr–1. The comparison of the sed-iment deposition rate in the FT segment with the erosion rate in the sugarcane crop shows clearly the important effect of the riparian forest system in the control of the out of farm sediment delivery. This result also indicates that the riparian forest length adopted the Brazilian En-vironmental Law (≈30 m) is not sufficient to retain the sediment transported by the runoff confirming the results obtained by Sparovek et al. (2001).
δ13C values (Fig. 1C) determined inside the FT
segment indicate that the amount of sugarcane carbon in relation to the total soil carbon in the upper 5 cm layer decreases with distance. This result of the sugarcane carbon concentration in the FT segment is in agreement with the soil morphology analysis. Therefore,δ13C data
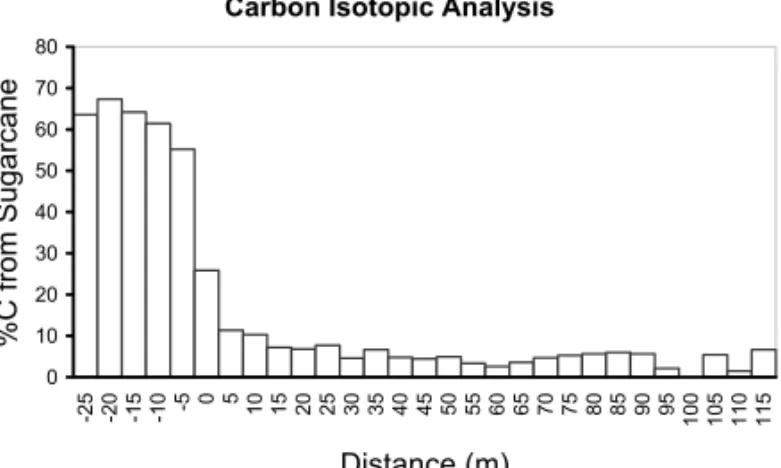
show that the higher sediment deposition occurs at the beginning of the FT segment, while 137Cs inventories present an opposite behavior. The contribution of sugar-cane carbon to the total soil carbon of the surface riparian forest soil (upper 5 cm layer) is shown in Figure 3.
0 10 20 30 40 50 60 70 80 -2 5 -2 0 -1 5 -1
0 -5 0 5 10 15 20 25 30 35 40 45 50 55 60 65 70 75 80 85 90 95
1 0 0 1 0 5 1 1 0 1 1 5 Distance (m) % C f ro m S u g a rc a n e
Fig. 3 – Contribution of the sugarcane carbon (%SC) to the total soil carbon in the sugarcane transect (ST) segment and in the riparian forest transect (FT) segment.
The percentage of sugarcane carbon contribution (%SC) to the total soil carbon in the upper 5 cm layer is high in the ST segment, as expected, and there is a tendency of a decrease in this %SC along the FT seg-ment, also as expected. The main sources of carbon in
the sugarcane crop field soil result from the practice of burning the sugarcane leaves and trash before harvest, and the decomposition of remaining leaves and other residues after harvest. It can be observed in Figure 3 that the amount of sugarcane carbon in the sugarcane transect segment (from –25 to –5 m distance) only ranges from 55.2 to 67.3%. These values of %SC in the sugarcane area are not closer to 100% as expected because the or-ganic matter of the soil in the ST segment represents a mixture of sugarcane and native forest residues. The in-troduction of the sugarcane crop in the ST segment was made in a region of native forest about 50 years ago and the residues of this native forest are still present. Similar results were reported by Vitorello et al. (1989).
Fifteen meters inside the FT segment the amount of sugarcane carbon found in the total soil carbon practi-cally oscillates around an average of 4.7%. The exper-imental data of %SC were adjusted using the following equation
%C=
(
100.9−7.8 1
+exp((x−1.3)/2.5)
)
+7.8(r2=0.99).
Through this sigmoid mathematical adjustment it was possible to confirm that after about 15 m inside the FT segment the amount of sugarcane carbon found in the total soil carbon practically trends to a constant value. One of the sources of the sugarcane carbon present in the soil of the FT segment is the runoff, which trans-ports both soil suspended sediments and carbon from the upland sugarcane field. This decrease in the sugar-cane carbon concentration in the FT segment as discussed above is in agreement with the soil morphology analy-sis, which could not be clearly understood only in light of the137Cs redistribution analysis.
The ST segment presented the heaviestδ13C
val-ues, varying from –18.2 to –17.4◦/
◦◦, with an average of
–17.8±0.3◦/◦◦ (n = 4). Such low isotopic values are in the range typically found for C4plants. The highest δ13C values, varying from –26.5 to –23.0◦/◦◦, with an average of –25.7±0.7◦/◦◦ (n = 24) were found for the FT segment. Typicallyδ13C for C3plants fall between –25 and –34◦/
◦◦, and the most common values vary from –26 and –29◦/
CONCLUSIONS
The results obtained by the137Cs technique and soil car-bon isotopic ratio analysis indicated the efficiency of riparian vegetation in trapping sediments coming from agricultural lands and its importance as a conservation measure at the watershed scale.
The results allow stating that the minimum forest width of 30 m would not be enough to assure the sed-iment trapping function of the riparian vegetation for the local conditions of soil, climate, land use, topog-raphy, and the kind of riparian vegetation, contradict-ing the Brazilian Environmental Law (Law 4.771/65) if adopted for such conditions.
ACKNOWLEDGMENTS
The authors are grateful to Conselho Nacional de Desen-volvimento Científico e Tecnológico (CNPq) and Inter-national Atomic Energy Agency (IAEA) for the finan-cial support and fellowships.
RESUMO
As matas ciliares podem fornecer serviços importantes para os ecossistemas aquáticos sequestrando sedimentos oriundos das áreas de encostas. No entanto, a largura da zona ripária necessária para a retenção de sedimentos ainda não está bem determinada. Aqui são usadas duas técnicas complementares para medir a retenção de sedimentos. As metodologias do
137Cs e da composição isotópica do carbono(δ13C)são
utili-zadas para avaliar a deposição de sedimentos e taxas de erosão em uma encosta cultivada com cana-de-açúcar seguida por uma mata ciliar situada em Iracemápolis, no Estado de São
Paulo, Brasil. As análises pelas técnicas do 137Cs e δ13C
mostraram que a largura da mata ciliar definida pela Lei
Ambi-ental Brasileira (N◦4.771/65) não foi suficiente na retenção
de sedimentos oriundos de áreas cultivadas, mas indicou a importância destas florestas como medida de conservação de
bacias hidrográficas. A análise complementar deδ13C junto
com informações morfológicas do solo permitiu melhor inter-pretação da redistribuição de sedimentos ao longo das áreas de cana-de-açúcar e mata ciliar.
Palavras-chave: erosão, δ13C, cana-de-açúcar, plantas C3e
C4, carbono.
REFERENCES
AMPONTUAHEO, ROBINSONJSANDNORTCLIFFS. 2006. Assessment of soil particle redistribution on two contrast-ing cultivated hillslopes. Geoderma 132: 324–343. BOULET R, CHAUVEL A, HUMBEL FX AND LUCAS Y.
1982. Analyse structurale et cartographie en pédologie. I Prise en compte de l´organisation bidimensionelle de la couverture pédologique: les études de toposéquences et leurs principaux apports à la connaissance des sols. Cah Orst Ser Pedol 19: 309–320.
BOUTTON TW. 1991. Stable isotope ratio of natural mate-rial: II. Atmospheric, terrestrial, marine, and freshwater
environments. In: COLEMANDC, FRAYD (Eds),
Car-bon Isotopic Techniques. San Diego: Academic Press Inc. p. 173–185.
CAMARGOAO, MONIZACANDVALADARESJM. 1986. Métodos de análise química, mineralógica e física de solos do IAC. Campinas: Instituto Agronômico de Campinas. IAC Boletim Técnico, 106, 94 p.
COOPERM, VIDAL-TORRADOP ANDCHAPLOTV. 2005. Origin of microaggregates in soils with ferralic horizons. Sci Agric 62: 256–263.
CORRECHEL V, BACCHI OOS, REICHARDT K AND DE
-MARIA IC. 2005. Random and sistematic spatial
vari-ability of 137Cs inventories at reference sites in
South-Central Brazil. Sci Agric 62: 173–178.
FARQUHARGD, EHLERINGERJRANDHUBICKKT. 1989. Carbon isotope discrimination and photosynthesis. Ann Rev Plant Physiol Plant Mol Biol 40: 503–537.
HEQANDWALLINGDE. 1996. Interpreting particle size
effects in the adsorption of137Cs and unsupported210Pb
by mineral soils and sediments. J Environ Radioact 30: 117–137.
IZIDORIOR, MARTINS FILHOMV, MARQUES JUNIORJ, SOUZAZMANDPEREIRAGT. 2005. Perdas de Nutri-entes por erosão e sua distribuição espacial em área sob cana-de-açúcar. Eng Agric 25: 660–670.
KAJEYAMA PY, GANDARAFB, OLIVEIRARE ANDMO
-RAES LFD. 2002. Restauração da Mata Ciliar Manual
para recuperação de áreas ciliares e microbacias. Secre-taria do Meio Ambiente e Desenvolvimento sustentável, São Paulo, SP, Brasil.
LIVENSFRANDLOVELANDPJ. 1988. The influence of soil properties on the environmental mobility of caesium in Cumbria. Soil Use Manage 4: 69–75.
MARTINELLILA, DEVOLAH, VICTORIARLANDRICHEY
JE. 1991. Stable carbon isotope variation in C3 and C4
plants along the Amazon River. Nature 353: 57–59. NILSSON C, JANSONR ANDZINKOU. 1997. Long-term
responses of river-margin vegetation to water-level regu-lation. Science 276: 798–800.
OLEARYMH. 1988. Carbon isotopes in photosynthesis.
Bio-Science 38: 328–336.
RITCHIEJCANDRITCHIECA. 2001. Bibliography of
publi-cations of137Cs studies related to erosion and sediment
de-position. http://hydrolab.arsusda.gov/cesium137bib.htm. RODRIGUES RR AND GANDOLPHI S. 2001. Conceitos,
tendências e ações para a Recuperação de Florestas
Ci-liares. In: RODRIGUESRR, LEITÃOFILHOHF (Eds),
Matas Ciliares: Conservação e Recuperação. São Paulo: EDUSP/FAPESP. 320 p.
SIBAE-BASIN CONFERENCE. 2004. Partitioning of fluxes between the biosphere and atmosphere across spatial scales. Sibae-Basin Conference Proceedings, Interlaken, Switzerland, p. 27–37.
SOILSURVEYDIVISIONSTAFF. 1993. Soil Survey Manual. US Government Printing Office, Washington, DC. SPAROVEKG, RANIERISBL, GASSNERA,DEMARIAIC,
SCHNUGE, SANTOSRFANDJOUBERTA. 2001. A con-ceptual framework for the definition of the optimal width of riparian forest. Agric Ecos Environ 90: 169–175.
VITORELLOVA, CERRICC, ANDREUXF, FELLERCAND VICTÓRIAR. 1989. Organic matter and natural Carbon-13 distribution in forested and cultivated oxisols. Soil Sci Soc Am J 53: 773–778.
WALLBRINKPJ, WALLING DEANDHEQ. 2002. Radio-nuclide measurement using HPGe gamma spectrometry.
In: ZAPATA FG (Ed), Handbook for the assessment of
soil erosion and sedimentation using environmental radio-nuclides. Netherlands, IAEA, p. 67–96.
WALLINGDEANDHEQ. 1997. Models for converting137Cs measurements to estimates of soil redistribution rates on cultivated and uncultivated soils. A contribution to the IAEA Coordinated Research Programmers on Soil Ero-sion (D1.50.05) and Sedimentation (F3.10.01). University of Exeter, Exeter, UK, p. 29.
WALLINGDEANDQUINETA. 1993. Use of Caesium-137 as a Tracer of Erosion and Sedimentation: Handbook for the Application of the aesium-137 Technique, UK Overseas Development Administration Research Scheme R4579. Department of Geography, University of Exeter, Exeter, UK, 196 p.