Potential Clinical Value of Multiparametric
PET in the Prediction of Alzheimer
’
s Disease
Progression
Xueqi Chen1,2, Yun Zhou1,2*, Rongfu Wang1*, Haoyin Cao3, Savina Reid2, Rui Gao2,4, Dong Han5, Alzheimer’s Disease Neuroimaging Initiative
1Department of Nuclear Medicine, Peking University First Hospital, Beijing, China,2The Russell H. Morgan Department of Radiology and Radiological Science, Johns Hopkins University School of Medicine, Baltimore, Maryland, United States of America,3University Hospital, Hamburg-Eppendorf, Hamburg, Germany, 4Department of Nuclear Medicine, the First Affiliated Hospital of Xian Jiaotong University, Xi'an, Shaanxi, China,5Department of Computer Science and Engineering, Oakland University, Rochester, Michigan, United States of America
¶ Membership of the Alzheimer’s Disease Neuroimaging Initiative is provided in the Acknowledgments. *[email protected](YZ);[email protected](RW)
Abstract
Objective
To evaluate the potential clinical value of quantitative functional FDG PET and pathological amyloid-βPET with cerebrospinal fluid (CSF) biomarkers and clinical assessments in the prediction of Alzheimer’s disease (AD) progression.
Methods
We studied 82 subjects for up to 96 months (median = 84 months) in a longitudinal Alzhei-mer’s Disease Neuroimaging Initiative (ADNI) project. All preprocessed PET images were spatially normalized to standard Montreal Neurologic Institute space. Regions of interest (ROI) were defined on MRI template, and standard uptake values ratios (SUVRs) to the cer-ebellum for FDG and amyloid-βPET were calculated. Predictive values of single and multi-parametric PET biomarkers with and without clinical assessments and CSF biomarkers for AD progression were evaluated using receiver operating characteristic (ROC) analysis and logistic regression model.
Results
The posterior precuneus and cingulate SUVRs were identified for both FDG and amyloid-β
PET in predicating progression in normal controls (NCs) and subjects with mild cognitive impairment(MCI). FDG parietal and lateral temporal SUVRs were suggested for monitoring NCs and MCI group progression, respectively.18F-AV45 global cortex attained (78.6%, 74.5%, 75.4%) (sensitivity, specificity, accuracy) in predicting NC progression, which is comparable to the11C-PiB global cortex SUVR
’s in predicting MCI to AD. A logistic regres-sion model to combine FDG parietal and posterior precuneus SUVR and Alzheimer’s
a11111
OPEN ACCESS
Citation:Chen X, Zhou Y, Wang R, Cao H, Reid S, Gao R, et al. (2016) Potential Clinical Value of Multiparametric PET in the Prediction of Alzheimer’s Disease Progression. PLoS ONE 11(5): e0154406. doi:10.1371/journal.pone.0154406
Editor:Kewei Chen, Banner Alzheimer's Institute, UNITED STATES
Received:February 1, 2016
Accepted:April 13, 2016
Published:May 16, 2016
Copyright:© 2016 Chen et al. This is an open access article distributed under the terms of the
Creative Commons Attribution License, which permits unrestricted use, distribution, and reproduction in any medium, provided the original author and source are credited.
Data Availability Statement:Data used in preparation of this article were obtained from the Alzheimer’s Disease Neuroimaging Initiative (ADNI) database (adni.loni.usc.edu). A complete listing of ADNI subjects included in this study can be found in the Supporting Information files.
Funding:Data collection and sharing for this project was funded by the Alzheimer's Disease
Disease Assessment Scale-Cognitive (ADAS-Cog) Total Mod was identified in predicating NC progression with (80.0%, 94.9%, 93.9%) (sensitivity, specificity, accuracy). The selected model including FDG posterior cingulate SUVR, ADAS-Cog Total Mod, and Mini-Mental State Exam (MMSE) scores for predicating MCI to AD attained (96.4%, 81.2%, 83.6%) (sensitivity, specificity, accuracy).11C-PiB medial temporal SUVR with MMSE sig-nificantly increased11C-PiB PET AUC to 0.915 (p<0.05) in predicating MCI to AD with (77.8%, 90.4%, 88.5%) (sensitivity, specificity, accuracy).
Conclusion
Quantitative FDG and11C-PiB PET with clinical cognitive assessments significantly improved accuracy in the predication of AD progression.
Introduction
Alzheimer’s disease (AD) is a slowly developed dementia. The symptoms could appear years after the biochemical changes in the brain happen. Paying considerable attention to the changes prior to clinical signs would be beneficial to both early diagnosis and possible treat-ment [1,2]. People with mild cognitive impairment (MCI) proved to be at high risk of develop-ing AD dementia, particularly for those in late MCI (LMCI) [3]. The pathological criteria for AD, or MCI due to AD, includes neuropathological evidence of neurofibrillary tangles and senile plaques with extracellularβ-amyloid (Aβ) deposition and abnormal total tau (t-tau) or phosphorylated-tau (p-tau) deposition [4]. Although the clinical diagnosis of AD is mostly centered on the occurrence of clinical symptoms and cognitive impairment assessments, the new guideline proposed by National Institute of Aging and Alzheimer’s Association work-groups in 2011 provides updated details about the biomarkers associated with AD aside from clinical assessments [5].
Currently, the biomarkers of amyloidosis include Aβand tau concentration in cerebrospinal fluid (CSF) and Aβand tau brain deposition imaged by positron emission tomography (PET). Indicators extracted from structural and functional neuroimaging, such as atrophy detected by magnetic resonance imaging (MRI) and hypometabolism detected by18F-fluorodeoxyglucose (FDG) PET, could also provide essential information closely associated with disease develop-ment [5]. The integration of these techniques brings new opportunities, as well as challenges, to the multimodality neuroimaging era in AD clinic and research [6].
FDG PET is used to detect the impairment of neuronal injury through the reduction of regional cerebral glucose metabolism in AD progression [7]. Amyloid deposition could also be measured by PET modality using tracers like18F-florbetapir (18F-AV45) and11C-Pittsbrugh Compound-B (11C-PiB). The correlation between the measurement of PET amyloid imaging and histological evidence of Aβdeposition were ascertained by several studies [8,9].
It is now commonly accepted that the combination of different measurements yield promis-ing evaluations for the prediction of disease progression. Longitudinal analysis of AD is essen-tial because as AD develops over many years, the abnormality and order of changes for each biomarker are quite different [10,11]. Nowadays, the quantitative PET technique is considered as a critical tool for monitoring and evaluating the AD progression. Evaluation of single or multiparametric PET performance in diagnosis and monitoring are indispensable for stan-dardization and optimal use of PET in AD imaging. Through indirect study, comparable char-acteristics were found among the three widely-used radiotracers, FDG,18F-AV45 and11C-PiB
and Bioengineering, and through generous contributions from the following: Alzheimer’s Association; Alzheimer’s Drug Discovery Foundation; Araclon Biotech; BioClinica, Inc.; Biogen Idec Inc.; Bristol-Myers Squibb Company; Eisai Inc.; Elan Pharmaceuticals, Inc.; Eli Lilly and Company; EuroImmun; F. Hoffmann-La Roche Ltd and its affiliated company Genentech, Inc.; Fujirebio; GE Healthcare; IXICO Ltd.; Janssen Alzheimer Immunotherapy Research & Development, LLC.; Johnson & Johnson Pharmaceutical Research & Development LLC.; Medpace, Inc.; Merck & Co., Inc.; Meso Scale Diagnostics, LLC.; NeuroRx Research; Neurotrack Technologies; Novartis Pharmaceuticals Corporation; Pfizer Inc.; Piramal Imaging; Servier; Synarc Inc.; and Takeda Pharmaceutical Company. The Canadian Institutes of Health Research is providing funds to support ADNI clinical sites in Canada. Private sector contributions are facilitated by the Foundation for the National Institutes of Health (www.fnih.org). The grantee organization is the Northern California Institute for Research and Education, and the study is coordinated by the Alzheimer's Disease Cooperative Study at the University of California, San Diego. ADNI data are disseminated by the Laboratory for Neuro Imaging at the University of Southern California. This work of the author was in part supported by the China Scholarship Council (No. 201406010242).
[12]. However, the direct combination and comparison of these three radiotracers, especially for a longer follow-up time period, would still be meaningful for the further studies.
Alzheimer’s Disease Neuroimaging Initiative (ADNI) (http://adni.loni.ucla.edu/) is an inter-national longitudinal multi-site multimodal AD imaging study with standardized image acqui-sition and processing procedures. In this study, a subpopulation with follow-up as long as 96 months from the ADNI project was selected to evaluate the potential clinical value of quantita-tive FDG,18F-AV45 and11C-PiB PET in the diagnosis and monitoring of AD progression. Various combinations of studying groups (normal controls, MCI, and AD), multiparametric PET images, CSF measurements, and clinical assessments were evaluated for improving the accuracy of diagnosis and monitoring of AD progression.
Materials and Methods
Data collection from ADNI
The anonymized and de-identified data used in the study were collected from ADNI database (adni.loni.usc.edu) by November 2014. The ADNI was launched in 2003 as a public-private partnership supported project. The ADNI data were collected from over 50 research sites and the ADNI study was approved by the local Institutional Review Boards (IRBs) of all participat-ing sites, includparticipat-ing our IRB at Johns Hopkins University and Albany Medical College, Banner Alzheimer’s Institute, Baylor College of Medicine etc. The detailed information and complete list of ADNI sites’IRBs could be found at http://adni.loni.usc.edu/about/centers-cores/study-sites/andhttp://www.adni-info.org/. Study subjects and if applicable, their legal representa-tives, gave written informed consent at the time of enrollment for imaging data, genetic sample collection and clinical questionnaires. The primary goal of ADNI is to test whether serial MRI, PET, other biological markers, and clinical and neuropsychological assessments can be com-bined to measure the progression of MCI and early AD. For up-to-date information, seewww. adni-info.org.
A total of 82 ADNI subjects (Subject IDs listed inS1 File) were included in this study. Thirty-four and 48 subjects were diagnosed normal control (NC) and MCI at baseline, respec-tively. These subjects were followed for up to 96 months to ascertain the diagnosed status and progression (mean = 76.7 months; median = 84 months). To the best of our knowledge, this is a longest longitudinal study focusing on PET biomarkers from ADNI database.
All the subjects had baseline and follow-up FDG data. All18F-AV45 and11C-PiB PET scans for amyloid-βimaging were added in follow-up studies. Structural MRIs (1.5T or 3T, magneti-zation-prepared rapid acquisition gradient echo (MP-RAGE) were collected for each baseline and follow-up. Demographics, Apolipoprotein E (APOE) genotypes and CSF measurements, as well as clinical assessments were also downloaded from ADNI database.
Status of subject: cognitively normal, MCI, and AD
The detailed criteria for each status and overall study protocol can be found atwww.adni-info. org. In short, cognitively normal subjects had Mini-Mental State Exam (MMSE) scores between 24 and 30 inclusively, a Clinical Dementia Rating (CDR) of zero, were non-depressed, non-MCI, and non-demented. MCI subjects had MMSE scores between 24 and 30 (inclusive), a memory complaint, objective memory loss, a CDR score of 0.5, absence of significant impairment in other cognitive domains, and preserved activities of daily living. AD subjects presented with MMSE scores ranging from 20 to 26 inclusively, a CDR0.5, and met the NINCDS/ADRDA criteria [13] for probable AD.
(www.fnih.org). The grantee organization is the Northern California Institute for Research and Education, and the study is coordinated by the Alzheimer's Disease Cooperative Study at the University of California, San Diego. ADNI data are disseminated by the Laboratory for Neuro Imaging at the University of Southern California. There are no patents, products in development or marketed products to declare. This does not alter the authors’
Cognitive assessments
Besides MMSE, the cognitive assessments also included Alzheimer’s Disease Assessment Scale-Cognitive Sub-scale (ADAS-Cog). ADAS-Cog TOTAL 11 contains eleven items including word recall, recognition, naming, etc. (range 0–70) and ADAS-Cog Total Mod includes all the eleven items plus delayed word recall and number cancellation (range 0–85).
CSF biomarkers: A
β
, t-tau, p-tau, t-tau/A
β
, p-tau/A
β
CSF was acquired by lumbar puncture and the methods for collection of CSF samples are described athttp://adni.loni.usc.edu/methods/documents/. The levels of CSF Aβ, t-tau, and p-tau were measured using the multiplex xMAP Luminex platform (Luminex Corp., Austin, TX) with Innogenetics (INNOBIA AlzBio3; Ghent, Belgium; for research-use only reagents) immu-noassay kit-based reagent. The variables of CSF biomarker were Aβ, t-tau, p-tau, and ratios of t-tau/Aβand p-tau/Aβ.
Image acquisition, processing, and quantification
All FDG,18F-AV45 and11C-PiB PET scans were downloaded fromhttp://adni.loni.usc.edu/as the pre-processed format (co-registered, averaged, standardized image and voxel size, uniform resolution). The detailed methods could be found at http://adni.loni.usc.edu/methods-/pet-analysis/pre-processing/. Briefly, the separate PET frames were aligned to one another, aver-aged, reoriented and then interpolated into a standard image and voxel size (image volume 160×160×96, 1.5x1.5x1.5 mm in x, y, z). Lastly, all the PET images were smoothed to a uniform resolution of 8 mm in full width at half maximum (FWHM).
The downloaded PET and MRI images were then processed using Statistical Parametric Mapping software (SPM8, Wellcome Department of Imaging Neuroscience, London, United Kingdom) and MATLAB (The MathWorks Inc.). All preprocessed mean PET images were cor-egistered to structural MRI images at each follow up. The MRI images were normalized to stan-dard Montreal Neurologic Institute (MNI) space using SPM8 with a MRI template provided by VBM8 toolbox [14,15], and the transformation parameters determined by MRI spatial nor-malization were then applied to the coregistered PET images for PET spatial nornor-malization. A total of 34 regions of interest (ROIs) were manually drawn on the MRI template using PMOD software (PMOD Technologies Ltd., Zürich, Switzerland) in standard MNI space. A global cor-tex was defined as a union of orbital frontal, prefrontal, superior frontal, lateral temporal, parie-tal, posterior precuneus, occipiparie-tal, anterior cingulate, and posterior cingulate. The ROI of cerebellum gray matter was used as reference tissue, and the 34 ROIs including cerebellum were used as template ROIs for all subjects in the standard MNI space. Standard uptake value ratio (SUVR) images relative to the cerebellum ROI for18F-FDG,18F-AV45, and11C-PiB were calculated in the MNI space (image volume: 121x145x121, voxel size: 1.5x1.5x15 mm in x, y, z). ROI SUVRs were obtained by applying ROIs to SUVR images.
Statistical analyses
status of subjects from ADNI. In the NC group, the dichotomous variable indicated negative for those cognitively normal and positive for those converted to MCI or AD status. In the MCI group, the dichotomous variable indicated positive for those in MCI who converted to AD. In general, a test is acceptable in clinical efficacy if its AUC of ROC is not less than 0.70 [27–30]. First, the diagnostic values of FDG,18F-AV45, and11C-PiB in predicating AD progression were evaluated separately for each ROIs. In contrast to PET biomarkers, the accuracy of CSF biomarkers and clinical assessments for monitoring AD progression were also studied by ROC analysis. To investigate if multi-biomarker measurements improve the accuracy in monitoring the AD progression, a logistic regression model with stepwise regression was used to determine the optimal model to predict the disease progression. First, we tested the combination of cogni-tive assessments with SUVR of FDG or amyloid-βPET imaging, with or without CSF biomark-ers in the logistic model. In this model, all the biomarker variables were collected at the same visit. Then the18F-FDG data was combined either with18F-AV45 or11C-PiB to establish a pre-diction model for each group to discriminate the conversion.
Statistical analyses were carried out using IBM SPSS 21.0 and MedCalc 15.2.2. Statistical sig-nificance was set at p<0.05 and all tests were two-sided.
Results
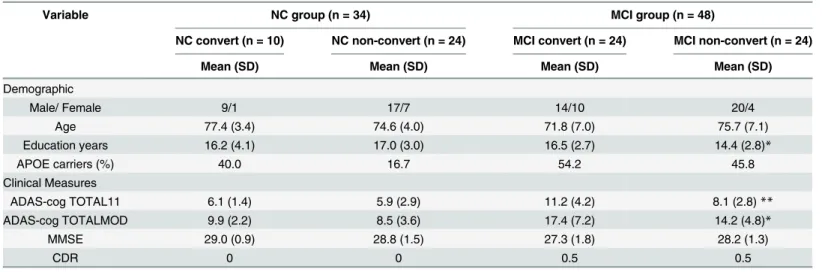
The demographic information and simple statistics of clinical assessments for all subjects at baseline visit are summarized inTable 1. During the study period, ten out of 34 NC subjects were converted to MCI or AD, and 24 out of 48 MCI subjects were converted to AD. In the NC group, there was no difference between converters and non-converters in age, gender, educa-tion, APOE carriers, and three clinical assessments at baseline. In the MCI group, in addition to the significant higher educations (p<0.05) in education years, the converters in MCI group had significant higher ADAS-cog TOTAL 11 (p<0.05) and ADAS-cog TOTMOD (p<0.01) scores than non-converters at baseline. We also tested all the regions of SUVR for FDG at base-line and found that none of the ROI SUVRs showed significant difference between converters and non-converters in both NCs and MCI group.
Table 1. Demographic and statistics of clinical assessments at baseline.
Variable NC group (n = 34) MCI group (n = 48)
NC convert (n = 10) NC non-convert (n = 24) MCI convert (n = 24) MCI non-convert (n = 24)
Mean (SD) Mean (SD) Mean (SD) Mean (SD)
Demographic
Male/ Female 9/1 17/7 14/10 20/4
Age 77.4 (3.4) 74.6 (4.0) 71.8 (7.0) 75.7 (7.1)
Education years 16.2 (4.1) 17.0 (3.0) 16.5 (2.7) 14.4 (2.8)*
APOE carriers (%) 40.0 16.7 54.2 45.8
Clinical Measures
ADAS-cog TOTAL11 6.1 (1.4) 5.9 (2.9) 11.2 (4.2) 8.1 (2.8)**
ADAS-cog TOTALMOD 9.9 (2.2) 8.5 (3.6) 17.4 (7.2) 14.2 (4.8)*
MMSE 29.0 (0.9) 28.8 (1.5) 27.3 (1.8) 28.2 (1.3)
CDR 0 0 0.5 0.5
Note: NC: cognitively normal control (NC), MCI: mild cognitive impairment, ADAS-cog: Alzheimer’s Disease Assessment Scale-Cognitive Sub-scale, CDR: clinical dementia rating.
*p<0.05
**p<0.01.
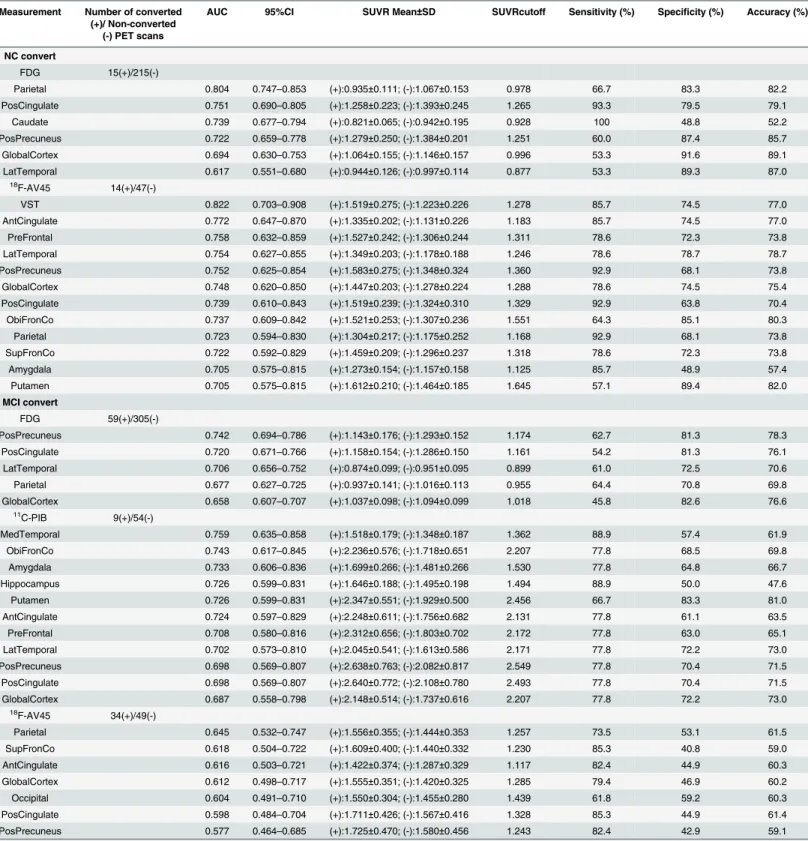
The results of ROC analysis for each PET ROI SUVRs are summarized inTable 2. The FDG SUVRs of parietal, posterior cingulate, posterior precuneus, and caudate obtained significant prediction value for NC to MCI conversion (AUC>0.70). Among the 4 ROIs, the caudate had lowest specificity (48.8%) and accuracy (52.2%). The highest (specificity, accuracy) were attained by the posterior precunneus (87.4%, 85.7%), followed by parietal (83.3%, 82.2%), and posterior cingulate (79.5%, 79.1%). Most cortex ROIs of18F-AV45 were identified for predicat-ing NC to MCI conversion, and AUC of the global cortex was 0.748 with both high sensitivity (78.6%) and specificity (74.5%), and the corresponding cut off value was 1.288 (Table 2). The highest sensitivity of18F-AV45 was attained in the parietal, posterior cingulate, and posterior precuneus (92.9%). The ventral striatum (VST) obtained the highest AUC (0.822) with (85.7%, 74.5%) (sensitivity, specificity).11C-PiB was not included inTable 2for NC group, because all of the initial11C-PiB scans in the study were conducted on those NC non-converters (or NC converters but before conversion) and MCIs. For MCI to AD, the ROI FDG SUVRs of the pos-terior precuneus, pospos-terior cingulate, and lateral temporal provided high specificity (72.5% to 81.3%) and accuracy (70.6% to 78.3%). For11C-PiB ROI SUVRs, the medial temporal, orbital frontal, prefrontal, anterior cingulate, lateral temporal, amygdala, hippocampus, and putamen had AUC>0.700 (Table 2). The highest sensitivities were obtained in the medial temporal and hippocampus (88.9%), followed by the global cortex (77.8%) with SUVR cut-off at 2.207. However, lower specificity and accuracy were also found in the medial temporal (57.4%, 61.9%) and hippocampus (50.0%, 47.6%). In contrast, the AUC values for all18F-AV45 ROI SUVR were less than 0.700 with poor performance in specificity for predicating MCI conver-sion. The sensitivity and specificity of18F-AV45 for the global cortex was (79.4%, 46.9%) and with as low as 0.612 of AUC. Note that the posterior precunneus, and posterior cingulate FDG were identified to have significant predicating values (AUC>0.72) for both NC to MCI and MCI to AD conversion. It is also worth noting that the parietal, posterior precunneus, and pos-terior cingulate SUVRs of both FDG and18F-AV45 attained significant predicating values (AUC>0.72) for predicating NC to MCI conversion, and the lateral temporal SUVRs of both
18F-FDG and11C-PiB were identified (AUC>0.70) for predicating MCI to AD conversion.
As listed inTable 3for ROC analysis of CSF biomarkers and clinical assessments, CSF Aβ
showed highest AUC (0.850) with (100.0%, 82.1%) (sensitivity, specificity) for NC to MCI con-version. For MCI to AD, t-tau was the only significant CSF biomarker (AUC>0.70) with 93.3% sensitivity and 43.6% specificity. All three clinical assessments had poor sensitivity (42.9% to 53.3%) for predicating NC to MCI conversion, but they all attained high AUC (0.868 to 0.916), as well as sensitivity (83.6% to 86.2%) and specificity (84.1% to 85.8%) for predicating MCI to AD conversion.
In the first logistic regression analysis of combined PET biomarkers and clinical assess-ments, the ROI SUVR of each three PET measurements (FDG,18F-AV45 and11C-PiB) was entered separately with the three clinical assessments, MMSE, ADAS-cog TOTAL11, and ADAS-cog TOTALMOD. The following three models were identified:
A: Logit(P) = 1.624+0.284
(ADAScogTOTALMOD)+7.832
FDG(PosPrecuneus)-17.957FDG(Parietal)
B: Logit(P) = 15.467+0.084
(ADAScogTOTALMOD)-0.553
(MMSE)-3.950
FDG (PosCingulate)
C: Logit(P) = 3.847–0.634
(MMSE)+7.19211C-PiB(MedTemporal).
Table 2. PET biomarker- and ROI-specific efficacy in predicating Alzheimer’s disease progression.
Measurement Number of converted (+)/ Non-converted
(-) PET scans
AUC 95%CI SUVR Mean±SD SUVRcutoff Sensitivity (%) Specificity (%) Accuracy (%)
NC convert
FDG 15(+)/215(-)
Parietal 0.804 0.747–0.853 (+):0.935±0.111; (-):1.067±0.153 0.978 66.7 83.3 82.2
PosCingulate 0.751 0.690–0.805 (+):1.258±0.223; (-):1.393±0.245 1.265 93.3 79.5 79.1
Caudate 0.739 0.677–0.794 (+):0.821±0.065; (-):0.942±0.195 0.928 100 48.8 52.2
PosPrecuneus 0.722 0.659–0.778 (+):1.279±0.250; (-):1.384±0.201 1.251 60.0 87.4 85.7
GlobalCortex 0.694 0.630–0.753 (+):1.064±0.155; (-):1.146±0.157 0.996 53.3 91.6 89.1
LatTemporal 0.617 0.551–0.680 (+):0.944±0.126; (-):0.997±0.114 0.877 53.3 89.3 87.0
18
F-AV45 14(+)/47(-)
VST 0.822 0.703–0.908 (+):1.519±0.275; (-):1.223±0.226 1.278 85.7 74.5 77.0
AntCingulate 0.772 0.647–0.870 (+):1.335±0.202; (-):1.131±0.226 1.183 85.7 74.5 77.0
PreFrontal 0.758 0.632–0.859 (+):1.527±0.242; (-):1.306±0.244 1.311 78.6 72.3 73.8
LatTemporal 0.754 0.627–0.855 (+):1.349±0.203; (-):1.178±0.188 1.246 78.6 78.7 78.7
PosPrecuneus 0.752 0.625–0.854 (+):1.583±0.275; (-):1.348±0.324 1.360 92.9 68.1 73.8
GlobalCortex 0.748 0.620–0.850 (+):1.447±0.203; (-):1.278±0.224 1.288 78.6 74.5 75.4
PosCingulate 0.739 0.610–0.843 (+):1.519±0.239; (-):1.324±0.310 1.329 92.9 63.8 70.4
ObiFronCo 0.737 0.609–0.842 (+):1.521±0.253; (-):1.307±0.236 1.551 64.3 85.1 80.3
Parietal 0.723 0.594–0.830 (+):1.304±0.217; (-):1.175±0.252 1.168 92.9 68.1 73.8
SupFronCo 0.722 0.592–0.829 (+):1.459±0.209; (-):1.296±0.237 1.318 78.6 72.3 73.8
Amygdala 0.705 0.575–0.815 (+):1.273±0.154; (-):1.157±0.158 1.125 85.7 48.9 57.4
Putamen 0.705 0.575–0.815 (+):1.612±0.210; (-):1.464±0.185 1.645 57.1 89.4 82.0
MCI convert
FDG 59(+)/305(-)
PosPrecuneus 0.742 0.694–0.786 (+):1.143±0.176; (-):1.293±0.152 1.174 62.7 81.3 78.3
PosCingulate 0.720 0.671–0.766 (+):1.158±0.154; (-):1.286±0.150 1.161 54.2 81.3 76.1
LatTemporal 0.706 0.656–0.752 (+):0.874±0.099; (-):0.951±0.095 0.899 61.0 72.5 70.6
Parietal 0.677 0.627–0.725 (+):0.937±0.141; (-):1.016±0.113 0.955 64.4 70.8 69.8
GlobalCortex 0.658 0.607–0.707 (+):1.037±0.098; (-):1.094±0.099 1.018 45.8 82.6 76.6
11
C-PIB 9(+)/54(-)
MedTemporal 0.759 0.635–0.858 (+):1.518±0.179; (-):1.348±0.187 1.362 88.9 57.4 61.9
ObiFronCo 0.743 0.617–0.845 (+):2.236±0.576; (-):1.718±0.651 2.207 77.8 68.5 69.8
Amygdala 0.733 0.606–0.836 (+):1.699±0.266; (-):1.481±0.266 1.530 77.8 64.8 66.7
Hippocampus 0.726 0.599–0.831 (+):1.646±0.188; (-):1.495±0.198 1.494 88.9 50.0 47.6
Putamen 0.726 0.599–0.831 (+):2.347±0.551; (-):1.929±0.500 2.456 66.7 83.3 81.0
AntCingulate 0.724 0.597–0.829 (+):2.248±0.611; (-):1.756±0.682 2.131 77.8 61.1 63.5
PreFrontal 0.708 0.580–0.816 (+):2.312±0.656; (-):1.803±0.702 2.172 77.8 63.0 65.1
LatTemporal 0.702 0.573–0.810 (+):2.045±0.541; (-):1.613±0.586 2.171 77.8 72.2 73.0
PosPrecuneus 0.698 0.569–0.807 (+):2.638±0.763; (-):2.082±0.817 2.549 77.8 70.4 71.5
PosCingulate 0.698 0.569–0.807 (+):2.640±0.772; (-):2.108±0.780 2.493 77.8 70.4 71.5
GlobalCortex 0.687 0.558–0.798 (+):2.148±0.514; (-):1.737±0.616 2.207 77.8 72.2 73.0
18
F-AV45 34(+)/49(-)
Parietal 0.645 0.532–0.747 (+):1.556±0.355; (-):1.444±0.353 1.257 73.5 53.1 61.5
SupFronCo 0.618 0.504–0.722 (+):1.609±0.400; (-):1.440±0.332 1.230 85.3 40.8 59.0
AntCingulate 0.616 0.503–0.721 (+):1.422±0.374; (-):1.287±0.329 1.117 82.4 44.9 60.3
GlobalCortex 0.612 0.498–0.717 (+):1.555±0.351; (-):1.420±0.325 1.285 79.4 46.9 60.2
Occipital 0.604 0.491–0.710 (+):1.550±0.304; (-):1.455±0.280 1.439 61.8 59.2 60.3
PosCingulate 0.598 0.484–0.704 (+):1.711±0.426; (-):1.567±0.416 1.328 85.3 44.9 61.4
PosPrecuneus 0.577 0.464–0.685 (+):1.725±0.470; (-):1.580±0.456 1.243 82.4 42.9 59.1
Note: ROI: region of interest; NC: cognitively normal control (NC), MCI: mild cognitive impairment, ADAS-cog: Alzheimer’s Disease Assessment Scale-Cognitive Sub-scale, PosCingulate: posterior cingulate; PosPrecuneus: posterior precuneus; VST: ventral striatum; AntCingulate: anterior cingulate; PreFrontal: prefrontal cortex; LatTemporal: lateral temporal cortex; GlobalCortex: union of orbital frontal, prefrontal, superior frontal, lateral temporal, parietal, posterior precuneus, occipital, anterior cingulate, and posterior cingulate; ObiFronCo: orbital frontal cortex; SupFronCo: superior frontal cortex; MedTemporal: medial temporal cortex.
Table 3. Diagnostic potential of CSF biomarkers and clinical assessments in predicating Alzheimer’s disease progression.
Measurement AUC 95%CI cutoff Sensitivity (%) Specificity (%) Accuracy (%)
NC convert CSF
Aβ 0.850 0.735–0.929 171.3 (pg/ml) 100 82.1 83.6
p-tau/ Aβ 0.725 0.590–0.836 0.145 100 60.8 64.0
t-tau/ Aβ 0.685 0.551–0.800 0.360 100 59.3 62.7
p-tau 0.604 0.464–0.732 24.2 (pg/ml) 100 47.1 51.8
t-tau 0.574 0.437–0.703 62.7 (pg/ml) 100 47.2 51.8
Cognitive
ADAS-cog TOTALMOD 0.782 0.723–0.834 16.00 53.3 97.7 94.8
ADAS-cog TOTAL11 0.753 0.692–0.807 10.67 46.7 96.7 93.5
MMSE 0.690 0.625–0.750 27 42.9 92.0 89.0
MCI convert CSF
t-tau 0.730 0.617–0.25 74 (pg/ml) 93.3 43.6 53.2
t-tau/ Aβ 0.667 0.552–0.769 1.078 43.7 87.3 78.5
p-tau 0.654 0.523–0.771 33 (pg/ml) 82.4 51.1 59.7
p-tau/ Aβ 0.644 0.513–0.762 0.168 88.2 40.0 53.2
Aβ 0.626 0.510–0.731 127.9 (pg/ml) 52.9 79.4 73.8
Cognitive
MMSE 0.916 0.883–0.943 25.00 83.6 85.4 85.2
ADAS-cog TOTALMOD 0.887 0.850–0.918 22.67 86.2 85.8 85.8
ADAS-cog TOTAL11 0.868 0.829–0.901 13.67 84.5 84.1 84.2
Note: NC: cognitively normal control, MCI: mild cognitive impairment, ADAS-cog: Alzheimer’s Disease Assessment Scale-Cognitive Sub-scale, AUC: area under curve of receiver operating characteristic.
doi:10.1371/journal.pone.0154406.t003
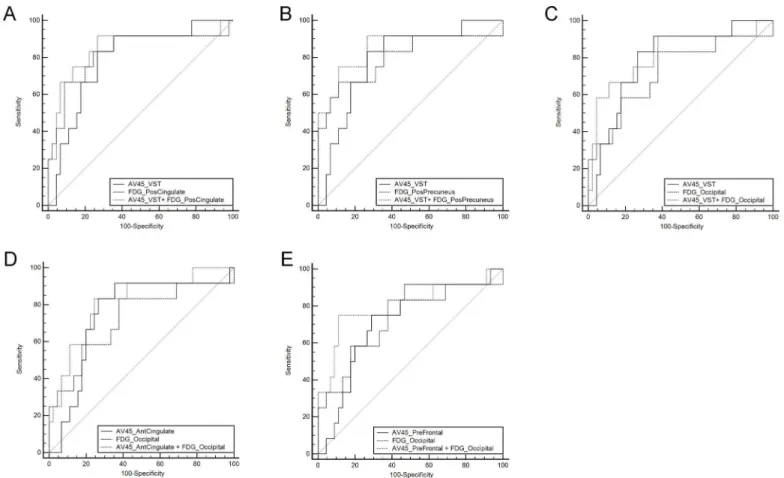
Fig 1. Receiver operating characteristic curves generated from logistic regression models of combined biomarkers for predicting conversions in cognitively normal control (NC) and mild cognitive impairment (MCI) groups.(A) ROCs of model A, ADAS-cog TOTALMOD, 18
F-FDG SUVR of posterior precuneus and parietal for conversion from NC to MCI. (B) ROCs of model B, ADAS-cog TOTALMOD, MMSE and 18F-FDG SUVR of posterior cingulate for conversion from MCI to AD. (C) ROCs of model C, MMSE, and11C-PiB SUVR of medial temporal for conversion from MCI to AD. The logistic regression models: Model A: Logit(P) = 1.624+0.284*(ADAScogTOTALMOD)+7.832*FDG
(PosPrecuneus)-17.957*FDG(Parietal); Model B: Logit(P) = 15.467+0.084*(ADAScogTOTALMOD)-0.553*(MMSE)-3.950*FDG(PosCingulate); Model C: Logit(P) = 3.847–0.634*(MMSE)+7.192*11C-PiB (MedTemporal). PosCingulate: posterior cingulate; PosPrecuneus: posterior precuneus; MedTemporal: mesial temporal cortex.
were (0.877, 80.0%, 94.9%), (0.932, 96.4%, 81.2%), and (0.915, 77.8%, 90.4%), respectively. The AUC of Model A was significantly higher than AUC of ADAS-cog TOTALMOD (p<0.01). Model B improved AUC significantly in contrast to each of its components for predication of MCI conversion (p<0.01 for ADAS-cog TOTALMOD and FDG posterior cingulate, and p<0.03 for MMSE). The AUC for Model C is only significantly higher than the AUC of
11C-PiB medial temporal SUVR. Adding the CSF concentration and APOEε4 did not bring
additional benefit to the stepwise logistic regression models.
In the second logistic regression analysis, most of the scans we chose as pairs were conducted at the same visit (137 pairs of18F-FDG and18F-AV45: only four pairs had 1-year intervals 81 pairs of18F-FDG and11C-PiB: only two pairs had 1-year intervals). Five significantly improved (p<0.05) logistic regression models were identified for using18F-FDG and18F-AV45 to predicate NC conversion (Fig 2). However, the improvements of AUC in the 5 identified models were not statistically significant (p>0.05). When18F-FDG combined with18F-AV45 or11C-PiB for predi-cating MCI conversion, neither was significant in the logistic regression model.
Discussion
According to the current research, the decline of clinical function may appear years after the changes of PET imaging or CSF data [11,31]. That means when the clues of conversion from imaging were observed, the clinical symptoms may not present at the same visit time. Taking this feature of progression into consideration, the longitudinal study was intended to accurately evaluate the value of biomarkers over time. Several studies also using ADNI data have been working on the predictive value of different measurements and achieving quite meaningful results [20,32,33]. Compared to a relatively short follow-up study [32], our study added more Table 4. Diagnostic values of combined PET biomarkers and clinical assessments in predicating Alzheimer’s disease progression.
Variables AUC 95%CI Sensitivity (%) Specificity (%) Accuracy (%) Compared with the combined variable
Z statistics P level
NC convert
ADAScogTOTALMOD 0.782 0.723–0.834 53.3 97.7 94.8 2.582 0.0098**
PosPrecuneus of FDG 0.722 0.659–0.779 60.0 87.4 85.6 1.324 0.1855
Parietal of FDG 0.804 0.747–0.854 66.7 83.3 82.2 0.860 0.3900
Model A 0.877 0.827–0.916 80.0 94.9 93.9
MCI convert
ADAScogTOTALMOD 0.898 0.861–0.927 86.2 85.4 85.5 2.587 0.0097**
MMSE 0.916 0.882–0.943 83.6 85.1 84.9 2.202 0.0277*
PosCingulate of FDG 0.726 0.676–0.772 54.4 79.9 75.7 5.127 <0.0001**
Model B 0.932 0.901–0.956 96.4 81.2 83.6
MMSE 0.870 0.759–0.942 77.8 78.8 78.7 1.173 0.2409
MedTemporal of PiB 0.759 0.632–0.859 88.9 57.4 61.9 1.989 0.0467*
Model C 0.915 0.814–0.971 77.8 90.4 88.5
Note: NC: cognitively normal control (NC), MCI: mild cognitive impairment, ADAS-cog: Alzheimer’s Disease Assessment Scale-Cognitive Sub-scale, AUC: area under curve, PosCingulate: posterior cingulate; PosPrecuneus: posterior precuneus. The 3 logistic regression models are listed below in detail: Model A: Logit(P) = 1.624+0.284*(ADAScogTOTALMOD)+7.832*FDG(PosPrecuneus)-17.957*FDG(Parietal); Model B: Logit(P) = 15.467+0.084* (ADAScogTOTALMOD)-0.553*(MMSE)-3.950*FDG (PosCingulate); Model C: Logit(P) = 3.847–0.634*(MMSE)+7.192*11C-PiB (MedTemporal). *p<0.05
**p<0.01.
value in monitoring and predicting AD progression. Additionally, the inclusion of subjects in our study was based on the database with more available longitudinal PET imaging data, which was different from previous studies focusing on other biomarkers.
APOEε4 is one of the most prominent genotypes in the onset of AD and has effects on other biomarkers like CSF levels of Aβ42 [34]. As an inherent genetic biomarker, the copies of APOEε4 alleles do not differ from conversion vs. non-conversion at baseline in our study, which was similar with previous result [35]. However, the number of subjects with APOEε4 carriers in the NC group was significantly lower than subjects in the MCI or AD group in the study (results not shown).
In the study, the cerebellum was chosen as the reference region for PET quantification, as it is commonly believed that FDG uptake in the cerebellum is not affected in MCI and AD, and that amyloid-βbinding in the cerebellum is negligible in MCI and AD [36]. Quantitative FDG PET has been widely used in metabolic imaging of Alzheimer’s disease. Besides SUVR with conventional ROI determined by manually or templates, several other measurements, such as hypometabolic convergence index (HCI) [37,38] and statistical-based clusters derived from FDG PET imaging, also helped in characterizing and predicting the AD progression. Regions Fig 2. Receiver operating characteristic curves (ROCs) generated from logistic regression models of combined biomarkers of18F-FDG and 18F-AV45 for predicting conversions in cognitively normal control subjects.(A) ROCs of model A,18F-AV45(VST) and FDG(PosCingulate). (B) ROCs of model B,18F-AV45(VST), and FDG(PosPrecuneus). (C) ROCs of model C,18F-AV45(VST), and FDG(Occipital). (D) ROCs of model C, AV45 (AntCingulate), and FDG(Occipital). (E) ROCs of model E,18F-AV45(PreFrontal), and FDG(Occipital). The models A to E are expressed as below: Model A: Logit(P) = 6.580+2.724*18F-AV45(VST)-9.105*FDG(PosCingulate); Model B Logit(P) = 6.773+2.909*18F-AV45(VST)-9.332*FDG
(PosPrecuneus); Model C: Logit(P) = 3.048+3.495*18F-AV45(VST)-7.959*FDG(Occipital); Model D: Logit(P) = 3.739+3.947*18 F-AV45(AntCingulate)-8.735*FDG(Occipital); Model E: Logit(P) = 4.063+3.005*18F-AV45(PreFrontal)-8.468*FDG(Occipital). PosCingulate: posterior cingulate;
PosPrecuneus: posterior precuneus; VST: ventral striatum; AntCingulate: anterior cingulate; PreFrontal: prefrontal cortex.
associated with metabolic reduction in AD were mostly found in temporoparietal association cortices, and temporoparietal and posterior cingulate proved to be the target areas for diagnosis and monitoring AD progression [36,39]. Hypometabolism of the posterior precuneus was also reported in several MCI conversion studies [40,41]. Our results also clearly demonstrated that the parietal seemed to be the best indicator region in early phase of conversion, while posterior precuneus and cingulate were the regions with higher AUC and predictive value in MCI to AD, which were of potential clinical value for the diagnosis of AD progression.
For the amyloid imaging analysis, a high correlation between18F-AV45 and11C-PiB regions was confirmed by previous studies [12,42]. Increased amyloid deposition was discovered in the frontal, temporal, parietal, cingulate, precuneus and striatum by other researchers [43,44]. Note that the ability of these two tracers and their associated regions differed in our study: regions of11C-PiB imaging acted effectively in distinguishing MCI converters from non-con-verters, and regions of18F-AV45 imaging were sensitive to detect early stages of disease pro-gression in the NC group. This could be due to the difference in studied population and scan time difference between the two tracers in the study.
In the study we demonstrated that11C-PiB ROI SUVRs had high predictive value for MCI conversion to AD, which was consistent with other studies [19,45]. It was reported that the best predicted region in11C-PiB to discriminate AD from MCI was the lateral frontal cortex with an AUC of 0.86, 65% sensitivity and 75% specificity [19], which was higher than the ROI AUC values in our study. However, the limited 29 subjects and limited 2-year follow-up time should be taken into consideration when comparing the two studies [46].
In the18F-AV45 imaging section ofTable 2, more regions showed predictive significance in the NC progression. Among them, the VST indicated the highest AUC (0.822), sensitivity (85.7%) and specificity (74.5%). This was consistent with the results that amyloid deposition may begin in the striatum area [47,48]. All ROI AUCs of18F-AV45 for monitoring the MCI to AD progression were less than 0.7, which is usually considered as low predictive value in ROC analysis. Although there was still no conclusive opinion for the performance of predicting MCI conversion, several previous studies have highlighted the usefulness of18F-AV45 in differenti-ating AD vs NC [49,50].
From the single variable analysis of CSF biomarkers, CSF Aβ, and ratio of p-tau to Aβworked well as predictors in the NC group, whilst CSF t-tau provided high sensitivity in predicating MCI conversion. However, in the logistic regression analysis, only PET biomarkers were selected in the models for prediction NC and MCI conversion. Note that our database was based on the PET imaging scans, and only about 60% of the subjects had CSF data. This may explain why the results did not improve significantly by adding CSF data, and CSF biomarkers were excluded in the final logistic model for progression. Previous studies showed that the multiparametric mea-surements with CSF information improved accuracy in predicating AD progression [33,35].
The combined ADAS-cog, MMSE and FDG SUVR of the posterior cingulate was identified as the best multiparametric input model for MCI conversion with AUC of 0.932, and the improvement was more significant than any single input ROC analysis. In the second logistic regression analysis for studying the possible improvements, there was not any significant improvement in AUC when combining FDG with18F-AV45 or11C-PiB and single PET input. The improvements did not reach the statistical p value of 0.05, but it is worth further to be investigated in the ongoing project.
Conclusions
significant prediction value for early diagnosis of AD, while11C-PiB is suggested for monitor-ing the disease progression at late stage AD. Quantitative FDG and11C-PiB PET with clinical cognitive assessments significantly improved accuracy in the predication of AD progression.
Supporting Information
S1 File. The 82 subject IDS.The list of 82 subject IDs used for downloading from ADNI data-base (http://adni.loni.usc.edu) were listed in S1 File.
(DOCX)
Acknowledgments
Data used in preparation of this article were obtained from the Alzheimer’s Disease Neuroim-aging Initiative (ADNI) database (adni.loni.usc.edu). As such, the investigators within the ADNI contributed to the design and implementation of ADNI and/or provided data but did not participate in analysis or writing of this report. A complete listing of ADNI investigators can be found at:http://adni.loni.usc.edu/wpcontent/uploads/how_to_apply/-ADNI_ Acknowledgement_List.pdf
Data collection and sharing for this project was funded by the Alzheimer's Disease Neuro-imaging Initiative (ADNI) (National Institutes of Health Grant U01 AG024904) and DOD ADNI (Department of Defense award number W81XWH-12-2-0012). ADNI is funded by the National Institute on Aging, the National Institute of Biomedical Imaging and Bioengineering, and through generous contributions from the following: Alzheimer’s Association; Alzheimer’s Drug Discovery Foundation; Araclon Biotech; BioClinica, Inc.; Biogen Idec Inc.; Bristol-Myers Squibb Company; Eisai Inc.; Elan Pharmaceuticals, Inc.; Eli Lilly and Company; EuroImmun; F. Hoffmann-La Roche Ltd and its affiliated company Genentech, Inc.; Fujirebio; GE Health-care;; IXICO Ltd.; Janssen Alzheimer Immunotherapy Research & Development, LLC.; John-son & JohnJohn-son Pharmaceutical Research & Development LLC.; Medpace, Inc.; Merck & Co., Inc.; Meso Scale Diagnostics, LLC.; NeuroRx Research; Neurotrack Technologies; Novartis Pharmaceuticals Corporation; Pfizer Inc.; Piramal Imaging; Servier; Synarc Inc.; and Takeda Pharmaceutical Company. The Canadian Institutes of Health Research is providing funds to support ADNI clinical sites in Canada. Private sector contributions are facilitated by the Foun-dation for the National Institutes of Health (www.fnih.org). The grantee organization is the Northern California Institute for Research and Education, and the study is coordinated by the Alzheimer's Disease Cooperative Study at the University of California, San Diego. ADNI data are disseminated by the Laboratory for Neuro Imaging at the University of Southern
California.
This work of the author was in part supported by the China Scholarship Council (No. 201406010242).
Author Contributions
Conceived and designed the experiments: Alzheimer’s Disease Neuroimaging Initiative (ADNI). Performed the experiments: Alzheimer’s Disease Neuroimaging Initiative (ADNI). Analyzed the data: XC YZ HC RG DH. Contributed reagents/materials/analysis tools: RW HC. Wrote the paper: XC YZ SR.
References
2. Hebert LE, Weuve J, Scherr PA, Evans DA. Alzheimer disease in the United States (2010–2050) esti-mated using the 2010 census. Neurology. 2013; 80(19):1778–83. doi:10.1212/WNL.
0b013e31828726f5PMID:23390181
3. Jessen F, Wolfsgruber S, Wiese B, Bickel H, Mosch E, Kaduszkiewicz H, et al. AD dementia risk in late MCI, in early MCI, and in subjective memory impairment. Alzheimers Dement. 2014; 10(1):76–83. doi:
10.1016/j.jalz.2012.09.017PMID:23375567
4. Shaw LM, Vanderstichele H, Knapik-Czajka M, Clark CM, Aisen PS, Petersen RC, et al. Cerebrospinal fluid biomarker signature in Alzheimer's disease neuroimaging initiative subjects. Ann Neurol. 2009; 65 (4):403–13. doi:10.1002/ana.21610PMID:19296504
5. Albert MS, DeKosky ST, Dickson D, Dubois B, Feldman HH, Fox NC, et al. The diagnosis of mild cogni-tive impairment due to Alzheimer's disease: recommendations from the National Institute on Aging-Alz-heimer's Association workgroups on diagnostic guidelines for AlzAging-Alz-heimer's disease. Alzheimers Dement. 2011; 7(3):270–9. doi:10.1016/j.jalz.2011.03.008PMID:21514249
6. Price JC. Molecular brain imaging in the multimodality era. J Cereb Blood Flow Metab. 2012; 32 (7):1377–92. doi:10.1038/jcbfm.2012.29PMID:22434068
7. Herholz K, Carter SF, Jones M. Positron emission tomography imaging in dementia. Br J Radiol. 2007; 80 Spec No 2:S160–7. doi:10.1259/bjr/97295129PMID:18445746
8. Ikonomovic MD, Klunk WE, Abrahamson EE, Mathis CA, Price JC, Tsopelas ND, et al. Post-mortem correlates of in vivo PiB-PET amyloid imaging in a typical case of Alzheimer's disease. Brain. 2008; 131 (Pt 6):1630–45. doi:10.1093/brain/awn016PMID:18339640
9. Choi SR, Schneider JA, Bennett DA, Beach TG, Bedell BJ, Zehntner SP, et al. Correlation of amyloid PET ligand florbetapir F 18 binding with Abeta aggregation and neuritic plaque deposition in postmor-tem brain tissue. Alzheimer Dis Assoc Disord. 2012; 26(1):8–16. doi:10.1097/WAD.
0b013e31821300bcPMID:22354138
10. Bateman RJ, Xiong C, Benzinger TL, Fagan AM, Goate A, Fox NC, et al. Clinical and biomarker changes in dominantly inherited Alzheimer's disease. N Engl J Med. 2012; 367(9):795–804. doi:10. 1056/NEJMoa1202753PMID:22784036
11. Jack CJ, Knopman DS, Jagust WJ, Petersen RC, Weiner MW, Aisen PS, et al. Tracking pathophysio-logical processes in Alzheimer's disease: an updated hypothetical model of dynamic biomarkers. Lan-cet Neurol. 2013; 12(2):207–16. doi:10.1016/S1474-4422(12)70291-0PMID:23332364
12. Landau SM, Thomas BA, Thurfjell L, Schmidt M, Margolin R, Mintun M, et al. Amyloid PET imaging in Alzheimer's disease: a comparison of three radiotracers. Eur J Nucl Med Mol Imaging. 2014; 41 (7):1398–407. doi:10.1007/s00259-014-2753-3PMID:24647577
13. McKhann GM, Knopman DS, Chertkow H, Hyman BT, Jack CJ, Kawas CH, et al. The diagnosis of dementia due to Alzheimer's disease: recommendations from the National Institute on Aging-Alzhei-mer's Association workgroups on diagnostic guidelines for AlzheiAging-Alzhei-mer's disease. Alzheimers Dement. 2011; 7(3):263–9. doi:10.1016/j.jalz.2011.03.005PMID:21514250
14. Ashburner J, Friston KJ. Unified segmentation. Neuroimage. 2005; 26(3):839–51. PMID:15955494
15. Gaser C. Voxel based morphometry extension to SPM8. Available:http://www.neuro.uni-jena.de/vbm/ 2014/.
16. Greiner M, Pfeiffer D, Smith RD. Principles and practical application of the receiver-operating character-istic analysis for diagnostic tests. Prev Vet Med. 2000; 45(1–2):23–41. PMID:10802332
17. Youden WJ. Index for rating diagnostic tests. Cancer. 1950; 3(1):32–5. PMID:15405679
18. Schisterman EF, Perkins NJ, Liu A, Bondell H. Optimal cut-point and its corresponding Youden Index to discriminate individuals using pooled blood samples. Epidemiology. 2005; 16(1):73–81. PMID:
15613948
19. Bruck A, Virta JR, Koivunen J, Koikkalainen J, Scheinin NM, Helenius H, et al. [11C]PIB, [18F]FDG and MR imaging in patients with mild cognitive impairment. Eur J Nucl Med Mol Imaging. 2013; 40
(10):1567–72. doi:10.1007/s00259-013-2478-8PMID:23801168
20. Gomar JJ, Conejero-Goldberg C, Davies P, Goldberg TE. Extension and refinement of the predictive value of different classes of markers in ADNI: four-year follow-up data. Alzheimers Dement. 2014; 10 (6):704–12. doi:10.1016/j.jalz.2013.11.009PMID:24613706
21. Shaffer JL, Petrella JR, Sheldon FC, Choudhury KR, Calhoun VD, Coleman RE, et al. Predicting cogni-tive decline in subjects at risk for Alzheimer disease by using combined cerebrospinal fluid, MR imag-ing, and PET biomarkers. Radiology. 2013; 266(2):583–91. doi:10.1148/radiol.12120010PMID:
23232293
23. Leinonen V, Rinne JO, Wong DF, Wolk DA, Trojanowski JQ, Sherwin PF, et al. Diagnostic effective-ness of quantitative [(1)(8)F]flutemetamol PET imaging for detection of fibrillar amyloid beta using corti-cal biopsy histopathology as the standard of truth in subjects with idiopathic normal pressure
hydrocephalus. Acta Neuropathol Commun. 2014; 2:46. doi:10.1186/2051-5960-2-46PMID:
24755237
24. Herholz K, Evans R, Anton-Rodriguez J, Hinz R, Matthews JC. The effect of 18F-florbetapir dose reduc-tion on region-based classificareduc-tion of cortical amyloid deposireduc-tion. Eur J Nucl Med Mol Imaging. 2014; 41 (11):2144–9. doi:10.1007/s00259-014-2842-3PMID:25002030
25. Devanand DP, Mikhno A, Pelton GH, Cuasay K, Pradhaban G, Dileep KJ, et al. Pittsburgh compound B (11C-PIB) and fluorodeoxyglucose (18 F-FDG) PET in patients with Alzheimer disease, mild cognitive impairment, and healthy controls. J Geriatr Psychiatry Neurol. 2010; 23(3):185–98. doi:10.1177/ 0891988710363715PMID:20430977
26. Walhovd KB, Fjell AM, Brewer J, McEvoy LK, Fennema-Notestine C, Hagler DJ, et al. Combining MR imaging, positron-emission tomography, and CSF biomarkers in the diagnosis and prognosis of Alzhei-mer disease. AJNR Am J Neuroradiol. 2010; 31(2):347–54. doi:10.3174/ajnr.A1809PMID:20075088
27. Hosmer DW, Lemeshow S. Applied Logistic Regression. 2nd Ed ed. New York: Wiley; 2000. 28. Tan S, Kligerman S, Chen W, Lu M, Kim G, Feigenberg S, et al. Spatial-temporal [(1)(8)F]FDG-PET
features for predicting pathologic response of esophageal cancer to neoadjuvant chemoradiation ther-apy. Int J Radiat Oncol Biol Phys. 2013; 85(5):1375–82. doi:10.1016/j.ijrobp.2012.10.017PMID:
23219566
29. Viccaro LJ, Perera S, Studenski SA. Is timed up and go better than gait speed in predicting health, func-tion, and falls in older adults? J Am Geriatr Soc. 2011; 59(5):887–92. doi:10.1111/j.1532-5415.2011. 03336.xPMID:21410448
30. Tokuhashi Y, Uei H, Oshima M, Ajiro Y. Scoring system for prediction of metastatic spine tumor progno-sis. World J Orthop. 2014; 5(3):262–71. doi:10.5312/wjo.v5.i3.262PMID:25035829
31. Petersen RC, Roberts RO, Knopman DS, Boeve BF, Geda YE, Ivnik RJ, et al. Mild cognitive impairment: ten years later. Arch Neurol. 2009; 66(12):1447–55. doi:10.1001/archneurol.2009.266
PMID:20008648
32. Landau SM, Harvey D, Madison CM, Reiman EM, Foster NL, Aisen PS, et al. Comparing predictors of conversion and decline in mild cognitive impairment. Neurology. 2010; 75(3):230–8. doi:10.1212/WNL. 0b013e3181e8e8b8PMID:20592257
33. Dickerson BC, Wolk DA. Biomarker-based prediction of progression in MCI: Comparison of AD signa-ture and hippocampal volume with spinal fluid amyloid-beta and tau. Front Aging Neurosci. 2013; 5:55. doi:10.3389/fnagi.2013.00055PMID:24130528
34. Lautner R, Palmqvist S, Mattsson N, Andreasson U, Wallin A, Palsson E, et al. Apolipoprotein E geno-type and the diagnostic accuracy of cerebrospinal fluid biomarkers for Alzheimer disease. JAMA Psy-chiatry. 2014; 71(10):1183–91. doi:10.1001/jamapsychiatry.2014.1060PMID:25162367
35. Da X, Toledo JB, Zee J, Wolk DA, Xie SX, Ou Y, et al. Integration and relative value of biomarkers for prediction of MCI to AD progression: spatial patterns of brain atrophy, cognitive scores, APOE geno-type and CSF biomarkers. Neuroimage Clin. 2014; 4:164–73. doi:10.1016/j.nicl.2013.11.010PMID:
24371799
36. Herholz K. PET studies in dementia. Ann Nucl Med. 2003; 17(2):79–89. PMID:12790355
37. Chen K, Ayutyanont N, Langbaum JB, Fleisher AS, Reschke C, Lee W, et al. Characterizing Alzhei-mer's disease using a hypometabolic convergence index. Neuroimage. 2011; 56(1):52–60. doi:10. 1016/j.neuroimage.2011.01.049PMID:21276856
38. Schraml F, Chen K, Ayutyanont N, Auttawut R, Langbaum JB, Lee W, et al. Association between an Alzheimer's Disease-Related Index and Gene Dose. PLoS One. 2013; 8(6):e67163. PMID:23840615
39. Herholz K. Cerebral glucose metabolism in preclinical and prodromal Alzheimer's disease. Expert Rev Neurother. 2010; 10(11):1667–73. doi:10.1586/ern.10.136PMID:20977325
40. Clerici F, Del SA, Chiti A, Maggiore L, Lecchi M, Pomati S, et al. Differences in hippocampal metabolism between amnestic and non-amnestic MCI subjects: automated FDG-PET image analysis. Q J Nucl Med Mol Imaging. 2009; 53(6):646–57. PMID:20016455
41. Pagani M, Dessi B, Morbelli S, Brugnolo A, Salmaso D, Piccini A, et al. MCI patients declining and not-declining at mid-term follow-up: FDG-PET findings. Curr Alzheimer Res. 2010; 7(4):287–94. PMID:
19939228
43. Wolk DA, Klunk W. Update on amyloid imaging: from healthy aging to Alzheimer's disease. Curr Neurol Neurosci Rep. 2009; 9(5):345–52. PMID:19664363
44. Jack CJ, Lowe VJ, Weigand SD, Wiste HJ, Senjem ML, Knopman DS, et al. Serial PIB and MRI in nor-mal, mild cognitive impairment and Alzheimer's disease: implications for sequence of pathological events in Alzheimer's disease. Brain. 2009; 132(Pt 5):1355–65. doi:10.1093/brain/awp062PMID:
19339253
45. Hatashita S, Yamasaki H. Diagnosed mild cognitive impairment due to Alzheimer's disease with PET biomarkers of beta amyloid and neuronal dysfunction. PLoS One. 2013; 8(6):e66877. doi:10.1371/ journal.pone.0066877PMID:23799136
46. Chen WP, Samuraki M, Yanase D, Shima K, Takeda N, Ono K, et al. Effect of sample size for normal database on diagnostic performance of brain FDG PET for the detection of Alzheimer's disease using automated image analysis. Nucl Med Commun. 2008; 29(3):270–6. doi:10.1097/MNM.
0b013e3282f3fa76PMID:18349798
47. Klunk WE, Price JC, Mathis CA, Tsopelas ND, Lopresti BJ, Ziolko SK, et al. Amyloid deposition begins in the striatum of presenilin-1 mutation carriers from two unrelated pedigrees. J Neurosci. 2007; 27 (23):6174–84. PMID:17553989
48. Selden N, Geula C, Hersh L, Mesulam MM. Human striatum: chemoarchitecture of the caudate nucleus, putamen and ventral striatum in health and Alzheimer's disease. Neuroscience. 1994; 60 (3):621–36. PMID:7523983
49. Joshi AD, Pontecorvo MJ, Clark CM, Carpenter AP, Jennings DL, Sadowsky CH, et al. Performance characteristics of amyloid PET with florbetapir F 18 in patients with alzheimer's disease and cognitively normal subjects. J Nucl Med. 2012; 53(3):378–84. doi:10.2967/jnumed.111.090340PMID:22331215
50. Barthel H, Gertz HJ, Dresel S, Peters O, Bartenstein P, Buerger K, et al. Cerebral amyloid-beta PET with florbetaben (18F) in patients with Alzheimer's disease and healthy controls: a multicentre phase 2 diagnostic study. Lancet Neurol. 2011; 10(5):424–35. doi:10.1016/S1474-4422(11)70077-1PMID: