COMPARATIVE ANALYSES OF BUILT ENVIRONMENT EXPOSURES
RELEVANT TO HEALTH OF GREENHOUSE GAS EMISSIONS
REDUCTION STRATEGIES IN SERBIA
bySandra P. STEFANOVIĆ a*, Žarko M. STEVANOVIĆ a, Borislav D. GRUBOR a, Žana Ž. STEVANOVIĆ a, Marija M. ŽIVKOVIĆ,a
and Maja D. DJUROVIĆ-PETROVIĆ b
a
Laboratory for Thermal Engineering and Energy, Vinca Institute of Nuclear Sciences, University of Belgrade, Belgrade, Serbia
b
Faculty for International Engineering Management, European University, Belgrade, Serbia
Original scientific paper DOI: 10.2298/TSCI1403903S
Paper presents comparative analysis of residential indoor air pollutant concen-tration change over future specified time horizon, implementing building physical and thermal retrofit measures, thus creating pollution mitigation scenarios for existing Belgrade and Nis housing stock followed by greenhouse gas emission re-duction scenarios up to 2050. Regarding specified mitigation scenarios, the set of typical housing unit models has been generated which define existing housing stock of Belgrade and Nis. Extensive monitoring of physical and thermal parame-ters as well as detailed socio-technical survey of selected households was per-formed and used as an initial modeling input. Relationship between environment pollution and building performances was investigated, with respect to indoor-outdoor sources of pollution, thermal and physical properties of the stock sam-ples and occupant’s behavior. As a final output, indoor pollutant concentrations for each of the modelled cases was obtained and validated against the available data. This housing modelling framework has been created in order to develop an assessment of present and future exposure and health impact quantity regarding single/multiple scenario interventions introduced to the housing stock. This paper provides each strategy guidelines for taking measures towards achieving the healthier indoor environments.
Key words: residential building stock, built environment pollutant exposures, greenhouse gasemissions strategies, indoor air quality,
indoor air pollution
Introduction
Indoor air pollution (IAP), the degradation of indoor air quality (IAQ) by harmful chemicals and other materials, in certain cases can be worse than outdoor air pollution. Ac-cording to World Health Organization (WHO), a gram of released pollutant indoors is likely to cause many hundreds of times more exposure than a gram released outdoors [1]. This is because contained areas enable potential pollutants to build up more than open spaces do. IAQ can be affected by pollutants such as gases (including carbon monoxide, carbon dioxide, radon, and volatile organic compounds), particulates, microbial contaminants (including mould and bacteria) or any mass or energy stressor that can induce adverse health conditions.
–––––––––––––––
In some cases, IAQ problems can cause only feeling of discomfort. Most people feel better as soon as they remove the source of the pollution. However, prolonged exposure to IAP can cause diseases that show up much later, such as respiratory problems, heart disease, asthma, and lung cancer. In 2000, IAP was responsible for more than 1.5 million deaths and 2.7% of the global burden of disease. The most vulnerable are women and young children considering the fact they spend a large proportion of their time indoors [1]. Table 1 provides a simple categorization of indoor sources according to pollutant category worldwide.
Table 1. Indoor pollution sources by major pollutant types [2]
Particles
Combustion by products (CO, NOx)
Volatile organics Biologicals Pesticides Radon
Solid fuel and tobacco combustion,
cleaning
Fuel and tobacco combustion
Furnishings, household products, solid fuel and tobacco
combustion
Furnishings, ventilation ducts, moist
areas
Household prod-ucts, dust from
outside
Ground under building, ventilation characteristics
Increased indoor air pollution is usually linked to the poor physical and thermal build-ing performances. Physical properties of buildbuild-ings determine the amount of outdoor air, which enters a building by process of infiltration, natural and/or mechanical ventilation. On the other hand, building’s thermal properties directly affect indoor temperature and humidity levels, where its high values may cause generation of some pollutants. However, enforcing certain retrofit measures, both thermal and physical, IAQ could be taken to the high-quality level.
Paper presents comparative analysis of indoor air pollutant concentration change, due to different retrofit measures implementation scenarios for existing Belgrade and Nis housing stock that would result in greenhouse gas (GHG) emission mitigation up to 2050.
As first, different scenario assumptions were presented showing how certain housing stock retrofit measures could affect energy consumption reduction. Since it has been estab-lished that for realistic thermal condition assessment of the built environment only the analy-sis of actual, measured energy consumption can be used [3], only measured values were used as a reference for assessment of current housing stock energy consumption for both cities.
Later on, the most dangerous pollutants which arise from different indoor and out-door sources such as particulate matter with diameter of 2.5 micrometers or less (PM2.5), envi-ronmental tobacco smoke (ETS) and radon (Rn) have been revised as well as its causality with proposed scenarios.
Methodology
Simulations were performed combining TRNSYS and CONTAMW software as well as the open source Energy Plus – Design Builder tool into one package. One widely accepted approach to model the overall residential stock involves the selection of numerous dwellings to form characteristic group, which combined in appropriate proportions can represent the entire stock typology [5]. Considering available literature, certain physical and thermal build-ing properties have been identified as relevant for modellbuild-ing indoor pollution in order to de-fine housing stock representatives for the city of Belgrade and Nis:
– physical: urban layout, building construction, building age, building height/number of floors, and
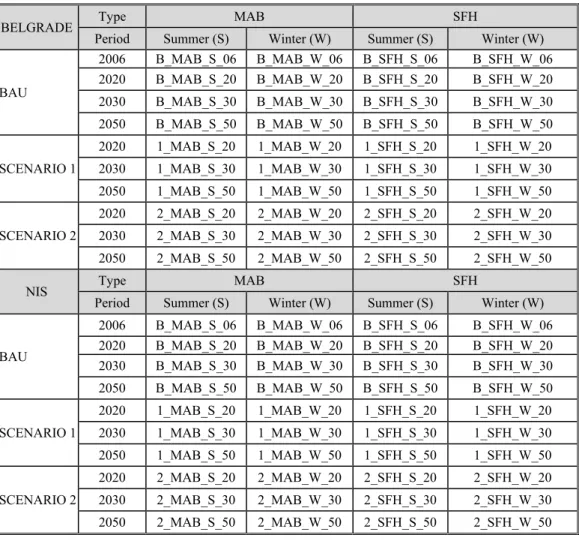
– thermal: heating system, envelope thermal performances, permeability and infiltration. In order to simplify complexity of the research as well as the interpretation of its re-sults, for both cities the extent of the entire housing stock was reduced to 40 representative dwellings in total (tab. 2). The housing stock was consisted of 20 multi-apartment buildings (MAB) and 20 single-family houses (SFH). The model of each representative was designed to be a consequent example of its building category and scenario features.
Table 2. Indoor pollution modelling framework for the year of 2020, 2030, and 2050
BELGRADE Type MAB SFH
Period Summer (S) Winter (W) Summer (S) Winter (W)
BAU
2006 B_MAB_S_06 B_MAB_W_06 B_SFH_S_06 B_SFH_W_06 2020 B_MAB_S_20 B_MAB_W_20 B_SFH_S_20 B_SFH_W_20
2030 B_MAB_S_30 B_MAB_W_30 B_SFH_S_30 B_SFH_W_30
2050 B_MAB_S_50 B_MAB_W_50 B_SFH_S_50 B_SFH_W_50
SCENARIO 1
2020 1_MAB_S_20 1_MAB_W_20 1_SFH_S_20 1_SFH_W_20
2030 1_MAB_S_30 1_MAB_W_30 1_SFH_S_30 1_SFH_W_30
2050 1_MAB_S_50 1_MAB_W_50 1_SFH_S_50 1_SFH_W_50
SCENARIO 2
2020 2_MAB_S_20 2_MAB_W_20 2_SFH_S_20 2_SFH_W_20
2030 2_MAB_S_30 2_MAB_W_30 2_SFH_S_30 2_SFH_W_30
2050 2_MAB_S_50 2_MAB_W_50 2_SFH_S_50 2_SFH_W_50
NIS Type MAB SFH
Period Summer (S) Winter (W) Summer (S) Winter (W)
BAU
2006 B_MAB_S_06 B_MAB_W_06 B_SFH_S_06 B_SFH_W_06 2020 B_MAB_S_20 B_MAB_W_20 B_SFH_S_20 B_SFH_W_20
2030 B_MAB_S_30 B_MAB_W_30 B_SFH_S_30 B_SFH_W_30
2050 B_MAB_S_50 B_MAB_W_50 B_SFH_S_50 B_SFH_W_50
SCENARIO 1
2020 1_MAB_S_20 1_MAB_W_20 1_SFH_S_20 1_SFH_W_20
2030 1_MAB_S_30 1_MAB_W_30 1_SFH_S_30 1_SFH_W_30
2050 1_MAB_S_50 1_MAB_W_50 1_SFH_S_50 1_SFH_W_50
SCENARIO 2
2020 2_MAB_S_20 2_MAB_W_20 2_SFH_S_20 2_SFH_W_20
2030 2_MAB_S_30 2_MAB_W_30 2_SFH_S_30 2_SFH_W_30
Mitigation scenarios
Framework of changes regarding carbon dioxide (CO2) emission and housing stock energy consumption reduction strategies over selected time horizons for the selected Serbian case-study cities Belgrade and Nis has been created. It involved improvements of physical and thermal building properties which directly affect IAP as well as no less important housing stock energy consumption and therefore the emission of CO2. The initial assumption of all these scenarios are continuous rise of living standards, economic growth and transition to-wards more sustainable and energy efficient technology. Each of these scenarios describes an alternative way in which energy consumption and CO2 emissions attributable to the housing stock could develop [6]. Frameworks details are presented in following chapters.
Busines-as-usual (BAU) scenario assumptions
The Base Model scenario is based upon the Business-as-Usual scenario developed by Johnston (2003). The Base Model scenario illustrates the expected developments of the energy consumption and the CO2 emissions attributable to the Belgrade’s and Nis's housing stock by 2050, based on the continuation of current trends.
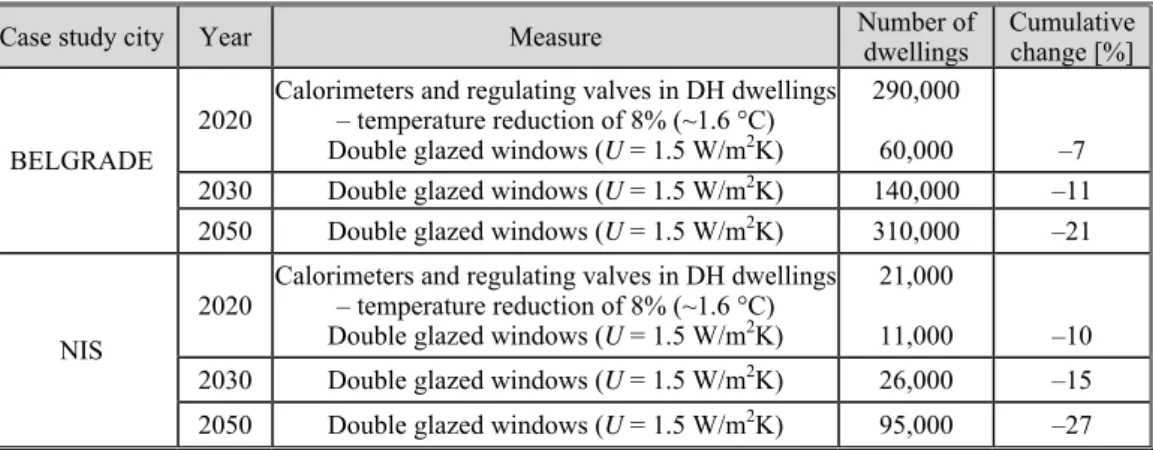
Table 3. Expected energy reduction in the year of 2020, 2030, and 2050 compared to 2006, according to BAU scenario
Case study city Year Measure Number of dwellings
Cumulative change [%]
BELGRADE 2020
Calorimeters and regulating valves in DH dwellings – temperature reduction of 8% (~1.6 °C) Double glazed windows (U = 1.5 W/m2K)
290,000
60,000 –7
2030 Double glazed windows (U = 1.5 W/m2K) 140,000 –11 2050 Double glazed windows (U = 1.5 W/m2K) 310,000 –21
NIS
2020
Calorimeters and regulating valves in DH dwellings – temperature reduction of 8% (~1.6 °C) Double glazed windows (U = 1.5 W/m2K)
21,000
11,000 –10
2030 Double glazed windows (U = 1.5 W/m2K) 26,000 –15
2050 Double glazed windows (U = 1.5 W/m2K) 95,000 –27
Note: In all dwellings ventilation and infiltration rates after window replacement are 0.5 ach
Scenario 1 assumptions
Beside implementation of calorimeters and regulating valves in DH dwellings scena-rio 1 predicts implementation of more demanding and more expansive measures regarding housing sector energy and CO2 reduction such as whole building renovation package which radically reduce annual average energy consumption up to 60 kWh/m².
The whole building package energy efficiency measure include: insulation of walls, roof and floors, and creation of buffer spaces by glazing of loggias and balconies. Increase in the thickness of insulation significantly improves heat accumulation during winter period and minimize solar heat gains in summer period, thus enabling considerable energy savings. Since solid brick wall is the most common external wall construction present in typical Belgrade and Nis residential MAB, its thermal insulation is considered as a great energy reduction measure. Likewise a facade made from plaster is widely used in SFH and it is suitable for application of the external insulation as well [9]. In addition, glazing of loggias and balconies reduces the need for space heating, extends sunspace, and protects the old façade. Cumulative reduction of energy use for space heating by implementation of these measures up to 2050 compared to 2006 are presented in tab. 4.
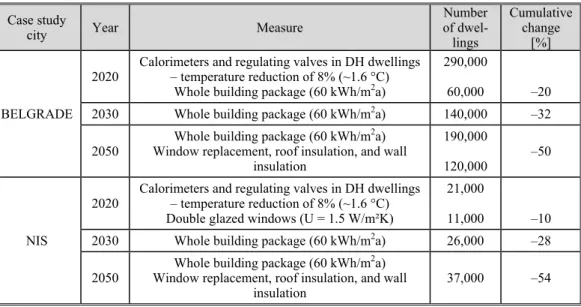
Table 4. Expected energy reduction in the year of 2020, 2030, and 2050 compared to 2006, according to scenario 1
Case study city Year Measure Number of dwellings
Cumulative change [%]
BELGRADE 2020
Calorimeters and regulating valves in DH dwellings – temperature reduction of 8% (~1.6 °C)
Whole building package (60 kWh/m2a)
121,000
71,000 –10
2030 Whole building package (60 kWh/m2a) 126,000 –28 2050 Whole building package (60 kWh/m2a) 237,000 –54
NIS
2020
Calorimeters and regulating valves in DH dwellings – temperature reduction of 8% (~1.6 °C) Double glazed windows (U = 1.5 W/m2K)
21,000
11,000 –10
2030 Whole building package (60 kWh/m2a) 26,000 –28
2050 Whole building package (60 kWh/m2a) 37,000 –54
Note: In all dwellings ventilation and infiltration rates after window replacement are 0.5 ach
Scenario 2 assumptions
As it is shown in tab. 5, scenario 2 dictates the same enhance measures for both Bel-grade and Nis housing stock. However, difference between scenario 1 and 2 is in the volume of implementation trough selected years.
Indoor air pollutants and its sources
PM – is a complex mixture of extremely small particles and liquid droplets. PM is one of the most critical health threats contributing to the development of health hazards such as respiratory problems, heart disease, asthma, and lung cancer [2]. Exposure to the fine par-ticles, those between 0.5 and 2.5 microns, poses a great risk particularly to people with heart or lung diseases and older adults [10].
the smoker. ETS, complex mix of over 4000 chemicals, is the major source of both particle and vapor-phase indoor air contaminants [11].
Rn – radon is colorless, odorless, and tasteless inert gas which decays to form a se-ries of radioactive particles. It emanates from rock, soil and underground water as a gas. However, the concentration of radon may show significant variations in closed living places. The levels of radon in homes and other buildings depend on the characteristics of the rock and soil in the area, building material properties, building’s height as well as on ventilation rate and occupant’s behaviour [12].
Table 5. Expected energy reduction in the year of 2020, 2030, and 2050 compared to 2006, according to scenario 2
Case study
city Year Measure
Number of
dwel-lings
Cumulative change
[%]
BELGRADE 2020
Calorimeters and regulating valves in DH dwellings – temperature reduction of 8% (~1.6 °C)
Whole building package (60 kWh/m2a)
290,000
60,000 –20
2030 Whole building package (60 kWh/m2a) 140,000 –32
2050
Whole building package (60 kWh/m2a) Window replacement, roof insulation, and wall
insulation
190,000
120,000
–50
NIS
2020
Calorimeters and regulating valves in DH dwellings – temperature reduction of 8% (~1.6 °C) Double glazed windows (U = 1.5 W/m²K)
21,000
11,000 –10
2030 Whole building package (60 kWh/m2a) 26,000 –28
2050
Whole building package (60 kWh/m2a) Window replacement, roof insulation, and wall
insulation
37,000 –54
Note: In all dwellings ventilation and infiltration rates after window replacement are 0.5 ach
Pollutant modelling input data
Input data, used for modelling, was classified into three groups: general data (build-ing typology, geometry and thermal performances), on-site data (measurements and question-naires) as well as indoor and outdoor pollutants concentration data (measured and published).
General data
General data, used for each of case-study cities, implied typical housing stock geo-metry units, its properties as well as weather data for the present location. Nevertheless, rep-resentative’s performance data are composed of both externally generated information includ-ing buildinclud-ing location (urban, suburban), buildinclud-ing thermal performances, buildinclud-ing service sys-tems and various other energy related characteristics of both Belgrade and Nis housing stock, and on-site data obtained through monitoring campaign, questionnaire survey and pollutant concentrations (indoor and outdoor) measurements.
On-site data
selected households (questionnaire data). A modified multi-stage stratified sampling method was used to divide both cities housing stocks into homogenous groups “strata” according to four building characteristics: location (urban, suburban), building type, year of built, and space heating system. The monitoring of internal air temperature, RH, and relative indoor lighting levels was carried for one whole year starting from 15th of April 2009 in 96 dwel-lings. Measurements of thermal transmittances of external walls, glazing and window frames have been conducted during the winter period, from 10th of December 2009 to 1st of March 2010. The main criteria for selecting housing units for building envelope elements thermal transmittances monitoring, was their representativeness. Consequently, each chosen housing unit had to be sufficiently representative of the corresponding building group, so that model-ling results can be extrapolated to the whole housing stock in a later stage. Ultimately, adopted measuring methods and instruments are in accordance with International Standard ISO 7726 (1998): Ergonomics of the Thermal Environment-Instruments for Measuring Physi-cal Quantities. The questionnaire is based on the questionnaire used within European research project titled Residential monitoring to decrease energy use and carbon emission in Europe
(REMODECE, 2007), with a certain modifications to make it applicable for this research project. The developed questionnaire was divided into twelve following sections: household details; thermal comfort and indoor air quality; cold appliance; washing appliance; cooking appliance; office appliance; home entertainment equipment; air-conditioning device; general questions; lighting; window opening; and smoking habits. The use of questionnaires has pro-vided additional information on both technological and behavioural characteristics of the households for the development of housing stock model. Occupant’s behavior data played an important role in modeling of indoor pollution, due to the impact of window opening, smok-ing and cooksmok-ing habit.
Pollutant concentration data
Data inputs for building pollution exposure modeling have been used from different sources. Impacts of different internal and external pollutants have been examined
.
Indoor – Impacts of three indoor pollutants have been examined.
PM2.5 – Daily mass outdoor concentrations of PM2.5 were determined by gravimetric analysis of filters that were exposed during the sampling period, between November 2011 and February 2012, as well as from April 2012 until July 2012, and compared to results from SEPA (Environmental Protection Agency, Serbia). It was assumed to have a default concen-tration based on the average outdoor concenconcen-tration and to be deposited in every room accord-ing to the deposition rate sink model (PM2.5Dep). PM2.5Cook, produced in the kitchen, has been modeled using the constant coefficient model [13]. According to questionnaire data, ordinary cooking regime was established: breakfast (for 15 minutes at 8 am), lunch (for an hour from 17 pm) and dinner (for 15 minutes at 8 pm). PM2.5 from smoking (PM2.5Smoke) was produced only in the living room ten times a day for 15 minutes.
ETS – Assumed to be produced only in the living room at a rate of 1 mg/min ten times a day for 15 minutes, modeled using the constant coefficient model [14].
Radon – Produced in all the rooms at generation rate of 0.0007 Bq/s for flats and 0.00428 Bq/s for houses, modeled using the constant coefficient model. Radon has not been measure. Values were taken from referent sources instead [15-17].
Outdoor – An outdoor pollution inputs (PM2.5) has been based on air quality data in
the European Environmental Agency (EEA). Number of measuring points data, within the territory of the Republic of Serbia, were used as an input values for modeling IAQ. This data was compared with the one who’s been collecting during several past years and it was found that the values have not been increased. Data in real time from a system for automatic moni-toring of air quality has been used as well. This kind of data, so called RSS Feed Data, pro-vides the latest average hourly, daily and monthly information about outdoor pollutant con-centrations.
Table 6. Pollutants exposure changes according to BAU scenario energy efficiency measures, relevant to 2006 baseline
Case study
city Building type Pollutant
2006 2020 2030 2050
mean mean mean mean
BELGRADE
MAB
ETS [kgkg–1] 7,61E-07 6,10E-07 4,58E-07 3,83E-07
PM2.5 [µgm –3
] 139,93 129,95 119,55 113,76
Radon [Bqm–3] 26,47 26,47 26,47 26,47
SFH
ETS [kgkg–1] 3,67E-07 2,91E-07 2,23E-07 1,87E-07
PM2.5 [µgm –3
] 82,13 76,84 68,62 64,58
Radon [Bqm–3] 120,86 121,32 120,86 120,86
NIS
MAB
ETS [kgkg–1] 7,74E-07 6,23E-07 4,71E-07 3,96E-07
PM2.5 [µgm–3] 143,04 133,06 122,66 116,87
Radon [Bqm–3] 30,4 30,4 30,4 30,4
SFH
ETS [kgkg–1] 4,53E-07 3,78E-07 3,09E-07 2,73E-07
PM2.5 [µgm–3] 85,25 79,96 71,74 67,69
Radon [Bqm–3] 122,13 122,25 122,13 122,13
Results
Following tabs. 6, 7, and 8 are presenting simulation results (figs. 1 to 3), ac-cording to GHG mitigation scenarios measures and energy consumption predictions. In order to simplify gained outputs one MAB and SFH were chosen to present Belgrade and Nis housing stock referent units. For each of four pollutants, simulated concentration levels have been shown through the referent year of 2006, 2020, 2030 and 2050. As a result, pollutants exposure changes over the years for each of representative units has been estimated.
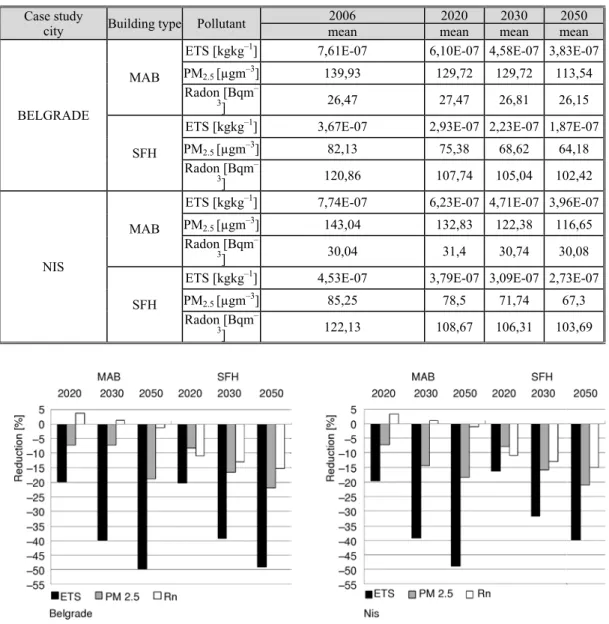
Table 7. Pollutants exposure changes according to scenario 1 energy efficiency measures, relevant to 2006 baseline
Case study
city Building type Pollutant
2006 2020 2030 2050
mean mean mean mean
BELGRADE
MAB
ETS [kgkg–1] 7,61E-07 6,10E-07 4,58E-07 3,83E-07
PM2.5 [µgm–3] 139,93 129,72 129,72 113,54 Radon [Bqm–
3
] 26,47 27,47 26,81 26,15
SFH
ETS [kgkg–1] 3,67E-07 2,93E-07 2,23E-07 1,87E-07
PM2.5 [µgm–3] 82,13 75,38 68,62 64,18 Radon [Bqm–
3
] 120,86 107,74 105,04 102,42
NIS
MAB
ETS [kgkg–1] 7,74E-07 6,23E-07 4,71E-07 3,96E-07
PM2.5 [µgm–3] 143,04 132,83 122,38 116,65 Radon [Bqm–
3
] 30,04 31,4 30,74 30,08
SFH
ETS [kgkg–1] 4,53E-07 3,79E-07 3,09E-07 2,73E-07
PM2.5 [µgm –3
] 85,25 78,5 71,74 67,3
Radon [Bqm– 3
] 122,13 108,67 106,31 103,69
Table 8. Pollutants exposure changes according to scenario 2 energy efficiency measures, relevant to 2006 baseline
Case study city
Building
type Pollutant
2006 2020 2030 2050
mean mean mean mean
Belgrade
MAB
ETS [kgkg–1] 7,61E-07 6,10E-07 4,58E-07 3,83E-07
PM2.5 [µgm–3] 139,93 129,57 119,04 113,27
Radon [Bqm–3] 26,47 26,05 24,73 23,52
SFH
ETS [kgkg–1] 3,67E-07 2,93E-07 2,23E-07 1,87E-07
PM2.5 [µgm–3] 82,13 75,2 68,44 63,71
Radon [Bqm–3] 120,86 102,3 97,13 92,34
Nis
MAB
ETS [kgkg–1] 7,74E-07 6,23E-07 4,71E-07 3,96E-07
PM2.5 [µgm –3
] 143,04 132,68 122,15 116,38
Radon [Bqm–3] 30,04 29,98 28,66 27,45
SFH
ETS [kgkg–1] 4,53E-07 3,79E-07 3,09E-07 2,73E-07
PM2.5 [µgm –3
] 85,25 78,32 71,55 66,83
Radon [Bqm–3] 122,13 103,23 98,4 93,61
Figure 3. Pollutant’s concentration mitigation according to scenario 2 energy efficiency measures, relevant to 2006 baseline
Discussion and conclusion
envelope thermal performances have much more influence in the case of SFH rather than MAB. Installing of new double glazed windows directly reduces infiltration rate and obvious-ly has a greater impact in the case of SFH. However, minimum reduction of PM2.5 in this scenario is more affected by reduction of PM2.5 produced from smoking since occupant’s behavior change, in a sense that indoor smoking will be significantly reduced. Therefore, major exposure changes of ETS can be noticed in time. In this scenario, health impact of ra-don will remain the same as there are no measures for improvement of gas tight thermal and hydro insulation of the floors in the basement in both MAB and SFH.
According to scenario 1 and 2, more demanding and more expensive thermal reno-vation measures are planned resulting in cumulative energy use and GHG emission reduction of the level 50-54% in 2050 compared to 2006 for both cities. These measures will reduce radon exposure and impact on occupant’s health, especially in SFH. Reduction of radon expo-sure is higher in scenario 2 where thicker and better material is planned for gas tight thermal and hydro insulation of the floors in the basement of the houses. PM2.5 and ETS concentration results indicate that main reduction could be expected from occupant’s positive change in behavior while applied thermal renovation measures have minor positive influence if the ven-tilation rate is kept over 0.5 ach.
Since the simulation of only one MAB and SFH representative unit of Belgrade and Nis housing stock were performed, the results may encounter some discrepancy. Therefore, this methodology could be used as a guideline in modeling of the entire residential stock of both case study cities. In the future, the entire residential stock extrapolation will be per-formed in order to estimate the size of the IAP problem in Serbian residential buildings and its long-term effect on human health.
Acknowledgments
This work was carried out within the framework of research project FP7-ENV-2010: PURGE-Public health impacts in urban environments of greenhouse gas emissions reduction strategies, Project number: 265325, financed by the European Commission.
References
[1] ***, World Health Organization (WHO), Indoor Air Pollution: National Burden of Disease Estimates, 2007, http://www.who.int/indoorair/publications/indoor_air_national_burden_estimate_revised.pdf [2] Smith, K., Mehta S., The Burden of Disease from Indoor Air Pollution in Developing Countries:
Com-parison of Estimates, International journal of Hygiene and Environmental Health, 206 (2003), 4, pp. 279–289
[3] Sunikka-Blank, M., Galvin R., Introduction the prebound effect: the gap between performance and actual energy consumption, Building Research & Information, 40 (2012), 3, pp. 260-273
[4] Kavgić, M., A comparative performance analysis of Belgrade Housing Stock: Determinants of the Carbon Reduction Strategy, in MPhil to PhD Upgrade Document, UCL, London, 2011
[5] Jovanović-Popović, M., et al., National Typology of Residential Buildings in Serbia, Faculty of Archi-tecture, University of Belgrade and GIZ – German Association for International Cooperation, Belgrade, 2013
[6] Kavgić, M., et al., Uncertainty and Modelling Energy Consumption: Sensitivity Analysis for a City-Scale Domestic Energy Model, Energy and Buildings, 60 (2013), May, pp. 1-11
[7] Kavgić, M., et al., A Framework for Comparative Analysis of Belgrade Housing Stock-Determinants of Carbon Reduction Strategy, International Conference Building Simulation, Proceedings, Glasgow, Scotland, 2009, pp. 1075-1082
[8] ***, Building Energy Efficiency Regulation, (in Serbian), 2011
[9] Jovanović-Popović, M., et al., Atlas of Family Housing in Serbia, Faculty of Architecture, University of Belgrade and GIZ – German Association for International Cooperation, Belgrade, 2012
[10] Sunyoung, K., Paulos, E., InAir: Sharing Indoor Air Quality Measurements and Visualizations, Pro-ceedings, ACM CHI 2010 Conference on Human Factors in Computing Systems. Atlanta, Geo., USA, 2010, pp. 1861-1870
[11] Leaderer, B., Hammond, K., Evaluation of Vapor-Phase Nicotine and Respirable Suspended Particle Mass as Markers for Environmental Tobacco Smoke, Environmental Science & Technology, 4 (1991), 25, pp. 770-777
[12] Gokmen, A. et al., Radon Pollution Control, in: Handbook of Environmental Engineering, Vol. 2: Ad-vanced Air and Noise Pollution Control, pp. 335-356
[13] Buonannoa, G., et al., Particle Emission Factors during Cooking Activities, Atmospheric Environment, 43 (2009), 20, pp. 3235–3242
[14] Repace, J., et al., Indoor Air Pollution From Cigar Smoke, in: Smoking and Tobacco Control Mono-graph, No. 9, Chapter 5, 2007, pp. 161-179
[15] ***, BS 5250:2002, Amendment No. 1, Code of Practice for Control of Condensation in Buildings, 2005,
http://www.commercialconnections.co.uk/Content/building_standards/BS5250%20-%20Code%20of%20Practise%20for%20condensation%20in%20buildings.pdf
[16] Avramović, I., et al., Radon Concentration Measurements in Dwellings in Belgrade (in Serbian), in: Monograph: Ionizing Radiation in the Environment, Belgrade, 1995, pp. 191-194
[17] Žunić, Z. S., et al., High Natural Radiation Exposure in Radon Spa Areas: a Detailed Field Investigation in Niska Banja (Balkan region), Journal of Environmental Radioactivity, 89 (2006), 3, pp. 249-260
![Table 1. Indoor pollution sources by major pollutant types [2]](https://thumb-eu.123doks.com/thumbv2/123dok_br/18416925.360439/2.892.149.748.411.540/table-indoor-pollution-sources-major-pollutant-types.webp)