71
Radiol Bras. 2012 Mar/Abr;45(2):71–81
Computational toolkit for evaluating air kerma with
the purpose of radiation protection of hospital inpatients:
proposal of a simple experimental evaluation method
*
Ferramenta computacional para avaliação de kerma no ar em aplicações de radioproteção em áreas de internação de pacientes: proposição de um método simples para avaliação experimental
Gabriela Hoff1, José Rodrigo Mendes Andrade2, Andréia Caroline Fischer da Silveira Fischer3,
Alexandre Bacelar4
Objective: To present a data analysis toolkit that may be utilized with the purpose of radiation protection of hospital inpatients and workers in areas where mobile apparatuses are used. Materials and Methods: An Excel®
ActiveSheet was utilized to develop a computational toolkit with exposure measurements to generate a database of shape factors and to calculate the air kerma around hospital beds. The initial database included data collected with three mobile apparatuses. A non-anthropomorphic phantom was utilized and exposure measurements were performed on a (4.2 × 4.2) m2
mesh-grid at 0.3 m steps. Results: The toolkit calculates the air kerma (associated with patients’ radiation exposure and with ambient equivalent dose) under secondary radiation. For distances lower than 60.0 cm, values above the maximum ambient equivalent dose threshold defined for radiation free areas (0.5 mSv/year) were verified. Data collected at 2.1 m have always presented values lower than 12% of that threshold. Conclusion: The toolkit can aid in the radiological protection of patients and workers, provided it is combined with appropriate data collection, since it allows the determination of radiation free areas around beds in rooms where mobile X-ray apparatuses are utilized.
Keywords: Radiology; Radiological protection; Software toolkit.
Objetivo: Apresentar uma ferramenta de análise de dados que pode ser utilizada para proteção de pacientes e traba-lhadores em áreas de uso de equipamentos móveis. Materiais e Métodos: Foi desenvolvida uma ferramenta, em pla-nilha ativa Excel®
, que utiliza medidas de exposição para gerar um banco de dados de fatores de forma e calcular o kerma no ar ao entorno de um leito. O banco de dados inicial foi coletado com três equipamentos móveis. Um espalhador não antropomórfico foi utilizado, sendo realizadas medidas de exposição em uma malha de (4,2 × 4,2) m2
, ao passo de 0,3 m. Resultados: A ferramenta calcula o kerma no ar (associado à exposição de pacientes expostos e ao equiva-lente de dose ambiente) à radiação secundária. Para distâncias inferiores a 60,0 cm, valores acima do limite máximo de equivalente de dose ambiente definido para área livre (0,5 mSv/ano) foram verificados. Os dados coletados a 2,1 m foram sempre inferiores a 12% do referido limite. Conclusão: A ferramenta é capaz de auxiliar na proteção radiológica de pacientes e trabalhadores, quando associada à coleta de dados adequada, pois possibilita a determinação de áreas livres ao entorno de leitos em áreas onde equipamentos móveis geradores de radiação X são utilizados.
Unitermos: Radiologia; Proteção radiológica; Ferramenta computacional.
Abstract
Resumo
* Study developed with the Group of Experimentation and Computational Simulations in Medical Physics, Pontifícia Univer-sidade Católica do Rio Grande do Sul (PUCRS), Porto Alegre, RS, Brazil.
1. PhD, Full Professor, Pontifícia Universidade Católica do Rio Grande do Sul (PUCRS), Porto Alegre, RS, Brazil.
2. Bachelor of Physics, Physicist, Service of Medical Physics and Radioprotection, Hospital de Clínicas de Porto Alegre (HCPA), Porto Alegre, RS, Brazil.
3. Graduate Student, Course of Medical Physics, Pontifícia Universidade Católica do Rio Grande do Sul (PUCRS), Porto Ale-gre, RS, Brazil.
4. Master, Head of Service of Medical Physics and Radiopro-tection, Hospital de Clínicas de Porto Alegre (HCPA), Porto Alegre, RS, Brazil.
Mailing Address: Dra. Gabriela Hoff. Avenida Ipiranga, 6681, Prédio 10, Sala 207, Partenon. Porto Alegre, RS, Brazil, 91629-900. E-mail: [email protected]
Hoff G, Andrade JRM, Fischer ACFS, Bacelar A. Computational toolkit for evaluating air kerma with the purpose of radiation protection of hospital inpatients: proposal of a simple experimental evaluation method. Radiol Bras. 2012 Mar/Abr;45(2):71–81.
being exposed to ionizing radiation. The current dose assessment models for diag-nosis applications define that biological effects may be directly related to increased risk for developing adverse effects such as cancer(5,6), among others.However, when one works with scattered radiation, the models’ complexity increase for low doses and low dose rates(7,8). Currently, a consen-sus is still to be reached on a method to calculate or estimate the additional risk posed by scattered radiation to profession-als and patients who are close to
diagnos-INTRODUCTION
Software tools such as CalDose(1), Mirdose(2), Olinda/EXM(2), Echo® Dose-Response Software(3) and Rad Pro Calcu-lators(4) have been utilized to support radio-logical protection in medical practices in-volving the use of ionizing radiations. Gen-erally, such tools are aimed at generating useful dosimetry data of patients who are
tic X-ray sources. Thus, the principle to be observed is minimizing radiation exposure while maximizing the benefits to the pa-tient. Additional exposure caused to inpa-tients by scattered radiation originated from procedures for other patients do not bring any direct or indirect benefits and should be avoided or minimized.
In seeking to protect individuals, one utilizes dosimetric quantities to assess the amount of radiation exposure that such individuals may be exposed to. In the present study, kerma and ambient dose equivalent were selected as dosimetric quantities for both data input and output.
Radiation exposure is the dosimetric quantity which measures the amount of ionization produced by X-radiation or γ in the air. It can be directly quantified by means of the response from ionization chambers. Air kerma was selected as data input for the worksheets for being an eas-ily measurable quantity by means of the usually available measurement devices found in Brazilian hospitals and clinics. Air kerma is defined as the initial kinetic en-ergy of all charged particles released by non charged ionizing particles in a defined air mass. It can be calculated through exposure and is related to patient dosimetry. The kerma measurement/determination may be utilized as a form of assessing risk to indi-viduals, as the higher the kerma, the greater is the dose to the individual. Such a rela-tionship can be defined by means of fac-tors of kerma conversion into effective dose, computationally calculated or deter-mined on anthropomorphic phantoms. The ambient dose equivalent (at a point in a radiation field) is equivalent to the dose that would be produced by an aligned and expanded field in a spherical ICRU phan-tom at a determined depth, in the radius opposite to the direction of the incident radiation beam. This is a dosimetric quan-tity which is directly related to the applica-tion of radiologic protecapplica-tion and can be utilized to evaluate whether the area may be considered as radiation free, according to the Portaria 453/98(9). This is an infor-mation of great importance in the field of radiologic protection, with radiation free areas being those where the levels of am-bient dose equivalent is lower than 0.5 mSv/year(9). Such areas, by definition, are
exempted from specific radiological pro-tection controls or utilization of dosim-eters(9).
The main objective of the present study is to generate a computational toolkit, since now named toolkit, and method to measure dosimetric quantities which will be useful for protection of inpatients in environments where mobile radiation emitting appara-tuses are utilized, thus raising new ques-tions on the application of radiological pro-tection, and seeking also to protect those patients who are not being directly exposed to ionizing radiation, but might be receiv-ing radiation doses on account of the hos-pital environment where they stay. The present study presents the initial assess-ments and mappings for this type of inves-tigation. Generally, there is not a direct dose limitation, but only a recommendation of reference levels for patients who are being submitted to clinical procedures. However, in the case of inpatients, it is possible that other forms of irradiation are present, par-ticularly the exposure to secondary radia-tion produced by mobile X-ray generating apparatuses. Those patients may receive increased dose equivalent because of such unintentional “additional exposure” caused by scattered radiation originated from pro-cedures performed in “neighboring” pa-tients. The assessment of such additional dose is relevant to guarantee patients’ safety and the lower unintended exposure to ion-izing radiation as possible during inpatients stay, considering that such kind of exposure does not bring any direct benefit to the pa-tient. The non-observance of this radiologi-cal protection principle leads to inappropri-ate application of the ALARA (As Low As Reasonable Achievable) principle, which establishes that the radiation dose should be as low as possible to produce the desired diagnostic data. The direct application of the ALARA principle can be undertaken by means of the assessment of ambient dose equivalent maps (generated by the toolkit presented in this study) and the pursuit of the positioning of beds and stretchers in safe areas (classified as radiation free areas according to Brazilian standards). For such a purpose, it is necessary to know the ping of the ambient dose equivalent map-ping or air kerma so that radiological pro-tection measures can be put into practice.
The Brazilian Regulations(9–11) define the dose threshold for occupationally ex-posed individuals (20 mSv/year), but the patients constitute a special class of indi-viduals to whom the ALARA principle as well as cost-risk-benefit considerations(12) are more noticeably applied. Generally, professionals working in areas where mo-bile emitting apparatuses are utilized are not classified as occupationally exposed in-dividuals.
The present study applies both to pa-tients and non-occupationally exposed in-dividuals who stay in areas where mobile X-radiation emitting apparatuses are uti-lized. In the field of radiological protection, it is of utmost relevance to assure maxi-mum benefit and minimaxi-mum risk during medical exposure to ionizing radiation. Thus, the considerations in the present study cover not only the exposure origi-nated from radiologic procedures per-formed on the patient, but also possible additional doses originating from radio-logic procedures performed in other inpa-tients in a same hospital environment in cases where routine examinations are per-formed by means of mobile apparatuses. Such considerations also address the safety of non-occupationally exposed individuals who must remain in the areas where the mobile apparatuses are utilized, by assur-ing that they position themselves in the so called radiation free areas.
Thus, the present study conceives a methodological proposal which is easily applicable and a toolkit for data manage-ment for calculating or mapping air kerma and ambient equivalent dose in hospital bed areas. The toolkit has been validated and, in addition to exposure/mAs data col-lected for mobile apparatuses hereinafter denominated shape factor, it allows the customization of input data with the pur-pose of calculating the above mentioned dosimetric quantities.
MATERIALS AND METHODS
bed during a radiologic procedure per-formed with a mobile apparatus. The au-thors did not utilize a programming lan-guage, but rather the generation of active Excel® worksheets with the utilization of plain resources (without the need for acti-vating external macros). The Materials and Methods chapter will be presented by means of two different sub-chapters: the determination of the method utilized for generating the shape factors for the assess-ment of ambient dose equivalent and air kerma, and the presentation of the toolkit with the options for data input and output.
Exposure data collection
For the creation of the ambient dose equivalent assessment model for different X-ray generating apparatuses, three appa-ratuses were selected, as follow: a MUX 10 model Shimadzu and two Polymobil 10 Siemens. Such apparatuses were initially evaluated with respect to their accuracy and repeatability of the air kerma rate and ac-celeration/tension; accuracy and linearity of exposure time; collimation and align-ment of the central radiation beam; as well as testing for and were also investigated for leakage radiation in the tube housing as-sembly. All the assessed apparatuses pre-sented good utilization conditions, and were in compliance with the minimum Brazilian standards. The exception was one of the Siemens apparatuses (serial number 1809990X055I), which presented issues both in alignment and collimation of the radiation beam. The testing results were forwarded to the institution management, and repairs were duly performed before the data collection.
The data collection strategy was defined in such way to utilize resources that are commonly available in hospitals. The only data collection information that can be added in the generation of shape factors for the study of scattered radiation is the inte-gral (or total) exposure collected in mAs at positions of interest on the mesh-grid. A mobile X-ray emitting apparatus, a second-ary radiation measuring device, a scatter-ing object and a support in order to attach the ionization chamber at the same height are required to perform the measurements. In order to make the method accessible, the selected scattering object was a
non-an-thropomorphic acrylic phantom measuring (30.0 × 30.0 × 20.0) cm3, which may be utilized to simulate the chest or the abdo-men (depending upon the added acrylic thickness), containing an aluminum rod measuring (2.0 × 1.5 × 30.0) cm3 to simu-late the spine. Such a phantom has been utilized for repeatability testing in X-ray generating devices and comparative equip-ment evaluation, following the recommen-dations for non-anthropomorphic phan-toms(13–15).
Early in the present study, data were col-lected from three apparatuses utilized in two hospitals in the city of Porto Alegre, RS, Brazil, in the usual operating conditions in such institutions (93 kVp and 100 kVp). In case one wishes to utilize data consid-ering different peak voltages, all that is necessary is to follow the method described in the next paragraphs and utilize the data personalization mode of the developed tool.
In the development of the proposed method a data collection area of 4.2 m ×
4.2 m was considered, with the central ref-erence point in the two-dimensional Car-tesian coordinates system corresponding to the central beam entry point on the primary radiation field. The non-anthropomorphic phantom was placed on a support (a stain-less steel table) and positioned in an empty
examination room, allowing the exposure measurements on the defined mesh-grid and the mapping of the area of interest. One should highlight that the phantom support could be made from other materials. The authors have opted for a stainless steel table as it was easily available in the data collec-tion environments and presented appropri-ate dimensions for data collection in the phantom’s surrounding areas. Certainly, such a support increased the amount of scattered radiation, an acceptable fact for conservative studies approaching dosim-etry and radiological protection.
From the central reference point, mea-surements of the integral exposure were performed at 0.3 m increments, forming up a grid in a plane at the medial level of the phantom. Seven measurements were per-formed in each direction of the area of in-terest, so as to reach a distance of 2.1 m to each side of the plane, as shown on Figure 1. The data collection points were marked on the room floor with adhesive tape.
The exposure measurements data col-lected on the mesh-grid do not take into consideration the contribution of caused by the patient, who receives the additional dose, i.e., it is a free-in-air measurement.
In the present study, the radiation expo-sure was meaexpo-sured by means of a duly cali-brated specific ionization chambers for
secondary radiation beams. Radcal (model 1800CC) ionization chambers and elec-trometers were utilized for measurements with the Shimadzu equipment, while with the Siemens apparatuses, Victoreen (model 660-5) devices were utilized.
The characteristics of the selected radio-graphic techniques were dependent upon the limitations of each apparatus, with the 96 kVp and 40 mAs technique being uti-lized for the Siemens apparatuses and the 100 kVp and 63 mAs technique being uti-lized for the Shimadzu equipment.
The differences in such techniques re-sult from limitations of each apparatus and technique utilized in the participating hos-pitals. In order to minimize the variations caused by mAs differences in the collec-tion, the data were normalized for expo-sure/mAs. Such normalized measurements on the mesh-grid points were named shape factor (SF), as they serve as basis for de-termining the intensity of the dosimetric quantities calculated by the toolkit.
The calculation model proposed in the developed toolkit considers the above de-scribed data collection geometry. Once the SFs are determined, they can be utilized to estimate the air kerma and the ambient dose equivalent for the different workloads in the service and months of inpatients stay. The toolkit allows the users to enter cus-tomized SF data. Thus, users can collect the measurements on the exposure/mAs mesh-grid according to the above described method for different tube voltages, enter-ing such data as the “My shape factor (SF)” option is selected in the “Select shape fac-tor (SF)” item available on the worksheet.
The tool
Among the available possibilities of implementation, the authors have opted for the ActiveData worksheets. The ActiveData is a user-friendly resource, providing results soon after the data input. The developed worksheet can be utilized with different softwares, with such possibility being veri-fied with Excel®, BrOffice and Gnumeric. The proposed structure of the developed toolkit is quite simple, as it comprises two worksheets as follows: Data_base (Base_
de_dados) (which is occult for security
purposes) and Calculation_worksheet (Planilha_de_cálculo).
The Data_base (Base_de_dados)
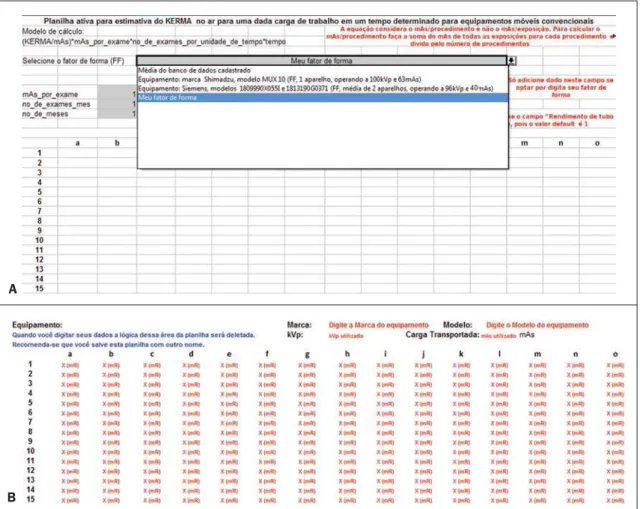
worksheet contains the proposed “data-base” with the SFs (mR/mAs) for the col-lected data grids and the mobile appara-tuses. The data included in such worksheet were collected from previous studies(16,17). The worksheet which is available (vis-ible) to the user is the Calculation_work-sheet (Planilha_de_cálculo). This is the actual user interface worksheet, which re-quests the user to enter the following data: mean tube current transported by examina-tion (mAs_por_exame), identified as CAMPO 1 (field 1) on Figure 2, no_de_ exames_mes (number of examinations per month), identified as CAMPO 2 (field 2) on Figure 2, no_de_meses (number of months of interest in the study), identified as CAMPO 3 (field 3) on Figure 2, and the SF to be utilized, which can be selected from the option list, identified as CAMPO 4 (field 4) on Figure 2. The CAMPO 4 (field 4) on Figure 2 provides a list of options for equipment data previously entered into the database. Those options are the following: SF map defined by the group of apparatuses in the database; measurements performed with the Shimadzu equipment (SF with the equipment being operated at 100 kVp and 63 mAs); measurements performed with the Siemens apparatuses (SF defined by the mean values of the measurements per-formed with two apparatuses operating at 96 kVp and 40 mAs). The list also allows customized SF data input. By selecting the customization mode, a data input table is exhibited below the results worksheet, al-lowing the user to enter his/her own col-lected exposure measurements data (at the mean acceleration voltages utilized in the equipment). The list with the current SF se-lection possibilities is shown on Figure 3. The above mentioned parameters serve as the basis for determining the kerma total at each point of interest on the mesh-grid. The ratio defined by equation 1 is applied to each point of the mesh-grid to build the final map presented on the “Table of ab-sorbed dose values per air volume (air kerma free in air), in mGy”.
kermatotal = kerma/mAs × mAs/procedure × nº procedures/time × time
In order to initiate the utilization of the tool, the user must open the mobil_xr_
KERMAar_english.xls file. At this point, the user will visualize the Calculation_
worksheet (Planilha_de_cálculo) shown
on Figure 2.
After entering the mandatory basic data for the calculation in the fields 1, 2, 3, and 4 (Figure 2), the results will be automati-cally demonstrated on this same worksheet, on the “Table of absorbed dose values by air volume (kerma free in air), in mGy”. The format selected for the presentation of data was a table comprising 15 columns (named “a” thru “o”) and 15 lines (num-bered from 1 thru 15). Each cell on this worksheet corresponds to a measurement point, with the distance between two con-secutive measurement points being 30.0 cm. The mobile X-ray equipment was placed at the center of the field of interest, i.e., with the reference central beam located in the “h8” cell of the table of results. The cells shown on the table as NA (“non ap-plicable”) represent those cells where the measurements could not be performed ei-ther because that particular position was occupied by the equipment console or be-cause the chest phantom was located in that position (being that a region which was exposed to the primary beam). The posi-tioning of the mobile equipment’s X-ray tube was defined in such a manner so the mobile equipment’s console was always located in the map regions defined by lines “1” and “8”, and columns “f” and “j”.
Figure 2. Data worksheet showing the way of searching registered data. The grey-marked fields are those where the user interacts with the system.
Figure 3. Selection of the customized mode (A) by means of the option “My shape factor”, and (B) personalized data input area (fields with red letters).
of a same brand and model, when utilized at the same tube voltage as the data stored in the database.
Limitations of the model implemented in the toolkit
According to the proposed method, the presented results take into consideration the case where highest exposure is pro-duced. Therefore the present method is conservative, and considers that all exami-nations were performed at the same posi-tion at the patient’s bedside utilized as a reference for calculation. Although valid, this is an extremely conservative method for evaluating the situation in question. In truth, there is a distribution among the beds which has not been determined. It is suggested that, in cases where the fre-quency of examinations for each bed can be determined, the different possibilities be separately considered on the worksheet, with the kermatotal being determined by means of the sum of the participations of each ratio in the total of performed exami-nations, so that such normalization is con-sidered in the total estimate of skin en-trance kerma.
It is important to note that the proposed method presents limitations; the most no-ticeable of them are the following: the need for verification of quality control tests per-formed on the mobile equipment in ques-tion, the need for the tube voltage to be similar to that utilized in the examinations, and the utilization of correction factors for the variation of the rate of kerma emitted by the X-ray generating equipment as it ages. Thus, in order to obtain the actual dose on the patients by means of the cal-culation, the data collection should be per-formed once in the whole mesh-grid, and SF corrections should be applied every year, based on the variation of the tube performance data for a same acceleration voltage. Once the X-ray generating equip-ment has passed all the quality control tests, i.e., it is in compliance with all Brazilian standards, particularly those regarding lin-earity of kerma response with mAs, it is possible to estimate the skin entrance kerma due to X-radiation scattered per ex-amination, by multiplying the value on the data table by the value of mAs of the ex-amination in the room.
RESULTS
Presentation of the toolkit
In association with the proposed data collection, the developed toolkit demon-strates to be safe and appropriate, within the method limitations mentioned under “Material and Methods”.
Figure 2 illustrates an example of data input and the obtained result for the system internal database, where CAMPO 4 (field 4) “Selecione o fator de forma (FF)” ( Se-lect the shape factor (SF)) was defined by the option “ Mean value for the registered database”, and the remaining fields were defined as follows: CAMPO 1 (field 1) =
“mAs_por_exame” (mAs_by_procedure)
defined as 1 mAs; CAMPO 2 (field 2) = “no_de_exames_mes” (number of exami-nations per month), defined as 10 exams performed per month; and CAMPO 3 (field 3) = “no_de_exames_mes” (no_of_
procedures_month) defined as two-month
hospital stay. Those are the mandatory data entries which must be defined by the user. The fields 5 and 6, regarding “tube per-formance at initial acceptance/data collec-tion”, are automatically filled if the user chooses to utilize data from apparatuses already registered in the tool. Such fields should only be filled out in case the user intends to utilize customized data which have not been recently collected, requiring correction (in case the utilized equipment presents changes in the tube performance test values). The fields regarding “Current tube performance” (fields 7 and 8) should only be filled out if the user intends to uti-lize such correction factor in the results. In case the user does not have the “Current tube performance” data or does not wish to utilize the correction factor, the field should not be filled out, and by default the utilized correction factor will be 1.
The toolkit also allows the user to enter customized data for a given equipment (collected at his/her institution), provided the user selects the option “Meu Fator de
Forma (FF)” (My Shape Factor (SF)) at
CAMPO 4 (field 4) at “Selecione o Fator
de Forma (FF)” (Select de shape factor
(SF)), as shown on Figure 3A. Automati-cally, below the data output worksheet ad-vises, a table for customized data entry will be exhibited (Figure 3B). The fields to be
filled out are highlighted in red, identify-ing the information to be entered. The ex-posure data must be added at the mR unit, in the space reserved for data input, marked as X (mR), as shown on Figure 3B. The worksheet will automatically normalize in mAs (provided the field of transported load is informed) and will perform the calcula-tions for the generation of results. It is im-portant to notice that the data collection for building up the mesh-grid places consider-able stress on the tube, and must be per-formed in different phases to avoid tube overheating. Along the development of the present study, the authors took, on average, 18 hours for collecting the data from each complete mesh-grid, with data from each quadrant being collected in different days. The authors wish to encourage users to send their SFs to be added to the tool, with the purpose of building up a large shared database. Users who wish to collaborate by adding data from their mobile apparatuses should, after collecting the data according to the method described on the above men-tioned articles, send an e-mail to GESiC ([email protected]) including the data worksheet comprising the normalized exposure data in mR/mAs, and the mobile equipment tracking data (make, model and other pertinent data), as well as the value for tube performance of the equipment which was valid in the data collection pe-riod.
The toolkit, in English, as well as all in-formation required to participate by includ-ing user data in the toolkit’s database, and contact information on the authors of the present study are available for download at http://www.gesic.com.br/conteudo/ equipamento_movel_planilha.html.
Toolkit applications: study of actual cases
beam area. Additionally, the curves shapes on Figure 4A and 4B are relatively rectan-gular and similar. The exception is the chart on Figure 4C, which presents a distortion which makes the shape triangular.
Case study 1 – Protection for inpatients on beds located in areas where mobile X-radiation apparatuses are utilized.
As the application of radiological pro-tection of patients is considered, it is im-portant to highlight that there are different areas in which mobile X-radiation gener-ating apparatuses are utilized in hospitals. Usually, the distance between the central axis of the radiation beam and the indi-vidual of interest is not determined by regu-lations and as examples one can mention pediatric emergency departments and both neonatal and adult ICUs. The Brazilian
Standard RDC 50(18) recommends a dis-tance between beds corresponding to 0.8 m for anesthesia recovery areas and 2.0 m for collective work areas. Mandatory distances for neonatal areas are not specified.
Areas for which there are no specifica-tion, or where it is not possible to maintain the minimum 2.0 m distance between beds or pediatric incubators, may be trouble-some in the evaluation of radiological pro-tection. In such cases, the results of the present study allow the definition of safe distances for hospital inpatients, whenever moving the bed is at all possible, or allows the estimation of entrance skin air kerma in patients for assessment of exposure levels. Tables 1 and 2 show results calculated by the toolkit with basis on the collected ex-perimental data for the validation of such
toolkit for applications of patients’ radio-logical protection.
Tables 1 and 2 highlight in red the data equal or above the level determined for radiation free areas. Data in yellow show values below the level determined for ra-diation free areas, but due to possible fluc-tuations and variations in apparatuses re-sponse, such data are likely to reach the radiation thresholds. Data in blue define the contour of the collection area, with data being collected at the greatest distances. Based on the Brazilian regulations, stretch-ers/beds/incubators should be positioned at distances > 2.0 m. In those cases where this is not possible, the results of the present study can be useful in the determination of safe areas to which stretchers/beds/incuba-tors could be moved before X-radiation is
Table 1 Entrance skin air kerma data in mGy, with basis on the kerma/mAs maps, considering an inpatient in the pediatric area, who is present during all the performed radiodiagnosis procedures, with the calculation parameter of 3.16 mAs per procedure, mean transported load in the tube, with the number of procedures per month corresponding to 20.1.*
1 2 3 4 5 6 7 8 9 10 11 12 13 14 15 a 0.021310 0.025163 0.028260 0.030696 0.034825 0.036337 0.039459 0.047199 0.045989 0.022739 0.039775 0.036674 0.032013 0.028715 0.025706 b 0.025399 0.028673 0.033203 0.037897 0.042773 0.046278 0.050030 0.060670 0.060146 0.053083 0.050180 0.042975 0.037358 0.034980 0.028071 c 0.027959 0.032981 0.040173 0.048093 0.055410 0.063122 0.067841 0.082258 0.081537 0.078228 0.068515 0.053065 0.044614 0.041752 0.031538 d 0.031617 0.038182 0.047594 0.060562 0.074742 0.089190 0.098764 0.127077 0.123482 0.108992 0.091211 0.073883 0.058893 0.051470 0.039021 e 0.033959 0.044098 0.057844 0.076410 0.104365 0.139804 0.172944 0.233242 0.219305 0.171891 0.133465 0.095608 0.070117 0.058040 0.043619 f 0.033723 0.046405 0.066640 0.097449 0.148845 0.226804 0.382185 0.608272 0.478457 0.295480 0.182815 0.118313 0.082673 0.064552 0.047946 g 0.020606 0.103753 0.051448 0.080507 0.153391 0.426116 NA NA 1.836883 0.445167 0.220863 0.132312 0.088795 0.067424 0.051492 h 0.016476 0.098418 0.130525 NA NA 0.576574 NA NA† NA 0.656090 0.261313 0.148018 0.092435 0.068936 0.050573 i 0.021537 0.095941 0.045065 0.072313 0.125571 0.389080 NA NA NA 0.424720 0.218215 0.128243 0.090561 0.062510 0.047712 j 0.033065 0.045960 0.063361 0.088719 0.135603 0.227150 0.405901 0.462356 0.428189 0.233192 0.146895 0.096895 0.067871 0.051494 0.045234 k 0.033956 0.044994 0.053026 0.071266 0.099286 0.127637 0.194888 0.199199 0.194489 0.169317 0.113829 0.080770 0.059781 0.047245 0.043728 l 0.030291 0.036449 0.045521 0.057320 0.076305 0.092227 0.112571 0.114095 0.110798 0.095996 0.080770 0.064900 0.051444 0.041782 0.040062 m 0.027952 0.031492 0.038423 0.045650 0.055194 0.063567 0.073619 0.083595 0.081110 0.071306 0.062984 0.053676 0.044120 0.037968 0.035002 n 0.024262 0.027660 0.032056 0.037446 0.044070 0.047821 0.053059 0.053748 0.050986 0.048084 0.043861 0.037767 0.032806 0.029923 0.027121 o 0.020534 0.023355 0.026662 0.029339 0.033718 0.035461 0.040942 0.041585 0.040580 0.037838 0.034836 0.030446 0.027984 0.025235 0.024092
* The NA marked zones represent the locations where the measurements could not be performed either for being within the primary area of irradiation or for being occupied by some component of the mobile X-ray generating equipment.
† Reference cell (h8) which represents the point of the central beam entry on the primary irradiation field. The remaining cells comprise the mesh-grid with measurement points at every 30.0 cm distances. Thus the points defined by cells h1, h15, a8 e o8 are at 2.1 m from the reference h8 point.
Figure 4. Isoexposure maps in mR/mAs generated for each evaluated equipment: Shimadzu (A), Siemens model 1809990X055I (B) and Siemens model 1813190G0371 (C). The scale of dimensions X and Y is 18.8:1. The color scale remains constant for all the charts included in this figure.
utilized. In the case of the apparatuses evaluated in the present study, the safety distance would be above 70.0 cm from the central beam of the primary irradiation field and the edge of the stretcher/bed/incubator. The data were calculated considering one patient who has been hospitalized over a one-year period and, during the perfor-mance of radiological examinations, al-ways remains beside the bed where the procedures are being performed.
Case study 2 – Protection for non-oc-cupationally exposed individuals working in hospitalization areas where mobile X-ra-diation generating apparatuses are utilized. Another form of utilization of the toolkit is for protecting workers in areas where mobile apparatuses are utilized. The Brazilian regulations require that workers in areas where radiological diagnostic pro-cedures are performed with mobile equip-ment, be positioned at least 2.0 m away from the central beam of the primary irra-diation field. In practice, it is requested that workers to remain in the room only in those cases where their presence is indispensable. Tables 3 and 4 demonstrate the entrance skin air kerma considering the mean value for the three apparatuses evaluated in the present study and one year of work (11 months of activities performed in hospital bed areas) for two different units (pediat-ric and adult ICU). Such data can be
uti-Table 2 Entrance skin air kerma data in mGy, generated with basis on the kerma/mAs maps, considering an inpatient hospitalized in the adult ICU and who is present during all performed radiodiagnosis procedures, with the calculation parameter of mean transported load of 3.55 mAs in the tube per procedure, and the number of procedures per month corresponding to 40.5.*
1 2 3 4 5 6 7 8 9 10 11 12 13 14 15 a 0.048238 0.056960 0.063968 0.069484 0.078830 0.082253 0.089319 0.106841 0.104100 0.051471 0.090035 0.083015 0.072465 0.065000 0.058188 b 0.057494 0.064904 0.075158 0.085783 0.096822 0.104755 0.113249 0.137333 0.136146 0.120159 0.113587 0.097279 0.084565 0.079181 0.063542 c 0.063288 0.074656 0.090937 0.108863 0.125427 0.142883 0.153565 0.186200 0.184568 0.177076 0.155090 0.120118 0.100989 0.094510 0.071390 d 0.071568 0.086429 0.107733 0.137088 0.169187 0.201890 0.223563 0.287653 0.279515 0.246716 0.206465 0.167242 0.133311 0.116508 0.088328 e 0.076869 0.099821 0.130936 0.172961 0.236241 0.316460 0.391477 0.527967 0.496419 0.389094 0.302112 0.216418 0.158716 0.131378 0.098737 f 0.076335 0.105042 0.150847 0.220585 0.336926 0.513393 0.865115 1.376885 1.083037 0.668850 0.413821 0.267814 0.187138 0.146121 0.108530 g 0.046645 0.234856 0.116458 0.182235 0.347217 0.964557 NA NA 4.157973 1.007680 0.499947 0.299502 0.200997 0.152621 0.116558 h 0.037296 0.222779 0.295458 NA NA 1.305135 NA NA† NA 1.485127 0.591509 0.335055 0.209236 0.156044 0.114477 i 0.048751 0.217172 0.102008 0.163688 0.284243 0.880722 NA NA NA 0.961398 0.493952 0.290291 0.204993 0.141497 0.108000 j 0.074845 0.104036 0.143424 0.200824 0.306950 0.514178 0.918798 1.046591 0.969249 0.527855 0.332513 0.219332 0.153634 0.116563 0.102393 k 0.076863 0.101847 0.120029 0.161318 0.224743 0.288919 0.441150 0.450908 0.440246 0.383265 0.257663 0.182832 0.135320 0.106943 0.098982 l 0.068567 0.082506 0.103041 0.129749 0.172724 0.208766 0.254815 0.258266 0.250803 0.217297 0.182832 0.146908 0.116449 0.094579 0.090684 m 0.063272 0.071285 0.086975 0.103333 0.124938 0.143891 0.166644 0.189226 0.183601 0.161409 0.142570 0.121501 0.099871 0.085946 0.079230 n 0.054920 0.062611 0.072563 0.084763 0.099757 0.108249 0.120105 0.121663 0.115413 0.108842 0.099285 0.085489 0.074259 0.067734 0.061392 o 0.046480 0.052866 0.060351 0.066413 0.076324 0.080270 0.092676 0.094132 0.091856 0.085651 0.078855 0.068918 0.063345 0.057122 0.054535
* The NA marked zones represent the locations where the measurements could not be performed either for being within the primary area of irradiation or for being occupied by some component of the mobile X-ray generating equipment.
† Reference cell (h8) which represents the point of the central beam entry on the primary irradiation field. The remaining cells comprise the mesh-grid with measurement points at every 30.0 cm distances. Thus the points defined by cells h1, h15, a8 e o8 are at 2.1 m from the reference h8 point.
lized to define the risk associated with ad-ditional irradiation as well as to verify the possible additional entrance skin exposure caused by scattered radiation.
Tables 3 and 4 where data equal or above the determined level for radiation free areas are highlighted in red. Data in yellow dem-onstrate the values that are below such level but, considering possible fluctuations and variations in the apparatuses response, are likely to reach the radiation thresholds. Data in blue mark the contour of the collection area, with data being collected at the great-est distances. The tables show that, for the apparatuses evaluated in the present study, the safety distance would be above 70.0 cm between the central beam of the primary irradiation field and the edge of the stretcher/ bed/incubator. The data were calculated for a non-occupationally exposed individual, working over 11 months of the year.
DISCUSSION
The developed calculation tool, associ-ated with the proposed data collection method, demonstrated to be appropriate and traceable, provided that the mobile X-ray equipment in question is operating within the quality control test compliance parameters. Such a worksheet may be cus-tomized, allowing the input of user’s spe-cific equipment data.
For the performance of the measure-ments, a non-anthropomorphic phantom which can be easily built and an ionization chamber calibrated for secondary beams are necessary. During the development of the toolkit, the authors have opted for mak-ing available the entry of the institution’s characterization data at the header, as well as the possibility of kerma measurements data input by the user, given the peculiari-ties and particularipeculiari-ties of each institution and applied techniques(11–13). From the au-thors’ point of view, this makes the toolkit nimble and adaptable for the application of the proposed method in different mobile equipment use areas.
cen-tral beam of the primary irradiation field, corresponding to an individual leaning against the stretcher/bed/incubator of the irradiated patient. The points highlighted in yellow represent those points with thresh-old data, i.e., points that could be in the limit area of the definition of radiation free areas, given the variations in experimental data. For the points located at 2.1 m, all the measurements are below the recommended maximum level for ambient dose equiva-lent in radiation free areas, with most of
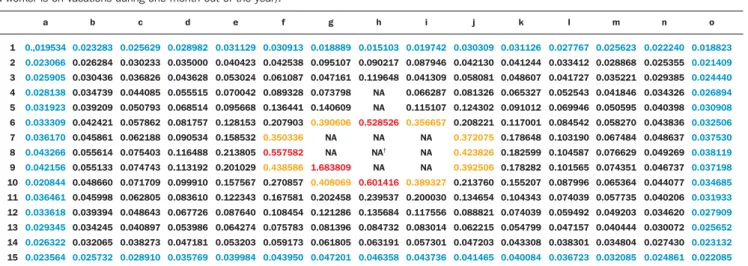
Table 3 Air kerma data in mGy generated with basis on the kerma/mAs maps, considering a worker in the pediatric area, who is present during all performed radiodiagnosis procedures, with actual factors of 3.16 mAs per procedure, 20.1 procedures per month and 11 work months per year (considering that such a worker is on vacations during one month out of the year).*
1 2 3 4 5 6 7 8 9 10 11 12 13 14 15 a 0.,019534 0.023066 0.025905 0.028138 0.031923 0.033309 0.036170 0.043266 0.042156 0.020844 0.036461 0.033618 0.029345 0.026322 0.023564 b 0.023283 0.026284 0.030436 0.034739 0.039209 0.042421 0.045861 0.055614 0.055133 0.048660 0.045998 0.039394 0.034245 0.032065 0.025732 c 0.025629 0.030233 0.036826 0.044085 0.050793 0.057862 0.062188 0.075403 0.074743 0.071709 0.062805 0.048643 0.040897 0.038273 0.028910 d 0.028982 0.035000 0.043628 0.055515 0.068514 0.081757 0.090534 0.116488 0.113192 0.099910 0.083610 0.067726 0.053986 0.047181 0.035769 e 0.031129 0.040423 0.053024 0.070042 0.095668 0.128153 0.158532 0.213805 0.201029 0.157567 0.122343 0.087640 0.064274 0.053203 0.039984 f 0.030913 0.042538 0.061087 0.089328 0.136441 0.207903 0.350336 0.557582 0.438586 0.270857 0.167581 0.108454 0.075783 0.059173 0.043950 g 0.018889 0.095107 0.047161 0.073798 0.140609 0.390606 NA NA 1.683809 0.408069 0.202458 0.121286 0.081396 0.061805 0.047201 h 0.015103 0.090217 0.119648 NA NA 0.528526 NA NA† NA 0.601416 0.239537 0.135684 0.084732 0.063191 0.046358 i 0.019742 0.087946 0.041309 0.066287 0.115107 0.356657 NA NA NA 0.389327 0.200030 0.117556 0.083014 0.057301 0.043736
* The NA marked zones represent the locations where the measurements could not be performed either for being within the primary area of irradiation or for being occupied by some component of the mobile X-ray generating equipment.
† Reference cell (h8) which represents the point of the central beam entry on the primary irradiation field. The remaining cells comprise the mesh-grid with measurement points at every 30.0 cm distances. Thus the points defined by cells h1, h15, a8 e o8 are at 2.1 m from the reference h8 point.
j 0.030309 0.042130 0.058081 0.081326 0.124302 0.208221 0.372075 0.423826 0.392506 0.213760 0.134654 0.088821 0.062215 0.047203 0.041465 k 0.031126 0.041244 0.048607 0.065327 0.091012 0.117001 0.178648 0.182599 0.178282 0.155207 0.104343 0.074039 0.054799 0.043308 0.040084 l 0.027767 0.033412 0.041727 0.052543 0.069946 0.084542 0.103190 0.104587 0.101565 0.087996 0.074039 0.059492 0.047157 0.038301 0.036723 m 0.025623 0.028868 0.035221 0.041846 0.050595 0.058270 0.067484 0.076629 0.074351 0.065364 0.057735 0.049203 0.040444 0.034804 0.032085 n 0.022240 0.025355 0.029385 0.034326 0.040398 0.043836 0.048637 0.049269 0.046737 0.044077 0.040206 0.034620 0.030072 0.027430 0.024861 o 0.018823 0.021409 0.024440 0.026894 0.030908 0.032506 0.037530 0.038119 0.037198 0.034685 0.031933 0.027909 0.025652 0.023132 0.022085
Table 4 Air kerma data in mGy generated with basis on the kerma/mAs maps, considering a worker in the adult area, and who is present during all performed radiodiagnosis procedures, with actual mAs factor per procedure of 3.55, and 40.5 procedures per month during 11 months of the year (considering that the worker is on vacations during one month out of the year).*
1 2 3 4 5 6 7 8 9 10 11 12 13 14 15 a 0.044218 0.052213 0.058638 0.063694 0.072261 0.075399 0.081875 0.097937 0.095425 0.047182 0.082532 0.076097 0.066426 0.059583 0.053339 b 0.052703 0.059495 0.068895 0.078635 0.088754 0.096025 0.103812 0.125888 0.124800 0.110146 0.104121 0.089172 0.077518 0.072583 0.058247 c 0.058014 0.068434 0.083359 0.099791 0.114974 0.130976 0.140768 0.170683 0.169188 0.162320 0.142166 0.110108 0.092574 0.086635 0.065441 d 0.065604 0.079227 0.098755 0.125664 0.155088 0.185066 0.204933 0.263682 0.256222 0.226156 0.189260 0.153305 0.122202 0.106799 0.080967 e 0.070464 0.091503 0.120024 0.158548 0.216554 0.290089 0.358853 0.483970 0.455050 0.356669 0.276936 0.198383 0.145490 0.120430 0.090509 f 0.069974 0.096289 0.138277 0.202203 0.308849 0.470610 0.793022 1.262145 0.992783 0.613113 0.379336 0.245496 0.171543 0.133944 0.099485 g 0.042758 0.215285 0.106753 0.167049 0.318282 0.884177 NA NA 3.811475 0.923707 0.458285 0.274543 0.184248 0.139902 0.106845 h 0.034188 0.204214 0.270836 NA NA 1.196373 NA NA† NA 1.361367 0.542216 0.307134 0.191800 0.143040 0.104937 i 0.044689 0.199074 0.093508 0.150047 0.260556 0.807329 NA NA NA 0.881282 0.452789 0.266100 0.187911 0.129706 0.099000 j 0.068608 0.095366 0.131472 0.184089 0.281371 0.471330 0.842231 0.959375 0.888478 0.483867 0.304803 0.201055 0.140831 0.106849 0.093860 k 0.070457 0.093360 0.110027 0.147875 0.206015 0.264843 0.404387 0.413332 0.403559 0.351327 0.236191 0.167596 0.124043 0.098032 0.090734 l 0.062853 0.075631 0.094454 0.118937 0.158330 0.191369 0.233580 0.236743 0.229903 0.199188 0.167596 0.134666 0.106745 0.086697 0.083127 m 0.058000 0.065345 0.079727 0.094722 0.114527 0.131900 0.152757 0.173457 0.168301 0.147958 0.130689 0.111376 0.091549 0.078783 0.072628 n 0.050343 0.057393 0.066516 0.077700 0.091444 0.099228 0.110096 0.111525 0.105795 0.099772 0.091011 0.078365 0.068070 0.062090 0.056276 o 0.042607 0.048460 0.055322 0.060878 0.069964 0.073581 0.084953 0.086287 0.084202 0.078514 0.072284 0.063175 0.058067 0.052362 0.049991
* The NA marked zones represent the locations where the measurements could not be performed either for being within the primary area of irradiation or for being occupied by some component of the mobile X-ray generating equipment.
† Reference cell (h8) which represents the point of the central beam entry on the primary irradiation field. The remaining cells comprise the mesh-grid with measurement points at every 30.0 cm distances. Thus the points defined by cells h1, h15, a8 e o8 are at 2.1 m from the reference h8 point.
those points presenting values lower than 12% of the limit, and all the values below 20% of the limit for radiation free areas.
Observing the data on Tables 3 and 4, which consider a worker present at all per-formed radiological procedures using mo-bile apparatuses in the pediatric and adult ICU areas, the worst case (adult ICU) shows that 15 points (in red) are above the recommended level for radiation free areas, all of such points located within a radius of 60.0 cm from the central beam of the
Considering safety and radiological protection issues which are common to the areas where radiodiagnosis procedures are performed with mobile apparatuses, it is important to take the definition of radiation free areas into consideration. Such a defi-nition, according to the Portaria 453/98, is “the area exempted from special radiologi-cal protection controls”. Thus, based on the experimental data from the present study, areas which are above 2.0 m from the cen-tral axis of the primary beam are safe, with no need for the utilization of dosimeters or any other type of monitoring devices or shielding. In truth, for individuals who re-main at 2.0 m from the center of the pri-mary irradiation field, the data demonstrate values always below 20% (for the worst evaluated case) of the defined maximum value for ambient dose used for the defini-tion of radiadefini-tion free areas. Thus, it can be affirmed that, for the evaluated apparatuses and calculation parameters, it is safe to re-main in areas distant more than 2.0 m from the center of the primary irradiation field, being such areas considered as being radia-tion free according to the definiradia-tions estab-lished by the Portaria 453/98(1).
In cases where it is impossible to move the patients to such areas, one can, with basis on the curves, define safe regions, po-sitioning the mobile equipment in such a manner that patients who cannot be moved to the safe areas remain out of the area defined by data in red and yellow on Tables 1, 2, 3 and 4, thus minimizing the radiation exposure.
However, one observes that the data in the present study are based on the mean value of exposure data in mAs collected from different apparatuses and that each one of those apparatuses has its own pecu-liarities. The toolkit allows such data to be utilized for apparatuses included in the database. However, considering the pecu-liarities of the mobile apparatuses utilized in hospitals, it is suggested that, whenever possible, the data on the exposure mesh-grid in mAs be collected for each mobile equipment in the hospital. Thus the evalu-ation will present data that are closer to the reality in the particular hospital or clinic. In case that is not possible, the worksheet in the present study presents an acceptable approximation of the curves for
appara-tuses in general, provided that the added calculation parameters are based on the actual conditions of the particular hospital or clinic.
The toolkit proposed by the present study allows the customization of the data obtained in a hospital or clinic and its use for the definition of the risk associated with the entrance skin exposure. In order to transform such exposure into a dose on a certain organ or tissue and/or into a whole body dose, it is necessary to utilize a coef-ficient for conversion of exposure into dose. Such factors for conversion of kerma or exposure into effective dose are well defined for primary radiation, but are yet to be calculated for exposures originating from secondary radiation. One suggests the determination of such factors in order to complete the analysis.
CONCLUSIONS AND SUGGESTIONS
The developed toolkit is user-friendly and its utilization does not require coding skills. The method presented in this study, associated with the utilization of the devel-oped toolkit in Excel®, and utilizing the tube performance data from the equipment utilized in a hospital, allows the calculation of the ambient dose or the entrance skin dose on patients (without considering retroscattering).
The results provided by the developed toolkit may be directly utilized to evaluate the safety of inpatients who are hospital-ized in areas where the dimensions/dis-tances between the beds are not legally defined, or the distances between the beds are lower than 2.0 m. Additionally, the dose maps may be utilized for assessment of changes in the ambient dose on account of changes in workload of the location. With the additional collection of exposure data for other acceleration voltages, the toolkit may also be useful in the assessment of shape factors and, consequently, in the as-sessment of ambient doses with the changes in radiographic technique. This allows the evaluation of the impact of the optimization of the radiographic technique on the radiological protection of inpatients and workers in areas where mobile appa-ratuses are utilized. In addition, the pro-posed method, in association with the
uti-lization of the developed toolkit (Excel® worksheet), may be applied to optimize the dose to patients and to evaluate the ambi-ent dose in all areas where mobile appara-tuses are utilized in the hospital/clinic, al-lowing the follow-up of such dosimetric parameters and evaluating the possibility of optimization of the radiological protection. It is suggested that additional risks as-sociated with such exposure condition are evaluated. For this purpose, it is of particu-lar importance to determine the effective doses on patients that are within or at the threshold of the controlled area. Patients who are outside the controlled area may be evaluated, but one should remember that they are in an area characterized as a radia-tion free area. In order to perform such calculation, it is necessary to determine the factors for conversion of kerma into effec-tive dose for scattered radiation. Thus, the kerma data from the mesh-grid can be con-verted into effective dose, especially in cases where the beds are within the 2.0 m area, allowing the evaluation of the risk associated with that additional exposure. Such data would constitute the experimen-tal basis for the semi empirical model pro-posed in the present study, in which retroscattering and coefficients for conver-sion of kerma into effective dose (cceffective) and into absorbed dose (ccabsorbed) are con-sidered as theoretical participating entities, for geometry and considerations on the utilized spectrum. Equations 2 and 3 show the proposed semi-empirical models, where WT represents the radiation weight-ing factor.
D = kermatotal × ccabsorbed (2)
E = kermatotal × cceffectiveWT (3)
The ccabsorbed and cceffective coefficients will be evaluated in the future by means of computational simulation data. As the ra-diation weighting factor corresponds to 1 for X-radiation, it was not shown on equa-tion 2. The cceffective coefficient represents the summation of all ccabsorbed for organs and tissues in the body of interest.
The GESiC is initiating the simulations for the determination of the retroscattering factors ccabsorbed and cceffective, considering the scattered spectrum for the geometry described in the present study.
REFERENCES
1. Kramer R, Khoury HJ, Vieira JW. CALDose_X – a software tool for the assessment of organ and tissue absorbed doses, effective dose and cancer risks in diagnostic radiology. Phys Med Biol. 2008;53:6437–59.
2. Standard dosimetry. Radar software: Mirdose and Olinda/EXM. [acessado em 26 de outubro de 2011]. Disponível em: http://www.doseinfo-radar.com/RADARSoft.html#MDOL 3. Labcity. Echo® dose-response software. [acessado
em 26 de outubro de 2011]. Disponível em: http:/ / w w w . l a b c y t e . c o m E c h o % C 2 % A E _ DoseResponse_Software/Default.288.html 4. Rad Pro Calculators. Gamma emitter point source
dose-rate to activity and shielding calculations (in air). [acessado em 26 de outubro de 2011]. Dis-ponível em: http://www.radprocalculator.com/ Gamma.aspx
5. International Commission on Radiological Pro-tection. Radiological protection in medicine. ICRP Publication 105. Ann ICRP. 2007;37(6). 6. International Commission on Radiological
Pro-tection. The optimization of radiological
protec-tion – broadening the process. ICRP Publicaprotec-tion 101b. Ann ICRP. 2006;36(3).
7. United Nations Scientific Committee on the Ef-fects of Atomic Radiation. UNSCEAR 2000 Re-port to the General Assembly, with scientific an-nexes. Annex A: Dose assessment methodologies. Vol 1, p. 29–82; 2000.
8. United Nations Scientific Committee on the Ef-fects of Atomic Radiation. UNSCEAR 2000 Re-port to the General Assembly, with scientific an-nexes. Annex G: Biological effects at low radia-tion doses. Vol 2, p. 73–175; 2000.
9. Brasil. Ministério da Saúde. Agência Nacional de Vigilância Sanitária. Diretrizes de proteção radio-lógica em radiodiagnóstico médico e odontoló-gico. Portaria nº 453/98. Brasília, DF: Diário Ofi-cial da União, 2 de junho de 1998.
10. Brasil. Ministério da Saúde. Agência Nacional de Vigilância Sanitária. Resolução 1016. Brasília, DF: Diário Oficial da União, 5 de abril de 2006. 11. Brasil. Ministério da Saúde. Agência Nacional de Vigilância Sanitária. Radiodiagnóstico médico: desempenho de equipamentos e segurança. Bra-sília, DF; Ministério da Saúde; 2005. 12. National Council on Radiation Protection &
Measurement. NCRP Report No. 107. Implemen-tation of the principle of As Low As Reasonable Achievable (ALARA) for medical and dental per-sonnel. Bethesda, MD: National Council on Ra-diation Protection & Measurements; 1990. 13. American Association of Physicists in Medicine.
Standardized methods for measuring diagnostic X-ray exposures. AAPM Report no. 31. New York, NY: American Association of Physicists in Medicine; 1990.
14. American College of Radiology. ACR practice guideline for diagnostic reference levels in medi-cal X-ray imaging (Revised 2008). Reston, VA: American College of Radiology; 2008. 15. Compagnone G, Pagan L, Bergamini C.
Compari-son of six phantoms for entrance skin dose evalu-ation in 11 standard X-ray examinevalu-ations. J Appl Clin Med Phys. 2005;6:101–13.
16. Hoff G, Andrade JRM, Fisher ACFS, et al. Ma-peamento de curvas de isoexposição geradas por equipamentos de radiodiagnostico móveis con-vencionais e dose em pacientes hospitalizados. In: II Congresso Brasileiro de Proteção Radiológica. Recife, PE, Brasil; 2011.
17. Bacelar A, Andrade JRM, Fisher ACFS, et al. Ma-peamento de curvas de isoexposição para avalia-ção de equivalente de dose ambiente para equi-pamentos móveis de radiodiagnóstico. In: II Con-gresso Brasileiro de Proteção Radiológica. Re-cife, PE, Brasil; 2011.