ABSTRACT:Objective: To assess the dietary intake of adolescents compared with the Brazilian Food Guide and to explore their diferences according to anthropometric data and physical activity. Methods: A total of 476 adolescents from public schools of Piracicaba, SP, Brazil participated in this study. A semi-quantitative food frequency questionnaire was used to estimate food group intake of adolescents. Height, weight and waist circumference of all participants were measured. Physical activity pattern was determined by questioning about participation in regular sport activities. Results: The prevalence of overweight was 36.1% and 60% were not physically active. 7.8, 7.1, 6.3, and 0.2% of adolescents consumed vegetables, fruits, milk and derivatives, and cereals, respectively, according to recommendations. About 55 and 79% of adolescents consumed excessively oils/fats and sugar/sweets, respectively. Physically active adolescents consumed more cereals, fruits, vegetables, milk and derivatives, and meats and eggs. Conclusion: Most adolescents did not follow the food group recommendations and those who were physically active have healthier food habits.
Keywords: Adolescent. Eating. Food guide. Physical activity. Body weight.Recommended Dietary Allowances.
Dietary intake of adolescents compared
with the Brazilian Food Guide and their
diferences according to anthropometric
data and physical activity
A ingestão dietética de adolescentes em comparação com o Guia Alimentar
Brasileiro e suas diferenças de acordo com dados antropométricos e atividade física
Carla Cristina EnesI, Betzabeth SlaterII
ISchool of Nutrition, Pontifícia Universidade Católica de Campinas – Campinas (SP), Brazil. IISchool of Public Health, Universidade de São Paulo – São Paulo (SP), Brazil.
Corresponding author: Carla Cristina Enes. Avenida John Boyd Dunlop, s/n, Jardim Ipaussurama, CEP: 13060-904, Campinas,
SP, Brasil. E-mail: [email protected]
Conlict of interests: nothing to declare – Financial support: none.
INTRODUCTION
Dietary guidelines are promoted worldwide as an important part of national food and nutrition policies. They are the translation of the nutrition science into public health advice. The purpose of dietary guidelines is to promote population-level dietary patterns that mini-mize the risk of nutritional deiciency and chronic disease. Especially among children and adolescents, dietary guidelines encourage intake of particular types of foods in an
appro-priate amount to support growth1.
Adolescence is a crucial period for the development of dietary behaviors that continue into adulthood. In addition, adolescence is a time of important behavioral changes in which children test their autonomy and gain independence from their parents, which may afect both eating behaviors2 and physical activity3.
Inadequate food consumption patterns during childhood and adolescence are linked not only with the occurrence of obesity in youth4, but also with the subsequent risk of develo-ping diseases such as cancer5, obesity6, and cardiovascular diseases7 in adulthood.
Results of several studies indicate that the dietary pattern of normal weight and over-weight children and adolescents difer and that overover-weight children more often consume
food considered unhealthy8,9. There are also indications that diet may be correlated with
physical activity and sedentary behaviors, but associations remain conlicting in children and adolescents. In adults, higher physical activity has been associated with higher consumption of fruit, fruit juice and vegetables10-12.
In Brazil, although some studies have examined the relationship between dietary intake, nutritional status and physical activity, few of them compared food consumption with die-tary guidelines among young people.
RESUMO:Objetivo: Avaliar o consumo alimentar de adolescentes em comparação com o Guia Alimentar Brasileiro e explorar suas diferenças segundo dados antropométricos e atividade física. Métodos: Foram entrevistados 476 adolescentes de escolas públicas de Piracicaba, SP, Brasil. O consumo alimentar foi avaliado por questionário de freqüência alimentar. Altura, peso e circunferência da cintura foram medidos. O padrão de atividade física foi determinado pelo questionamento sobre a participação em atividades físicas regulares. Resultados: A prevalência de sobrepeso foi de 36,1% e 60% não eram isicamente ativos. 7,8, 7,1, 6,3 e 0,2% dos adolescentes consumiram legumes, frutas, leite e derivados, e cereais, respectivamente, de acordo com as recomendações. Cerca de 55 e 79% consumiram óleos/gorduras e açúcares/doces em excesso, respectivamente. Adolescentes isicamente ativos consumiram mais cereais, frutas, legumes, leite e derivados, carnes e ovos. Conclusão: A maioria dos adolescentes não atingiu as recomendações dos grupos de alimentos e aqueles isicamente ativos tinham hábitos alimentares mais saudáveis.
Toral et al.13 also assessed adolescents from public schools of Piracicaba in 2004, but only 11 schools took part of the sample, and the authors used data regarding just three food groups (fruits, vegetables and sweets). Furthermore, the authors did not evaluate the food consumption considering the nutritional status and the practice of physical activity among adolescents.
Considering the importance of establishing eating patterns during adolescence and the need for monitoring the diet of youth individuals to evaluate and support interventions, this study aimed to assess dietary intake of adolescents compared with the Brazilian Food Guide and to explore their diferences according to anthropometric data and physical activity.
METHODS
STUDY DESIGN AND POPULATION
This study is linked to the research entitled “Determinant factors for the risk of obesity in adolescents from public schools in Piracicaba, Sao Paulo (Brazil): cross-sectional study as a irst step in a cohort study” funded by FAPESP (Protocol no. 2006/61085-0). This is a cros-s-sectional survey carried out between March and May 2009 with a probabilistic sample of 487 adolescents. The inclusion criteria were adolescents of both sexes, from ifth grade of public schools of Piracicaba, Sao Paulo (Brazil). Piracicaba has around 368,000 inhabitants
(20% of them adolescents)14 and shows a predominance of public schools attended in most
cases by children and adolescents from lower socioeconomic classes with some homoge-neity in eating behaviors13. To calculate the sample in the original research, we considered the universe of public schools with ongoing ifth grade classes, distributed in six regions of the city, including rural areas. The sample was drawn in a two-stage sampling of conglome-rates. In the irst stage, the primary sampling units were all public schools with ongoing ifth grade classes and, in the second stage, the secondary sampling units comprised all ifth gra-des in each school. Five random drawings were conducted for schools within each region, considering the overweight prevalence range of 20 – 32%, type I error of 5% and type II error of 10%. This procedure identiied that an estimated sample of approximately 500 ado-lescents in 26 schools would be representative. The second round was performed systema-tically with a random start. To calculate the inal sample an overweight prevalence of 26% was considered, according to the last survey carried out in Piracicaba, Sao Paulo, in 200515. Although the socioeconomic data has been collected (income and schooling), we decided not to include them in the analysis due to the large number of missing values. However, as mentioned before, public schools in Piracicaba are attended predominantly by students from low socioeconomic level. The original research was authorized by the Department of Education of the State of São Paulo and the Department of Education of Piracicaba, and
approved by the Ethics Committee of the School of Public Health of Universidade de São
parents or legal guardians. During interviews with the students, we obtained demogra-phic, anthropometric, food intake and physical activity data using electronic questionnai-res. A pilot study was carried out with 76 adolescents, which enabled adaptations to the inal format of the questionnaire. These participants were excluded from the inal sample.
DIETARY INTAKE ASSESSMENT
The usual intake was evaluated through the application by trained staf of the Semi-quantitative Food Frequency Questionnaire for Adolescents (SFFQA). The SFFQA was validated for energy and nutrients by Slater et al.16 and for food groups by Voci et al.17. Both of these previous studies produced satisfactory results. The SFFQA included ques-tions regarding usual frequency of intake of 58 speciic food items. Participants were asked to indicate how often they consumed each food over the past three months by checking
frequency categories from 1 to 7, ranging from never to ≥ 2 times a day. The main
cha-racteristic of this SFFQA is the inclusion of food and portions that are often consumed by adolescents. The portions presented in the SFFQA represent the average
consump-tion, in grams, of each food item. Food items were grouped into 8 groups present in the
Brazilian Food Guide18, considering physical characteristics and nutrient content per 100 g. The food groups used for this analysis with their recommended consumption were the following: cereals and derivatives, roots, tubers and derivatives (≥ 6 daily servings); vege-tables (≥ 3 daily servings); fruits (≥ 3 daily) servings; meats and eggs (≥ 1 daily serving); milk and derivatives (≥ 3 daily servings); beans and others legumes (≥ 1 daily servings); oils and fats (≤ 1 daily serving); sugar and sweets (≤ 1 daily serving). From data obtained in SFFQA, we calculated the average daily food group intakes and compared to the Brazilian Food Guide for each food group to determine the percentage of adolescents meeting the recommendation. If the total calories were < 500 kcal and ≥ 7500 kcal/d (5 boys and 1 girl), it was considered an outlier or an error, and the participant’s data were excluded from further analysis19. We also excluded 4 participants (2 boys and 2 girls) without birth date information and 1 (boy) without food intake information. Therefore, the inal sam-ple used in analysis was 476 adolescents.
PHYSICAL ACTIVITY
ANTHROPOMETRIC MEASUREMENTS
Anthropometric measurements were performed by trained staf. Weight was measured on an electronic platform scale with 0.1 kg precision. Height has been measured without shoes with a standard stadiometer set to the wall with no baseboards. All measurement
procedures were performed according to the standardization proposed by Lohman et al.22.
Height and weight were assessed twice and the mean value was used. Body Mass Index (BMI) was calculated and expressed as standard deviation (Z scores) of the WHO 2007
growth reference for school-aged children and adolescents23. The cutof used to identify
overweight adolescents was ≥ 1 (Z scores) and obese was ≥ 2 (Z scores). There was no
outlier in the anthropometric data. Adolescents were classiied into two groups accor-ding to the nutritional status: normal weight (underweight + normal weight) and over-weight (overover-weight + obese). Demographics information (age and sex) were obtained during interviews.
STATISTICAL ANALYSES
Descriptive statistics (mean, standard deviation, proportion) were calculated and then further statistical analyses were conducted to determine the possible relationship between participant’s demographics, physical activity and their dietary patterns. Mean diferences of consumption according to anthropometric data and physical activity pattern were tes-ted using Student’s t-test. A p-value < 0.05 was considered statistically signiicant. All data analyses were performed using STATA version 11.0.
RESULTS
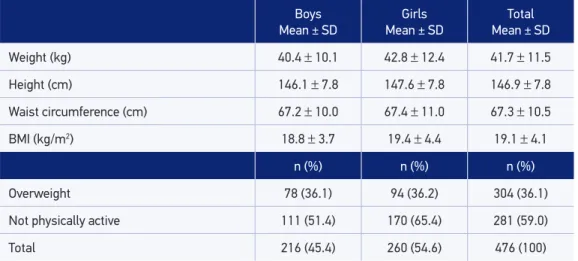
The present data analysis included 260 girls (54.6%) and 216 boys (45.4%). The mean age of the participants was 11.1 ± 0.81. Characteristics regarding the anthropometric data and physical activity pattern of adolescents stratiied by sex are shown in Table 1.
The prevalence of overweight among participants was nearest 36.0%. There was no sig-niicant diference comparing boys and girls (p = 0.244). Almost 60% of adolescents (boys and girls) practiced less than 300 minutes of physical activity per week.
for milk and derivatives the consumption was higher among boys (p = 0.0043) (data not shown in table).
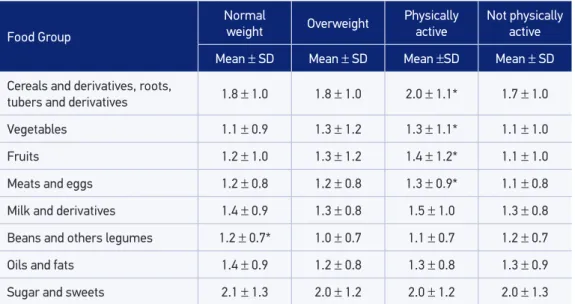
Among boys with normal weight, the consumption of cereals and derivatives was higher (p = 0.0082), and for girls, the group of beans and others legumes also was higher (p = 0.0301) among normal weight adolescents (Tables 3 and 4). The consumption of cereals (boys: p < 0.001; girls: p = 0.03), fruits (boys: p = 0.03; girls: p = 0.005) and meat and eggs (boys: p = 0.05; girls: p = 0.04) was higher among physically active adolescents. Milk and derivatives and vegetables intake was higher among physically active boys (p = 0.02) and girls (p = 0.03), respectively.
Table 2. Percentage of compliance with the Brazilian Food Guide recommendations among adolescents, according to food group and sex.
Food group
Boys (n = 216) Girls (n = 260) Total (476)
n (%) n (%) n (%)
Cereals and derivatives, roots,
tubers and derivatives 1 (0.5) 0 (0) 1 (0.2)
Vegetables 23 (10.6) 14 (5.4) 37 (7.8)
Fruits 15 (7.0) 19 (7.3) 34 (7.1)
Meats and eggs 120 (55.6) 127 (48.8) 247 (51.9)
Milk and derivatives 17 (7.9) 13 (5.0) 30 (6.3)
Beans and others legumes 158 (73.1) 185 (71.1) 343 (72.1)
Oils and fats 103 (47.7) 108 (41.5) 211 (44.3)
Sugar and sweets 48 (22.2) 52 (20.0) 100 (21.0) SD: standard deviation.
Table 1. Characteristics of the study subjects. Boys Mean ± SD
Girls
Mean ± SD
Total Mean ± SD
Weight (kg) 40.4 ± 10.1 42.8 ± 12.4 41.7 ± 11.5
Height (cm) 146.1 ± 7.8 147.6 ± 7.8 146.9 ± 7.8
Waist circumference (cm) 67.2 ± 10.0 67.4 ± 11.0 67.3 ± 10.5
BMI (kg/m2) 18.8
± 3.7 19.4 ± 4.4 19.1 ± 4.1
n (%) n (%) n (%)
Overweight 78 (36.1) 94 (36.2) 304 (36.1)
Not physically active 111 (51.4) 170 (65.4) 281 (59.0)
SD: Standard deviation; *Student’s t-test; p-value < 0.05
Food Group
Normal
weight Overweight Physically active Not physically active
Mean ± SD Mean ± SD Mean ±SD Mean ± SD
Cereals and derivatives, roots,
tubers and derivatives 1.8 ± 1.0 1.8 ± 1.0 2.0 ± 1.1* 1.7 ± 1.0
Vegetables 1.1 ± 0.9 1.3 ± 1.2 1.3 ± 1.1* 1.1 ± 1.0
Fruits 1.2 ± 1.0 1.3 ± 1.2 1.4 ± 1.2* 1.1 ± 1.0
Meats and eggs 1.2 ± 0.8 1.2 ± 0.8 1.3 ± 0.9* 1.1 ± 0.8
Milk and derivatives 1.4 ± 0.9 1.3 ± 0.8 1.5 ± 1.0 1.3 ± 0.8
Beans and others legumes 1.2 ± 0.7* 1.0 ± 0.7 1.1 ± 0.7 1.2 ± 0.7
Oils and fats 1.4 ± 0.9 1.2 ± 0.8 1.3 ± 0.8 1.3 ± 0.9
Sugar and sweets 2.1 ± 1.3 2.0 ± 1.2 2.0 ± 1.2 2.0 ± 1.3 Table 4. Dietary intake (serving/day) of food groups among girls, stratiied by nutritional status and physical activity pattern.
SD: Standard deviation. *Student’s t-test; p-value < 0.05.
Food Group
Normal
weight Overweight Physically active Not physically active
Mean ± SD Mean ± SD Mean ± SD Mean ± SD
Cereals and derivatives, roots,
tubers and derivatives 2.1 ± 1.1* 1.7 ± 0.9 2.2 ± 1.2* 1.7 ± 0.8
Vegetables 1.2 ± 1.2 1.3 ± 1.0 1.4 ± 1.3 1.1 ± 1.1
Fruits 1.2 ± 1.0 1.3 ± 0.9 1.4 ± 1.1* 1.1 ± 0.8
Meats and eggs 1.3 ± 1.0 1.2 ± 0.8 1.4 ± 1.1* 1.2 ± 0.8
Milk and derivatives 1.5 ± 0.9 1.6 ± 0.9 1.7 ± 0.9* 1.4 ± 0.8
Beans and others legumes 1.2 ± 0.7 1.2 ± 0.7 1.1 ± 0.8 1.2 ± 0.7
Oils and fats 1.3 ± 0.9 1.2 ± 0.9 1.3 ± 0.9 1.2 ± 0.9
Sugar and sweets 1.9 ± 1.2 2.0 ± 1.2 2.0 ± 1.3 1.9 ± 1.1 Table 3. Dietary intake (serving/day) of food groups among boys, stratiied by nutritional status and physical activity pattern.
DISCUSSION
Our results showed that the participants had a low compliance to the Brazilian Food Guide and healthy eating patterns were not common. Adolescents eat less than one half of the recommended amount of fruits, vegetables, and milk and derivatives, and less than one third of the recommended amount of cereals and derivatives. Less than 10% of ado-lescents reached the minimum daily recommendations for these food groups. In contrast,
they consumed twice as much sugar and sweets than recommended. Enns et al.24 showed
that for any given Food Guide Pyramid group, less than 50% of adolescents consumed the recommended number of servings. Another study conducted in United States reported that, compared with recommendations, most children and adolescents did not meet any
recommendations25.
Unhealthy eating patterns identiied in this study are consistent with previous litera-ture26-28. Akman et al.26 found that the consumption of fruits and vegetables was below, while saturated fat consumption was higher, than recommendations among adolescents. Unsatisfactory consumption of fruit, vegetables as well as milk and derivatives has been reported among adolescents living in ten cities of Europe, and the consumption of sweets
exceeded the recommendation27. Vegetables and fruits consumption when young is linked
to many positive health outcomes. It promotes optimal health in childhood, growth and
intellectual development, and lower levels of body fat29. The recommendations for milk
and derivatives were met only by 6.3% of adolescents in the present study. This food group intake was compared with other studies. Zhang et al.28 veriied that nearly 30% of Chinese adolescents consumed the recommended number of servings. In view of the substantial health beneits of these foods, there is an urgent need to encourage Brazilian adolescents to increase consumption of vegetables, fruits, and milk and derivatives.
Furthermore, this is a worrying characteristic, because adolescence is a transition period characterized by biological and social changes, especially changes in behavior. It is well accepted that an individual’s eating habits begin to form early in life and dietary habits
developed during adolescence can carry into adulthood30. Furthermore, nutritional needs
increase sharply during adolescence because of the increased growth rate and changes in body composition.
Although we have observed signiicant diferences comparing normal weight and over-weight adolescents only for cereals and beans and others legumes, several studies have reported the relationship between diet components, eating behaviors, and nutritional sta-tus of adolescents9,31,32. Adherence to the Mediterranean diet guidelines was associated with
BMI reduction in Greek adolescents33. The mechanism underlying the associations remains
unclear, but we suppose that such dietary patterns with low total energy in the diet are related to a balanced physical activity pattern and a general positive attitude about health.
In the present study, physically active adolescents consumed more cereals, fruits, meats, vegetables (for girls), and milk and derivatives (for boys). So, physical activity appears to be more associated with healthy choices, while sedentary activities are related more to unhealthy choices36. Ample evidence shows that high levels of physical activity are associated with heal-thy dietary habits. A recent study on Saudi adolescents has also reported a positive association between breakfast, consumption of fruits and vegetables and physical activity in males and females35. Another study, with adolescents from the Balearic Islands aged 12 to 17 years, have shown that active boys frequently consumed breakfast cereals and fresh fruit, and active girls consumed yogurt, cheese, breakfast cereals, and fresh fruit. Grao-Curces et al.36 also demons-trated that less sedentary adolescents showed greater adherence to the Mediterranean food pattern. In contrast, sedentary girls consumed high fat foods and soft drinks37. Among ado-lescents from Riyadh, Collison et al.38 found that exercise was positively correlated with fruit, vegetable and cereal without sugar intake in both genders.
When interpreting the indings of this study, some methodological issues must be addres-sed. This cross-sectional survey was conducted in samples of adolescents from 26 schools in six regions of Piracicaba, São Paulo. We cannot say that the results are representative of all Brazilian adolescents. The generalization therefore must be made very cautiously. Another important methodological issue is that a 58-item SFFQA was used to assess the quantity of foods consumed daily in this study. Dietary intake data collected via SFFQA may be crude because this instrument is restricted to a short list of food items. However, previous valida-tion study showed that the SFFQA has satisfactory reproducibility and reasonable validity among adolescents17. Accurate reporting of dietary intake for young people is also of con-cern. There may be errors in assessing the frequency of consumption of foods and dife-rences in perceptions of portion size. Under- and over-reporting of food intake may occur, particularly in this age group. However, this problem has been tackled by excluding indi-viduals with energy intake under or above a certain cutof point. Therefore, the problem of under- and over-reporting will not inluence the results seriously, if it exists. And inally, physical activity among youths is diicult to be measured, because the capacity to unders-tand and to recall the concepts of time, duration, and intensity of past activity is associated inversely with age. Despite its limitations, the study provided useful knowledge on com-pliance with the national dietary guidelines for Brazilian population.
CONCLUSION
ACKNOWLEDGMENTS
The authors would like to thank the Fundação de Amparo à Pesquisa do Estado de São Paulo
(FAPESP) for the inancial resources granted (protocol no. 06/61085-0). We gratefully ack-nowledge the participation of study subjects.
1. Golley RK, Hendrie GA, McNaughton SA. Scores on the dietary guideline index for children and adolescents are associated with nutrient intake and socio-economic position but not adiposity. J Nutr 2011; 141(7): 1340-7.
2. Lytle LA, Kubik MY. Nutritional issues for adolescents. Best Pract Res Clin Endocrinol Metab 2003; 17(2): 177-89.
3. Berkey CS, Rockett HR, Field AE, Gillman MW, Frazier AL, Camargo CA Jr., et al. Activity, dietary intake, and weight changes in a longitudinal study of preadolescents and adolescents boys and girls. Pediatrics 2000; 105(4): 56-66.
4. Niemeier HM, Raynor HA, Lloyd-Richardson EE, Rogers ML, Wing RR. Fast food consumption and breakfast skipping: predictors of weight gain from adolescence to adulthood in a nationally representative sample. J Adolesc Health 2006; 39(6): 842-9.
5. Maynard M, Gunnell D, Emmett P, Frankel S, Smith GD. Fruits, vegetables, and antioxidants in childhood and risk of adult cancer: the Boyd Orr cohort. J Epidemiol Community Health 2003; 57(3): 218-25.
6. McNaughton SA, Ball K, Mishra GD, Crawford DA. Dietary patterns of adolescents and risk of obesity and hypertension. J Nutr 2008; 138(2): 364-70.
7. De Henauw S, Gottrand F, De Bordeaudhuij I, Gonzalez-Gross M, Leclercq C, Kafatos A, et al. Nutrition status of lifestyles of adolescents from a public health perspective. The HELENA Project – Healthy lifestyle in Europe by Nutrition in Adolescence. J Public Health 2007; 15(3): 187-97.
8. Hassapidou M, Fotiadou E, Maglara E, Papadopoulou SK. Energy intake, dietary composition, energy expenditure, and body fatness of adolescents in northern Greece. Obesity (Silver Spring) 2006; 14(5): 855-62.
9. de Assumpção D, Barros MB, Fisberg RM, Carandina L, Goldbaum M, Cesar CL. Diet quality among adolescents: a population-based study in Campinas, Brazil. Rev Bras Epidemiol 2012; 15(3): 605-16.
10. Matthews CE, Hebert JR, Ockene IS, Saperia G, Merriam PA. Relationship between leisure-time physical
activity and selected dietary variables in the Worcester Area Trial for Counseling in Hyperlipidmeia. Med Sci Sports Exerc 1997; 29(9): 1199-207.
11. Gillman MW, Pinto BM, Tennstedt S, Glanz K, Marcus B, Friedman RH. Relationship of physical activity with dietary behaviours among adults. Prev Med 2001; 32(2): 295-301.
12. Jago R, Nicklas T, Yang S-J, Baranowski T, Zakeri I, Berenson GS. Physical activity and health enhancing dietary behaviours in young adults: Bogalusa Heart Study. Prev Med 2005; 41(1): 194-202.
13. Toral N, Slater B, da Silva MV. Food consumption and overweight in adolescents from Piracicaba, São Paulo, Brazil. Rev Nutr 2007; 20(5): 449-59.
14. Fundação Sistema Estadual de Análise de Dados (SEADE). Population and vital statistics: information from Sao Paulo’s cities. Disponível em: http://www. http://produtos.seade.gov.br/produtos/imp/. (acessado em 14 de março de 2011).
15. Enes CC, Slater B. Variation in dietary intake and physical activity pattern as predictors of change in body mass index (BMI) Z-score among Brazilian adolescents. Rev Bras Epidemiol 2013; 16(2): 493-501.
16. Slater B, Philippi ST, Fisberg RM, Latorre MR. Validation of a semi- quantitative adolescent food frequency questionnaire applied at a public school in São Paulo, Brazil. Eur J Clin Nutr 2003; 57(5): 629-35.
17. Voci SM, Enes CC, Slater B. Validation of a Food Frequency Questionnaire by food groups for the adolescent population. Rev Bras Epidemiol 2008; 11(4): 561-72.
18. Brasil. Ministério da Saúde. Secretaria de Atenção à Saúde. Departamento de Atenção Básica. Guia alimentar para a população brasileira: promovendo a alimentação saudável. Brasília: Ministério da Saúde; 2005. 236p. (Série A. Normas e Manuais Técnicos).
19. Rockett HR, Wolf AM, Colditz GA. Development and reproducibility of a food frequency questionnaire to assess diets of older children and adolescents. J Am Diet Assoc 1995; 95(3): 336-40.
20. Florindo AA, Romero A, Peres SV, Silva MV, Slater B. Development and validation of a physical activity assessment questionnaire for adolescents. Rev Saúde Publica 2006; 40(5): 802-9.
21. Pate PR, Freedson PS, Sallis JF, Taylor WC, Sirard J, Trost SG, et al. Compliance with physical activity-guidelines: prevalence in a population of children and youth. Ann Epidemiol 2002; 12(5): 303-8.
22. Lohman TG, Roche AF, Martorell R (Editor). Anthropometric standardization reference manual. Champaign (IL): Human Kinetics Books; 1988.
23. de Onis M, Onyango AW, Borghi E, Siyam A, Nishida C, Siekmann J. Development of a WHO growth reference for school-aged children and adolescents. Bull World Health Organ 2007; 85(9): 660-7.
24. Enns CW, Mickle SJ, Goldman JD. Trends in food and nutrient intakes by adolescents in the United States. Fam Econ Nutr Rev 2003; 15(2): 15-24.
25. Muñoz KA, Krebs-Smith SM, Ballard-Barbash R, Cleveland LE. Food intakes of US children and adolescents compared with recommendations. Pediatrics 1997; 100(3 Pt 1): 323-9.
26. Akman M, Akan H, Izbirak G, Tanriöver O, Tilev SM, Yildiz A, et al. Eating patterns of Turkish adolescents: a cross-sectional survey. Nutr Journal 2010; 9: 67-71.
27. Diethelm K, Jankovic N, Moreno LA, Huybrechts I, De Henauw S, De Vriendt T, González-Gross M, Leclercq C, Gottrand F, Gilbert CC, Dallongeville J, Cuenca-Garcia M, Manios Y, Kafatos A, Plada M, Kersting M; HELENA Study Group. Food intake of European adolescents in the light of diferent food-based dietary guidelines: results of HELENA (Healthy Lifestyle in Europe by Nutrition in Adolescence) Study. Public Health Nutr 2012; 15(3): 386-98.
28. Zhang CX, Chen YM, Chen WQ, Su YX, Wang CL, Wu JN. Food group intake among adolescents in Guangzhou city compared with the Chinese dietary guidelines. Asia Pac J Clin Nutr 2012; 21(3): 450-6.
29. Vatanparast H, Baxter-Jones A, Faulkner RA, Bailey DA, Whiting SJ. Positive efects of vegetable and fruit consumption and calcium intake on bone mineral accrual in boys during growth from childhood to adolescence: the University of Saskatchewan Pediatric Bone Mineral Accrual Study. Am J Clin Nutr 2005; 82(3): 700-6.
30. Agostoni C, Braegger C, Decsi T, Kolacek S, Koletzko B, Mihatsch W, Moreno LA, Puntis J, Shamir R, Szajewska H, Turck D, van Goudoever J; ESPGHAN Committee on Nutrition. Role of dietary factors and food habits in the development of childhood obesity: a commentary by the ESPGHAN Committee on Nutrition. J Pediatr Gastroenterol Nutr 2011; 52(6): 662-9.
31. Davis B, Carpenter C. Proximity of fast-food restaurants to schools and adolescent obesity. Am J Public Health 2009; 99(3): 505-10.
32. Borges CA, Enes CC, Slater B, Conde WL. BMI changes associated with dietary trends among Brazilian adolescents. ICAN: Infant, Child, & Adolescent Nutrition 2012; 4(6): 361-8.
33. Kourlaba G, Panagiotakos DB, Mihas K, Alevizos A, Marayiannis K, Mariolis A, et al. Dietary patterns in relation to socio-economic and lifestyle characteristics among Greek adolescents: a multivariate analysis. Public Health Nutr 2009; 12(9): 1366-72.
34. Maier IB, Özel Y, Wagnerberger S, Bischoff SC, Bergheim I. Dietary pattern and leisure time activity of overweight and normal weight children in Germany: sex-speciic diferences. Nutr Journal 2013; 12: 14-21.
35. Al-Hazzaa HM, Abahussain NA, Al-Sobayel HI, Qahwaji DM, Musaiger AO. Physical activity, sedentary behaviors and dietary habits among Saudi adolescents relative to age, gender and region. Int J Behav Nutr Phys Act 2011; 8: 140-53.
36. Grao-Cruces A, Nuviala A, Fernández-Martínez A, Porcel-Gálvez AM, Moral-García JE, Martínez-López EJ. [Adherence to the Mediterranean diet in rural and urban adolescents of southern Spain, life satisfaction, anthropometry, and physical and sedentary activities]. Nutr Hosp 2013; 28(4): 1129-35. [Article in Spanish]
37. Platat C, Perrin AE, Oujaa M, Wagner A, Haan MC, Schlienger JL, et al. Diet and physical activity proiles in French preadolescents. Br J Nutr 2006; 96(3): 501-7.
38. Collison KS, Zaidi MZ, Subhani SN, Al-Rubeaan K, Shoukri M, Al-Mohanna FA. Sugar-sweetened carbonated beverage consumption correlates with BMI, waist circumference, and poor dietary choices in school children. BMC Public Health 2010; 10(5): 234-46.
Received on: 06/04/2014