Original article
Gender and distance influence performance
predictors in young swimmers
Paulo Victor Mezzaroba State University of Maringá, Brazil
Marcelo Papoti
University of São Paulo, Brazil
Fabiana Andrade Machado State University of Maringá, Brazil
Abstract—Predictors of performance in adult swimmers are constantly changing during youth especially because the training routine begins even before puberty in the modality. Therefore this study aimed to determine the group of parameters that best predict short and middle swimming distance performances of young swimmers of both genders. Thirty-three 10-to 16-years-old male and female competitive swimmers participated in the study. Multiple linear regression (MLR) was used considering mean speed of maximum 100, 200 and 400 m efforts as dependent variables, and five parameters groups as possible predictors (anthropometry, body composition, physiological and biomechanical parameters, chronological age/pubic hair). The main results revealed explanatory powers of almost 100% for both genders and all performances, but with different predictors entered in MLR models of each parameter group or all variables. Thus, there are considerable differences in short and middle swimming distance, and males and females predictors that should be considered in training programs.
Keywords: short distance, middle distance, physiological parameters, biomechanical parameters
Resumo—“Gênero e distância influenciam preditores de desempenho em nadadores jovens.” Preditores de desempenho modificam-se constantemente na juventude devido ao início precoce das rotinas de treinamento sistematizado na natação. Sendo assim, o objetivo do estudo foi determinar o grupo de parâmetros que melhor prediz performances de curta e média distância em nadadores jovens de ambos os gêneros. Trinta e três nadadores competitivos de ambos os gêneros (10 a 16 anos) participaram do estudo. Foi utilizada regressão linear múltipla (RLM) considerando as velocidades médias de 100, 200 e 400m como variáveis dependentes, e cinco grupos de parâmetros como possíveis preditores (antropometria, composição corporal, parâmetros fisiológicos e biomecânicos, idade cronológica/ pilosidade pubiana). Os principais resultados revelaram poder de explicação próximo a 100% para ambos os gêneros em todas as performances, entretanto com diferentes preditores nos modelos de RLM. Logo, há consideráveis diferenças que devem ser consideradas em programas de treinamento entre preditores de performances de curta e média distância, para meninos e meninas.
Palavras-chaves: curta distância, média distância, parâmetros fisiológicos, parâmetros biomecânicos
Resumen—“Género y la distancia de influencia predictores del rendimiento en nadadores jóvenes.” Predictores de rendimiento en nadadores adultos cambian constantemente en la juventud, especialmente porque la rutina de entrenamiento comienza antes de la pubertad. Por tanto, el objetivo fue determinar el conjunto de parámetros que mejor predice el rendimiento de corta y media distancia de los nadadores de ambos sexos. Participaron 33 nadadores de ambos sexos (edad, 10-16 años). Regresión lineal múltiple fue usada considerando la velocidad promedio de 100, 200 y 400m como variables dependientes, y cinco grupos de parámetros como posibles predictores (antropometría, composición corporal, parámetros fisiológicos y biomecánicos, edad/vello púbico). Los principales resultados revelan explicación cercana al 100% para ambos sexos en todas las distancias, pero con diferentes modelos de predicción para cada grupo de parámetros o con todos los parámetros. Por tanto, existen diferencias considerables entre los predictores de cortas y media distancias en los niños y niñas que deben ser considerados en los programas de entrenamiento.
Introduction
The competitive participation and systematic training routine of swimmers usually start before puberty (Lätt et al, 2009); therefore, the performance of the young athletes depends not only on training but also on physical growth and development (Baxter-Jones, Eisenmann, & Sherar, 2005). Technical, physiological, and bodily parameters are identified as traditional adult performance predictors and major factors that influence performance improvement in youngsters, thereby highlighting differences between genders, different chronological ages, and maturational status throughout childhood and adolescence (Geladas, Nassis, & Pavlicevic, 2005; Jürimäe et al., 2007; Lätt et al., 2010; Lätt et al, 2009; Saavedra, Escalante, & Rodriguez, 2010; Vitor & Böhme, 2010; Zuniga et al., 2011).
In athletes of any age, body size is directly related to swimming speed. However, the influence of lean and fat mass on the performance of young swimmers remains to be fully clarified (Geladas et al., 2005; Pyne, Anderson, & Hopkins, 2006; Saavedra et al., 2010; Zuniga et al., 2011). It is known that being an aquatic modality, swimming is largely dependent on technical skills and the optimal combination of stroke rate (SR) and length (SL) that results in maximal speed and great swimming economy (Pelayo, Alberty, Sidney, Pordevin, & Dekerle, 2007). However, in young individuals, all anthropometrical changes strongly influence these technical indexes and, consequently, performance itself (Jürimäe et al., 2007; Lätt et al., 2009; Zamparo et al., 2008).
Furthermore, physiological parameters such as anaerobic threshold are widely used in swimming for training guidance. In particular, anaerobic threshold can be directly or indirectly determined by the lactate minimum (LM) protocol or critical speed (CS), respectively (Greco & Denadai, 2005; Ribeiro, Balikian, Malachias, & Baldissera, 2003; Toubekis, Tsami, Smilios, Douda, & Tokmakidis, 2011; Zacca et al., 2010), and greatly influences the performance of adult or young athletes, with an explanatory power of up to 97% (Altimari, Altimari, Gulak, & Chacon-Mikahil, 2007). However, the physio-logical maturity during puberty and gender-specific maturation process lead to marked changes in this parameter in children and adolescents (Armstrong & Mcmanus, 2011; Greco & Denadai, 2005; Mcmanus & Armstrong, 2011).
To our knowledge, no studies have investigated and compared different variables (chronological age, maturity status, anthropometrical, body composition, physiological and biomechanical parameters) as predictors of short and middle swimming distances in both genders in young swimmers. In addition, comparative data between male and female young swimmers at all puberty stages, according to pubic hair growth, are currently lacking. Therefore, this study aimed to determine the group of parameters that best predict short and middle swimming distance performances of young swimmers of both genders.
Methods
Participants
Thirty-three 10- to 16-year-old young swimmers (17 males and 16 females) of regional and national competing level participated in this study. They were undertaking systematic exercise training for a minimum of two years with an average training volume of 35 km·wk-1. Mean
descriptive characteristics for each gender group are shown in Table 1.
Chronological age (CA) was computed from date of birth and date of examination, and sexual maturity was auto-assessed, visually, using the five levels of pubic hair (PH) developed by Tanner (1962), although children and adolescents can more easily identify this sexual characteristic, pubic hair stages were compared with size of breasts stages in girls and size of genitalia in boys because some swimmers may shave the body. In the present study no difference were found between both analyses. Written, informed consent was obtained from subjects and their parents, and ethical approval was granted by the Local Research Ethics Committee (# 121/2010).
Experimental design
Body composition, anthropometrical and sexual maturity parameters were determined in laboratory. Thereafter, following a standard warm-up, in random order and according to the training schedule, participants swam distances of 100 and 400 m at maximum speed, and the Lactate Minimum protocol (LM), using front crawl, in a heated outdoor 50-m pool (25 ± 1°C). For all performances, it was determined the stroke parameters: stroke rate (SR), stroke length (SL) and stroke index (SI).
All tests were performed over 2 weeks with a minimum interval of 48 h between each pool test. Participants were instructed to attend for testing well-rested, well-nourished, and well-hydrated. Participants were also instructed to abstain from caffeine and to refrain from strenuous exercise during this period.
Anthropometry and body composition
Anthropometric measures included body mass (kg), height (cm), and lengths of the right upper (UL) and lower limbs (LL) (cm). All measurements were performed by a single assessor to minimize possible errors. Dual-energy X-ray absorptiometry (DEXA) (DPX-L, LUNAR Corp. Madison, WII, software version 3.6) was used to predict fat mass (g) and lean mass (g), and determine bone mineral content (BMC) (g) and density (BMD) (g·cm-2). The
Swimming speed corresponding to lactate minimum
The incremental protocol for the determination of LM started after an 8-min recovery period from a maximal performance of 200 m, which was used to elevate the blood lactate level and to determine S200. The incremental phase comprised five progressive performances of 200 m at intensities of about 80%, 84%, 88%, 92%, and 96% of S200, controlled by visual and audible signals, with 1-min intervals for blood sampling out of the pool (Fernandes, Sousa, Machado, & Vilas-Boas, 2011; Ribeiro et al., 2003; Tegtbur, Busse, & Braunmann, 1993).
Earlobe capillary blood samples (25 µL) was collected into a glass tube at the end of each stage of the incremental test and at the third, fifth, and seventh minute after lactatemia induction, during passive recovery, to ensure that there was sufficient increase of lactate concentration. From these samples, blood lactate concentration was subsequently determined by electro enzymatic methods using an automated analyzer (YSI 2300 STAT, Ohio, USA). The speed corresponding to LM was determined for each participant from the blood lactate concentrations (mmol·L-1) and the swimming speed (m·s-1) data obtained from the
incremental swimming test. The data were fitted by a second-order polynomial regression curve and the speed corresponding to LM was considered the swimming speed at the minimum point of this curve (Pardono et al., 2008). The higher lactate concentration obtained after lactatemia induction was considered the peak lactate (Lapeak).
Stroke parameters
Stroke parameters were determined during the execution of maximal performances (100, 200, and 400 m); the efforts started in the pool with a pushed off from the side of the pool at an audible beep. The total stroke cycles (SC) were counted and the time (T) taken to complete each distance was recorded using a manual chronometer, thereafter, the mean speed (S) of the 100-m (S100), 200-m (S200), and 400-m (S400) were calculated in m·s-1. The stroke parameters were calculated as follows
(Caputo, De Lucas, Greco, & Denadai, 2000; Pelayo et al., 2007):
SR = SC / T (cycles·s-1)
SL = S / SR (m·ciclo-1)
SI = SL / S
Critical speed
CS was determined for 4 distance combinations (CS1 = 100, 200 e 400 m, CS2 = 100 e 200 m, CS3 = 100 e 400 m, e CS4 = 200 e 400 m), using the slope of the linear regression between the swimming distances and time of covering each performance (Toubekis et al., 2011; Wakayoshi et al., 1992).
Statistical analysis
Data are presented as mean ± standard deviation (SD) and were analyzed using the Statistical Package for the Social Sciences 15.0 software (SPSS Inc., USA). The Shapiro-Wilk test was used to check the normality of the data distribution. The mixed analysis of variance (ANOVA) for repeated measures was used to compare the speed and stroke parameters between the 3 distances, LM values and 4 CS combinations, and both genders. Bonferroni adjustment was used for multiple-comparisons analysis. The independent-sample t test was used to compare the other variables between the genders. Multiple linear regression (MLR) analysis was used in each group of parameters (anthropometry, body composition, biomechanical, physiological and age/maturation) for both genders, with S100, S200, and S400 as dependent variables; the backward method was used with probability of F as criteria to include (p<0.05) or exclude (p>0.10) variables in the prediction models. In addition, another MLR analysis for each gender and performance using all the variables entered in each parameter group model was performed to determine the parameters that best explain these performances. Predictive equations for S100, S200, and S400 were generated for each gender using all the parameters entered in the model. The relationships between variables were examined using standard error of estimate (SEE) and statistical significance was set at p<0.05.
Results
The mean ± SD descriptive values for anthropometry, body composition, age/ maturation, biomechanical, physiological, and performance parameters are presented in Table 1. The mixed ANOVA for repeated measures indicated significant differences between distances (p<0.001) for speed, SR and SI, also significant differences between genders for speed (p=0.003), SR (p=0.014) and SI (p=0.035). The physiological variables (LM, CS1, CS2, CS3, CS4) showed an effect for gender (p=0.003), but not for the method of analysis (p=0.390). A post hoc analysis revealed that in long swimming distances, the SR, speed, and SI values were low for both genders (p<0.01). Moreover, the male swimmers presented higher values for speed, physiological parameters, and SI than did the female swimmers (p<0.01).
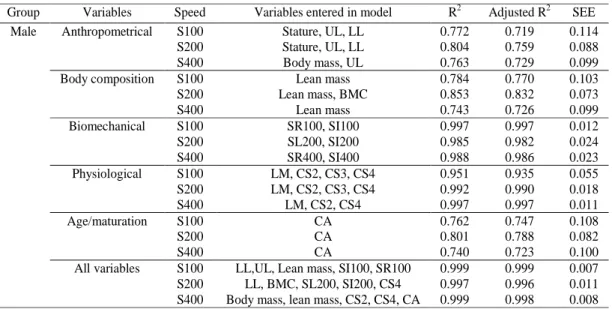
Tables 2 and 3 show the MLR parameters for each group of parameters. Among all the variables entered in the model, the biomechanical variables per se best explain S100 (99.7%) for males, and S100 (98.3%) and S200 (98.3%) for females, whereas the physiological variables best explain S200 (99.2%) and S400 (99.7%) for males, and S400 (99.2%) for females.
Variable group Variable Male (n=17) Female (n=16) Anthropometrical Body mass (kg) 53.947 ± 13.616 48.707 ± 8.662 Stature (cm) 161.120 ± 11.806 154.930 ± 8.986
UL (cm) 74.500 ± 6.768 71.567 ± 5.421 LL (cm) 85.488 ± 4.904 85.000 ± 6.495 Body composition Lean mass (g) 41413.120 ± 11225.240* 34383.670 ± 6058.702
Fat mass (g) 9468.588 ± 5004.469 10861.200 ± 3439.935 BMC (g) 2127.247 ± 579.699 1931.153 ± 385.622 BMD (g·cm-2) 1.052 ± 0.104 1.042 ± 0.076
Biomechanical SR100 (cycles·s-1) 0.675 ± 0.052* 0.589 ± 0.054 SR200 (cycles·s-1) 0.582 ± 0.060a 0.540 ± 0.068a SR400 (cycles·s-1) 0.541 ± 0.050ab 0.508 ± 0.063ab
SL100 (m·ciclo-1) 2.048 ± 0.294 2.041 ± 0.265 SL200 (m·ciclo-1) 2.180 ±0.419a 2.024 ± 0.348 SL400 (m·ciclo-1) 2.201 ± 0.434a 2.023 ± 0.373 SI100 2.879 ± 0.800 2.445 ± 0.502 SI200 2.793 ± 0.874* 2.197 ± 0.520a SI400 2.661 ± 0.877ab* 2.071 ± 0.546ab Physiological LM (m· s-1) 1.106 ± 0.129* 0.982 ± 0.077
Lapeak (mM) 6.639 ± 1.962* 4.960 ± 1.873
CS1 (m·s-1) 1.121 ± 0,187* 0.958 ± 0.107 CS2 (m·s-1) 1.165 ± 0.158c* 0.989 ± 0.079 CS3 (m·s-1) 1.125 ± 0.184* 0.961 ± 0.104
CS4 (m·s-1) 1.108 ± 0.200* 0.950 ± 0.118
Age/maturation CA (y) 13.559 ± 2.346 13.179 ± 2.255 PH 3.59 ± 1.004 3.600 ± 1.056 Speeds S100 (m·s-1) 1.381 ± 0.215* 1.195 ± 0.109 S200 (m·s-1) 1.255 ± 0.178a* 1.075 ± 0.092a S400 (m·s-1) 1.180 ± 0.190ab* 1.010 ± 0.105ab
Table 1. Mean ± Standard Deviation (SD) of independent variable groups: anthropometrical, body composition, biomechanical, physiological and age/ maturation; and speeds as dependent variables for male and female swimmers.
Note. S = speed; UL = upper limbs; LL = lower limbs; BMC = bone mineral content; BMD = bone mineral density; SR = stroke rate; SL = stroke length; SI = stroke index; LM = lactate minimum; CS = critical speed; CA = Chronological age. *p<0.05 compared to female group; ap<0.05 compared to 100 m; bp<0.05 compared to 200 m; cp<0.05 compared to LM.
Table 2. Multiple linear regressions to determine the group of parameters (i.e., anthropometrical, body composition, biomechanical, physiological, age/ maturation, all variables) that best predict 100, 200 and 400 m performances in boys.
Group Variables Speed Variables entered in model R2 Adjusted R2 SEE
Male Anthropometrical S100 Stature, UL, LL 0.772 0.719 0.114
S200 Stature, UL, LL 0.804 0.759 0.088
S400 Body mass, UL 0.763 0.729 0.099
Body composition S100 Lean mass 0.784 0.770 0.103
S200 Lean mass, BMC 0.853 0.832 0.073
S400 Lean mass 0.743 0.726 0.099
Biomechanical S100 SR100, SI100 0.997 0.997 0.012
S200 SL200, SI200 0.985 0.982 0.024
S400 SR400, SI400 0.988 0.986 0.023
Physiological S100 LM, CS2, CS3, CS4 0.951 0.935 0.055
S200 LM, CS2, CS3, CS4 0.992 0.990 0.018
S400 LM, CS2, CS4 0.997 0.997 0.011
Age/maturation S100 CA 0.762 0.747 0.108
S200 CA 0.801 0.788 0.082
S400 CA 0.740 0.723 0.100
All variables S100 LL,UL, Lean mass, SI100, SR100 0.999 0.999 0.007
S200 LL, BMC, SL200, SI200, CS4 0.997 0.996 0.011
S400 Body mass, lean mass, CS2, CS4, CA 0.999 0.998 0.008
Note. S = speed; UL = upper limbs; LL = lower limbs; BMC = bone mineral content; SR = stroke rate; SL = stroke length; SI = stroke index; LM = lactate minimum; CS = critical speed; CA = chronological age.
S100 = - 0.008 * [(-9.20 * Lean mass) + (1.014 * SR100) + (0.281 * SI100) + (0.002 * LL) - (0.003 * UL)]
S200 = 1.143 * [(0.002 * LL) (2.70 * BMC) -(0.421 * SL200) + (0.363 * SI200) + (0.227 * CS4)]
S400 = 0.065 * [(-0,001 * Body mass) + (3.21 * Lean mass) + (0.289 * CS2) + (0.692 * CS4) - (0.004 * CA)]
98.8% for S200 and 99.8% for S400 by the variables presented in the predictive equations below:
S100 = -1.122 * [(1.973 * SR100) + (0.566 * SL100)]
S200 = 0.886 *[(-0.495 * SL200) + (0.460 * SI200) + (0.183 * LM)]
S400 = -0.29 * [(6.43 * Lean mass) + (0.023 * SL400) + (0.165 * LM) + (0.839 *CS3)]
Discussion
The objective of the present study was to determine the group of parameters that best predict short and middle swimming distance performances of young swimmers of both genders. The main results revealed that when all the variables were considered in the prediction models, the male swimmers always had more variables included than the female swimmers did. Furthermore, the biomechanical variables per se best predicted S100 for both genders and S200 for females, whereas the physiological variables best predicted S400 for both genders and S200 for males.
Differences between genders were expected for some variables, primarily because most of the subjects were already in puberty (Armstrong & Mcmanus, 2011; Mcmanus & Armstrong, 2011). Other studies also demonstrated better performance and higher physiological and biomechanical parameter values in males than in females but higher fat mass in females than in males (Geladas et al., 2005; Greco & Denadai, 2005; Saavedra et al., 2010; Zuniga et al., 2011); however the differences in performance predictors between genders are not totally clear.
The present study demonstrated that when considering only biomechanical variables as predictors of S200, both genders had the same variables entered in the model; otherwise, the variables in each MLR analysis were not the
same, with a tendency for the males to have a higher number of parameters in each model than the females. Considering only “all variables” MLR models (Table 2 and 3), it was noted that even with the explanatory power being close to 100% for both genders in all the performances, the males required more variables to be included in each model, using all the independent groups for S100, S200, and S400 predictions, whereas the females required only 3 groups of parameters (body composition, physiology and biomechanical).
Few studies comparing performance prediction between genders primarily used anthropometric and body composition variables, indicating a negative influence of fat mass for young female sprint swimmers (Zuniga et al., 2011) and a positive influence of body size for both genders in short-distance swimming performance (Geladas et al., 2005). The same results were obtained in the present study, except that in addition to the negative influence of fat mass, for females, lean mass was also identified as a positive and important performance predictor; and for the males, bone components, probably representing the growth process, were also entered in the models.
Saavedra et al. (2010) developed a method of multivariate analysis to predict the performance of young swimmers based on multidimensional assessments. Among other non-specific tests as questionnaires and ground fitness tests, CA and a 30-minute test results were introduced into the models of both genders, and technique was entered in the male model. Despite presenting physiological and biomechanical representations in the prediction models, the objective of Saavedra et al. (2010) study was not to compare between the genders since CA was significantly different between males (13.6 ±0.6 years) and females (11.5 ± 0.6 years), possibly representing maturational and chronological differences.
In the literature, more data have been presented for male-Table 3. Multiple linear regressions to determine the group of parameters (i.e., anthropometrical, body composition, biomechanical, physiological, age/ maturation, all variables) that best predict 100, 200 and 400 m performances in girls.
Group Variables Speed Variables entered in model R2 Adjusted R2 SEE
Female Anthropometrical S100 Stature, UL 0.408 0.317 0.916
S200 Stature, UL 0.406 0.315 0.075
S400 Stature, UL 0.525 0.452 0.078
Body composition S100 Lean mass, Fat mass 0.524 0.445 0.081
S200 Lean mass, Fat mass 0.439 0.345 0.074
S400 Lean mass, Fat mass 0.357 0.250 0.091
Biomechanical S100 SR100, SL100 0.983 0.981 0.015
S200 SL200, SI200 0.983 0.980 0.013
S400 SL400; SI400 0.980 0.977 0.016
Physiological S100 LM, CS3 0.816 0.788 0.051
S200 LM, CS3, CS4 0.950 0.938 0.022
S400 LM, CS3 0.992 0.991 0.010
Age/maturation S100 - 0 0 0.111
S200 - 0 0 0.090
S400 - 0 0 0.105
All variables S100 SR100, SL100 0.982 0.978 0.016
S200 SL200, SI200, LM 0.988 0.985 0.011
S400 Lean mass, SL400, LM, CS3 0.998 0.997 0.006
only studies. Lätt et al. (2010) evaluated biomechanical, anthropometrical, and physiological parameters as predictors of S100 in male adolescent swimmers (15.2 ± 1.9 years) and found that SR and SI were optimal for predicting performance (93.6%). These variables were also entered in our model, along with lengths of the LL and UL, and lean mass, with 99.9% of explanatory power. These differences possibly occurred in the chronological age function because the subjects in the present study comprised children and adolescents at several maturity stages, thus increasing the influence of natural body size and composition modifications.
Similarly, Vitor and Böhme (2010) also found SI to be an S100 predictor, along with CS and anaerobic power, in a MLR model (R2=0.90; SEE=0.03) for male pubescent
swimmers aged 12 to 14 years. Similarly to the present study, maturity and age probably influenced the results because of the anaerobic system maturation period (Armstrong & Mcmanus, 2011).
For all swimming distances performances, particularly for the middle and long distance swimming performances, aerobic capacity has a great influence, with an explanatory power of up to 95% for S100 and up to 99% for S200 and S400 in the present study. This was also demonstrated by Vitor and Böhme (2010) using only CS (R2=0.34 for S100),
highlighting this method as an easy and non-invasive manner of aerobic capacity evaluation (Greco & Denadai, 2005; Toubekis et al., 2011).
Previous studies with age-specific subjects and the data from the present study of children and adolescents provided evidence that in an aquatic environment the technique is important (Jürimäe et al., 2007; Lätt et al., 2010; Pelayo et al., 2007; Saavedra et al., 2010; Vitor & Böhme, 2010), and emphasized that experience (years) is a factor influencing its improvement as well, especially in youngsters, with an increase in body size (Grimston & Hay, 1986; Lätt et al., 2009). In addition, taller swimmers have the advantages of greater SL and consequently lower SR at any distance, thus improving their biomechanical pattern (represented by SI) (Jürimäe et al., 2007; Pelayo, Sidney, Kherif, Chollet, & Tourny, 1996; Wakayoshi, D’Acquisto, Cappaert, & Troup, 1995; Zamparo et al., 2008).
Furthermore, a larger lean mass volume could also positively influence biomechanical values by enhancing the force applied in each stroke and the capacity to maintain good SI under exhaustion conditions (Alberty, Sidney, Huot-Marchand, Hespel, & Pelayo, 2005; Pelayo et al., 1996; Wakayoshi et al., 1995). Therefore, although anthropo-metrical and body composition parameters could not predict performance as well as physiological and biome-chanical parameters, they are closely related and influence each other, as evident in each “all variables” MLR model, in which the anthropometrical and body composition parameters were entered in all the male models, and in the S400 female model.
Conclusion
Coaches must be aware of genders specific needs and different distance specialties of young swimmers, given that for short and middle distance events, males and females presented different performance predictors. The biomechanical variables per se best explain S100 (99.7%) for the males, and S100 (98.3%) and S200 (98.3%) for the females, whereas the physiological variables best explain S200 (99.2%) and S400 (99.7%) for the males, and S400 (99.2%) for the females. A prediction power of almost 100% was noted when considering all the variables in the MLR models; however, due to the greater complexity observed in males, they required a larger number of variables entered into the models than the females did.
References
Alberty, M., Sidney, M., Huot-Marchand, F., Hespel, J.M., & Pelayo, P. (2005). Intracyclic velocity variations and arm coordination during exhaustive exercise in front crawl stroke. International Journal of Sports Medicine, 26(6), 471-475. doi: 10.1055/s-2004-821110
Altimari, J.M., Altimari, L.R., Gulak, A., & Chacon-Mikahil, M.P.T. (2007). Correlations between anaerobic threshold determination protocols and aerobic performance in adolescent swimmers. Revista Brasileira de Medicina do Esporte, 13(4), 245-250. doi: 10.1590/S1517-86922007000400007
Armstrong, N. & McManus, A.M. (2011). Physiology of elite young male athletes. Medicine and Sport Science, 56, 1-22. doi: 10.1159/000320618
Baxter-Jones, A.D.G., Eisenmann, J.C., & Sherar, L.B. (2005). Controlling for maturation in pediatric exercise science. Pediatric Exercise Science, 17(1), 18-30. Retrieved from http:/ /journals.humankinetics.com/pes
Caputo, F., De Lucas, R.D., Greco, C.C., & Denadai, B.S. (2000). Stroking characteristics in diferente distances in freestyle swimming and its relationship with performance. Revista Brasileira de Ciência e Movimento, 8(3), 7-14. Retrieved from http://portalrevistas.ucb.br/index.php/RBCM
Fernandes, R.J., Sousa, M., Machado, L., & Vilas-Boas, J.P. (2011). Step length and individual anaerobic threshold assessment in swimming. International Journal of Sports Medicine, 32(12), 940-946. doi: 10.1055/s-0031-1283189
Geladas, N.D., Nassis, G.P., & Pavlicevic, S. (2005). Somatic and physical traits affecting sprint swimming performance in young swimmers. International Journal of Sports Medicine, 26(2),139-144. doi: 10.1055/s-2004-817862
Greco, C.C. & Denadai, B.S. (2005). Critical speed and endurance capacity in young swimmers: Effects of gender and age. Pediatric Exercise Science, 17(4), 353-363. Retrieved from http://journals.humankinetics.com/pes
Grimston, S., & Hay, J. (1986). Relationship among anthropometric and stroking characteristics of college swimmers. Medicine and Science in Sports Exercise, 18(1), 60-68. Retrieved from http:/ /journals.lww.com/acsm-msse
Lätt, E., Jürimäe, J., Mäestu, J., Purge, P., Rämson, R., Haljaste, K., … Jürimäe, T. (2010). Physiological, biomechanical and anthropometrical predictors of sprint swimming performance in adolescent swimmers. Journal of Sports Science and Medicine, 9(3), 398-404. Retrieved from http://www.jssm.org/ vol9/n3/7/v9n3-7pdf.pdf
Lätt, E., Jürimäe, J., Haljaste, K., Cicchella, A., Purge, P., & Jürimäe T. (2009). Longitudinal development of physical and performance parameters during biological maturation of young male swimmers. Perceptual and Motor Skills, 108(1), 297-307. doi: 10.2466/pms.108.1.297-307
McManus, A.M. & Armstrong, N. (2011). Physiology of elite young female athletes. Medicine and Sport Science, 56, 23-46. doi: 10.1159/000320626
Pardono, E., Sotero, R.C., Hiyane, W., Mota, M.R., Campbell, C.S.G., Nakamura, F.Y., & Simões, H.G. (2008). Maximal lactate steady-state prediction through quadratic modeling of selected stages of the lactate minimum test. Journal of Strength and Conditioning Research, 22(4), 1073-1080. doi: 10.1519/ JSC.0b013e318173c594
Pelayo, P., Alberty, M., Sidney, M., Pordevin, F., & Dekerle, J. (2007). Aerobic potential, stroke parameters and coordination in swimming front-crawl performance. International Journal of Sports Physiology and Performance, 2(4), 347-359. Retrieved from http://journals.humankinetics.com/ijspp Pelayo, P., Sidney, M., Kherif, T., Chollet, D., & Tourny, C. (1996).
Stroking characteristics in freestyle swimming and relationships with anthropometric characteristics. Journal of Applied Biomechanics, 12 (2),197-206. Retrieved from http:// journals.humankinetics.com/jab
Pyne, D.B., Anderson, M.E., & Hopkins, W.G. (2006). Monitoring changes in lean mass of elite male and female swimmers. I n t e r n a t i o n a l J o u r n a l o f S p o r t s P h y s i o l o g y a n d P e r f o r m a n c e , 1( 1 ) , 1 4 - 2 6 . R e t r i e v e d f r o m h t t p : / / journals.humankinetics.com/ijspp
Ribeiro, L., Balikian, P., Malachias, P., & Baldissera, V. (2003). Stage length, spline function and lactate minimum swimming speed. Journal of Sports Medicine and Physical Fitness, 43(3), 312-320. Retrieved from http://www.minervamedica.it/ en/journals/sports-med-physical-fitness
Saavedra, J.M., Escalante, Y., & Rodríguez, F.A. (2010). A multivariate analysis of performance in Young swimmers. Pediatric Exercise Science, 22(1), 135-151. Retrieved from http://journals.humankinetics.com/pes
Tanner, J.M. (1962). Growth at Adolescence. Oxford: Blackwell Scientific Publications.
Tegtbur, U., Busse, M.W., & Braunmann, K.M. (1993). Estimation of an individual equilibrium between lactate production and catabolism during exercise. Medicine and Science in Sports and Exercise, 25(5), 620-627. Retrieved from http:// journals.lww.com/acsm-msse
Toubekis, A.G., Tsami, A.P., Smilios, I.G., Douda, H.T., & Tokmakidis, S.P. (2011). Training-induced changes on blood lactate profile and critical velocity in young swimmers. Journal of Strength and Conditioning Research, 25(6), 1563-70. doi: 10.1519/ JSC.0b013e3181ddfafc
Vitor, F.M. & Böhme, M.T.S. (2010). Performance of young male swimmers in the 100-meters front crawl. Pediatric Exercise Science, 22(2), 278-287. Retrieved from http://journals.human kinetics.com/pes
Wakayoshi, K., D’Acquisto, L.J., Cappaert, J.M., & Troup, J.P. (1995). Relationship between oxygen uptake, stroke rate and swimming velocity in competitive swimming. International
Journal of Sports Medicine, 16(1), 19-23. doi: 10.1055/s-002-5697
Wakayoshi, K., Ilkuta, K., Yoshida, T., Udo, M., Moritani, T., Mutoh, Y., & Miyashita, M. (1992). Determination and validity of critical velocity speed as an index of swimming performance in the competitive swimmer. E u ro p e a n J o u r n a l o f A p p l i e d Physiology and Occupational Physiology, 64(2), 153-7. Retrieved from http://link.springer.com/journal/421
Zacca, R., Wenzel, B.M., Piccin, J.S., Marcilio, N.R., Lopes, A.L., & Souza Castro, F.A. (2010). Critical velocity, anaerobic distance capacity, maximal instantaneous velocity and aerobic inertia in sprint and endurance young swimmers. European Journal of Applied Physiology, 110(1), 121-31. doi:10.1007/ s00421-010-1479-6
Zamparo, P., Lazzer, S., Antoniazzi, C., Cedolin, S., Ayon, R., & Lesa, C. (2008). The interplay between propelling efficiency, hydrodinamic position and energy cost of front crawl in 8 to 19-year-old swimmers. European Journal of Applied Physiology, 104(4), 689-699. doi:10.1007/s00421-008-0822-7
Zuniga, J., Housh, T.J., Mielke, M., Hendrix, C.R., Camic, C.L., Johnson, G.O., … Schimidt, R.J. (2011). Gender comparisons of anthropometric characteristics of young sprint swimmers. Journal of Strength and Conditioning Research, 25(1), 103-108. doi: 10.1519/JSC.0b013e3181b62bf7
Authors’ note
Paulo Victor Mezzaroba is associated with the Graduate Program in Physical Education, State University of Maringá, Brazil.
Fabiana Andrade Machado is with the Department of Physical Education, State University of Maringá. Maringá, Paraná, Brazil.
Marcelo Papoti is with the School of Physical Education and Sport at Riberão Preto. University of São Paulo, Ribeirão Preto, São Paulo, Brazil.
Acknowledgments
Supporting agency: Coordenação de Aperfeiçoamento de Pessoal de Nível Superior (CAPES)
Correspondence to:
Fabiana Andrade Machado
Universidade Estadual de Maringá (UEM) Depto. Educação Física
Programa de Pós-graduação Associado em Educação Física UEM/UEL Avenida Colombo, 5790 Bloco M05
CEP. 87.020-900 Maringá - PR Phone: (44) 3011-4315
Email: [email protected]
Manuscript received on March 28, 2013 Manuscript accepted on July 4, 2013